
You've been able to view an individual automation's performance for a while now. But what if you want to see how all your automations are doing at a glance, or compare them within given period of time?
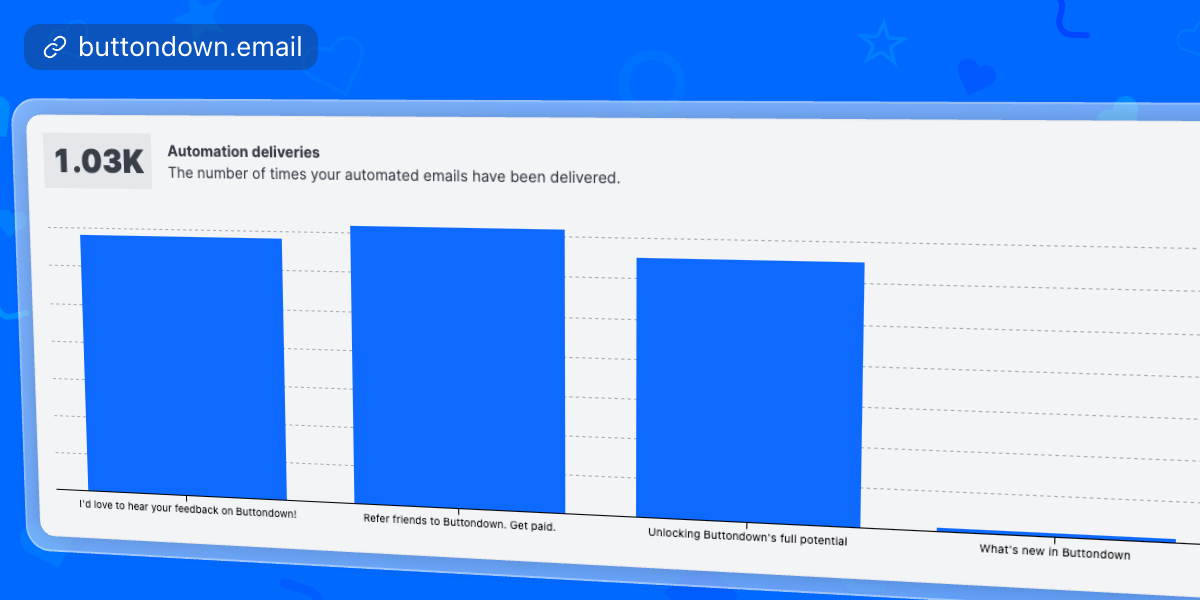
Now you can! If you've got automations, you can now view a bevy of analytics about them in aggregate. This includes:
- deliveries
- opens
- clicks
- open rate
- click rate
This is a great way to see how your automations are performing over time, and to identify any that might need a little extra love.
(Plus, any analytics you enable will automatically get included in your weekly report.)