
If you're using tags to segment your users — either by ingress (where they're coming from) or by content (what language they prefer, what genre of content they're interested in), you can now get analytics on how those tags are performing — specifically the "core four", a term I just made up: open rate, click rate, retention rate, and overall count.
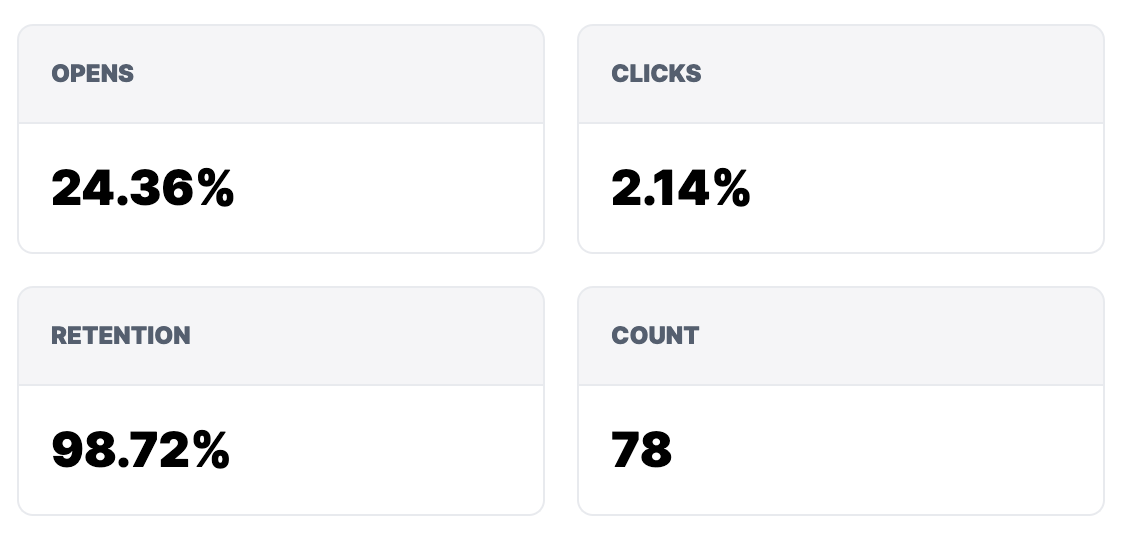
This is, admittedly, not a very fancy view at the moment. This is for boring reasons — I'm working on some underlying architectural changes to not just tag analytics but automation analytics and survey analytics to make them all unified. But at the very least, you get high-level information about how your cohorts are performing without having to bust out the abacus (or, more likely, a Google Sheet).