"Indicative only" - reviewing the Council's Green Belt capacity claims
Our last email looked at what the Local Plan would mean for traffic in S13.
This is the next in the series - and the one we teased at the end of that email: whether the proposed Green Belt sites can deliver the homes expected of them.
The whole Local Plan has a spare margin of just 298 homes. That is the difference between the 38,020 homes the Plan needs to deliver and the 38,318 the Council says it can deliver.
The Inspectors themselves describe this margin as "narrow".
So the site capacity figures matter. If they are wrong, even by a small amount, the Plan's housing supply no longer works.
The Council claims that the 11 proposed Green Belt site allocations can deliver 3,906 homes. For the main modifications consultation, the Sheffield Green Belt Alliance - of which Save S13 is part - has written a site-by-site analysis testing that claim against the Council's evidence: flood studies, ecological appraisals, heritage assessments, mining safety reports, and statements of common ground with bodies like Yorkshire Water, Natural England and the Coal Authority.
The numbers for each site were fixed in April 2025, before much of that evidence existed. Those capacities have not been revisited since, apart from removing land that was never available to build on.
Two findings come out of the capacity analysis.
First, by our estimates, a realistic constraint-led capacity for those 11 sites is between 2,385 and 2,672 homes - between a third and two-fifths fewer than the Council's claim.
Second, and more importantly, the Council has not shown how, or whether, the constraints documented in its evidence base have been reflected in its capacity figures at all.
That is the gap the Council needs to answer.
The full 40-page report is available on the website if you want to read the detailed site-by-site analysis.
What this analysis is - and what it is not
This is not an argument that the Council should build fewer homes on these sites.
The campaign's position is unchanged: these sites should not be released from the Green Belt at all. For S13, the right number of new homes on our Green Belt is zero.
So why test the capacities?
Because the Council's case for releasing the Green Belt rests on those capacity figures being realistic. Their argument is: the city does not have enough urban land for the homes it needs, so the Green Belt must be used. But that only works if the land released can deliver the homes claimed.
Our report takes the Council's evidence - site by site, constraint by constraint - and tests the claimed capacity figures against it. We are testing the Council's case on its own terms. By our estimate, the figures do not add up.
The Council may challenge these numbers. But what it has not done is explain how its figures reconcile with its evidence.
How the Council got its numbers
The capacities were calculated using the Housing & Economic Land Availability Assessment, or HELAA - generic estimates. They take a site's size, assume a percentage is developable (90%, 80% or 70%, depending on size), and multiply by a generic dwellings-per-hectare figure linked to broad transport accessibility.
That is a reasonable starting point when little is known about a site. But the HELAA itself says its findings should be used "in conjunction with and alongside other evidence" as site-specific evidence is gathered.
For these 11 sites, much of that evidence came later - produced after the original consultation closed, while hearings were underway, or even after site-specific hearings had finished.
But the capacity figures have not been revisited in light of that new evidence. The numbers in front of the Inspectors are still the numbers calculated before it existed.
The Council’s response is to make the figures “indicative”. One of the Main Modifications - MM223 - now inserts wording stating that:
the dwelling capacities shown in this Annex (and in Part 1, Appendix 1) are indicative only.
Indicative. The figures used to justify releasing the Green Belt are now presented by the Council as suggested capacities, not outcomes. But the label changes nothing: they still have to be realistic, and the Council hasn't shown that they are.
What site-specific reality looks like
The pattern of over-estimation is consistent across the 11 sites. When generic figures meet the site-specific evidence, the realistic capacity falls by roughly one-third to two-fifths.
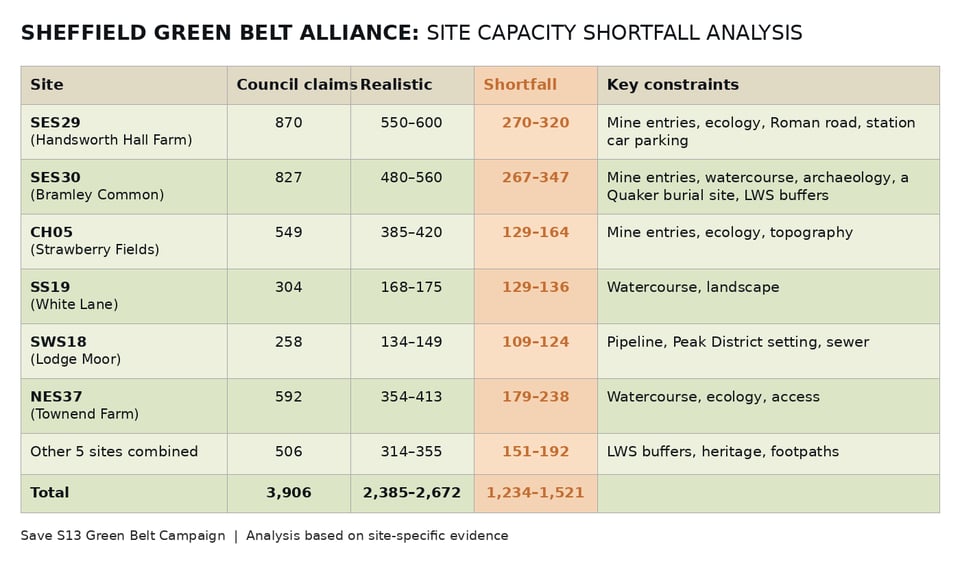
The two sites our traffic consultant looked at last week - SES29 and SES30 - together account for almost half of the total overstatement. Between them, the Council claims 1,697 homes. A realistic figure is 1,030 to 1,160.
Some examples of what site-specific evidence forces into the calculation:
- SES29 must accommodate train station car parking required by MM410, no-build zones around three mine entrances, ecological buffers, and identified archaeological constraints across the eastern parcel. The 80% net developable assumption is contradicted by the site promoter's masterplan, which uses 61%.
- SES30 is affected by extensive mining-risk areas, including a Development High Risk Area across much of the northern field and areas of past or probable shallow coal mine workings. It also has to accommodate watercourse buffers, identified archaeology, an allowance for the Quaker burial site, the buffer required where the site meets Shirtcliff Wood / the Local Wildlife Site, and drainage requirements that take up nearly 10% of the site.
These are not minor details. They affect how much of the land can be built on.
"Fine, we'll build fewer homes" - why that response doesn't work
There is an obvious response the Council could make: "If SES29 will deliver 600 homes instead of 870, fine, we'll build 600. Isn't that what you want?"
No, for two reasons.
First, Green Belt release is not a sliding scale. The justification for taking land out of the Green Belt is that there is nowhere else for those homes. If 600 is the real number for SES29 and 500 for SES30, then those figures - not 870 and 827 - should have been the basis on which Green Belt release was judged necessary. They were not.
Second, the arithmetic of the Plan has no room for that concession. SES29 alone, corrected to a realistic 600 homes, leaves a surplus of just 28. SES30, corrected on the same basis, turns the Plan into a shortfall. Apply the corrections across all 11 sites and the spare margin is gone four to five times over. Put another way: an overstatement of just 7-8% across the allocations would wipe out the margin. Our report identifies 32-39%.
The Council cannot say the capacities are lower than claimed and the Plan is sound in the same breath. The National Planning Policy Framework requires a plan to be "justified" and "effective". A plan whose central numbers are only indicative, and which cannot survive their correction, is neither.
The bigger trap: more Green Belt up for grabs
If the Plan is adopted using inflated capacity figures, Sheffield risks discovering the shortfall later - after the Green Belt has already been released.
The Plan already leans heavily on "windfall" - sites that have not yet been identified, but are expected to come forward over the Plan period. 8,287 dwellings - 22% of the entire Plan supply - are already assumed to come from windfall.
Using more windfall to cover a 1,200–1,500 home shortfall is not credible. The Council itself accepts that the lowest-hanging fruit has already been picked, and the Inspectors have flagged the windfall assumption as a risk.
That leaves the risk of further Green Belt release.
This is not an abstract concern. In February 2025, the Inspectors asked the Council to look at smaller greenfield sites across the city, describing it as a "reasonable alternative strategy". Dispersed Green Belt release now sits in the evidence base as an option. The door is already open.
This is the unspoken consequence of leaving the capacity figures unresolved. If the homes do not materialise, the Council comes back for more Green Belt within the same Plan period.
The answer is not to find more Green Belt sites. The answer is to accept that the case for releasing these sites has not been made on realistic figures, and to remove them. The Council should go back and test whether urban capacity has been exhausted, whether the windfall assumption stands up, and whether the housing requirement reflects what Sheffield can deliver.
The conversation with residents has not happened. Sheffield is being asked to accept a Plan whose Green Belt numbers have still not been reconciled with the Council's evidence.
What the Alliance report asked for
The submission to the Inspectors made two requests. Either:
- The affected allocations should be deleted; or
- The housing trajectory and Green Belt release strategy should be reassessed using constraint-led capacities.
Neither outcome leaves the Plan "sound" as it stands. Either would require major further work before adoption.
Where this sits
The Main Modifications consultation has closed. The Inspectors will now weigh the submissions and issue their final report on whether the Plan, as modified, is sound. After that, the Plan returns to Sheffield City Council for adoption - a vote of Full Council.
Councillors will have to decide whether they are satisfied that the figures they are voting on reconcile with the constraints the Council's evidence has documented.
For S13, this matters directly. SES29 and SES30 together represent the largest single block of the overstatement. For the wider city, it matters because a Plan that looks sound on paper but breaks against its own evidence will inevitably return to swallow more Green Belt.
The capacity question is not a side issue. It is the arithmetic on which Green Belt release rests. If the arithmetic has not been done, the case for release has not been made.
In the next email, we'll look closely at the quality of the farmland the Council intends to build on. An incredible 73.4% of the proposed Green Belt release is agricultural land, some of it the best in the country. We'll dive into those details next.
-The Save S13 Green Belt Campaign
What you can do right now
- Share this update: Forward this email to neighbours in S13 who care about our Green Belt.
- Read the full report: Take a look at the full 40-page Alliance report on the website.
