
Hairy election margins map
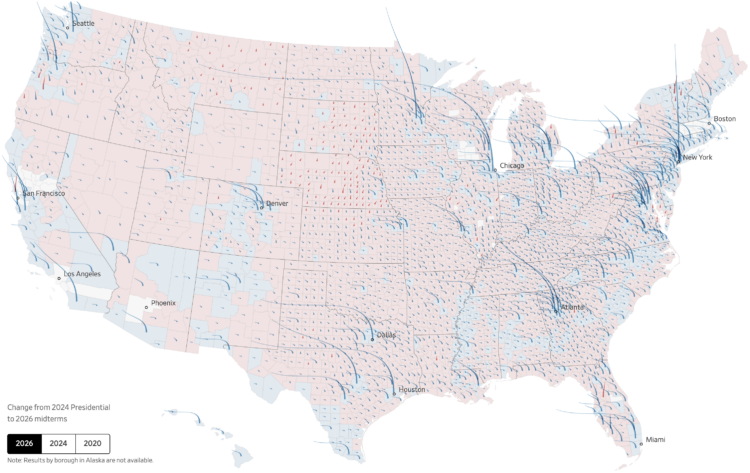
You’ve seen maps of the results and maps of the shifts. For the Wall Street Journal, Chiqui Esteban and Anthony DeBarros combined results and shifts into a single map using an interesting aesthetic that looks like strands of hair sprouting off the United States.
The base map shows county-by-county results for the predominant party between Democrat and Republican. The hair strands start as spikes pointing straight up, as we’ve grown used to over the years. The height of a spike represents the margin of victory versus the opposing party.
Scroll to the next step. The spikes bend to represent the swing, in comparison to the previous election, like strands of hair that blow in the wind. A deeper bend represents a greater swing for the county.
There’s a lot going on but it works. I approve of this hairy metaphor.
Tags: elections, midterm, Wall Street Journal
Data exploration, manually and intentionally
Randy Au on the manual process of exploratory data analysis that is still irreplaceable:
While I’m fine offloading specific tasks to an LLM, I find they’re just really terrible when given any leeway with decision-making. Since there’s no absolute positive/negative feedback in an analysis, typical coding agent harnesses have no way to tell if their analysis has completely flown off the rails. While toying with the idea, I’ve seen Claude get a peculiar idea that obviously takes assumptions that doesn’t apply to the data and attempt to build a giant testing harness around that analysis idea. I watched it run to completion and asked some pointed questions about why it was doing that and it did the “oh! my bad!” routine. You can jump through all sorts of hoops and harnesses to try to get a handle on things, but the only creativity I’ve encountered with this process is how it comes up with new and unimaginable ways to do the wrong thing.
When you know exactly what you want, generative AI is useful for joining that dataset or making that one chart. Exploratory data analysis relies on not having an exact answer and relying on clues during the process to guide you.
This will evolve as the LLMs grow more extensive, but for now, analysis output from the chatbots converge towards generic results without outside guidance.
Tags: automation, Large Language Model, Randy Au
Shifting chart options

We’re fresh off Midterm elections, which provides a night that is plentiful of maps and charts. In this week’s The Process, we look at the ones that highlight the big shifts and see how changing focus can change the story.
Become a member for access to this and the archive of 412 other guides, tips, and roundups. It is the best way to support this nerdy corner of the internet.
Thanks,
Nathan
FlowingData is 100% made possible by members. Join today and get access to courses, guides, and more resources from this real person (me, Nathan).