
Swings in Texas over the years
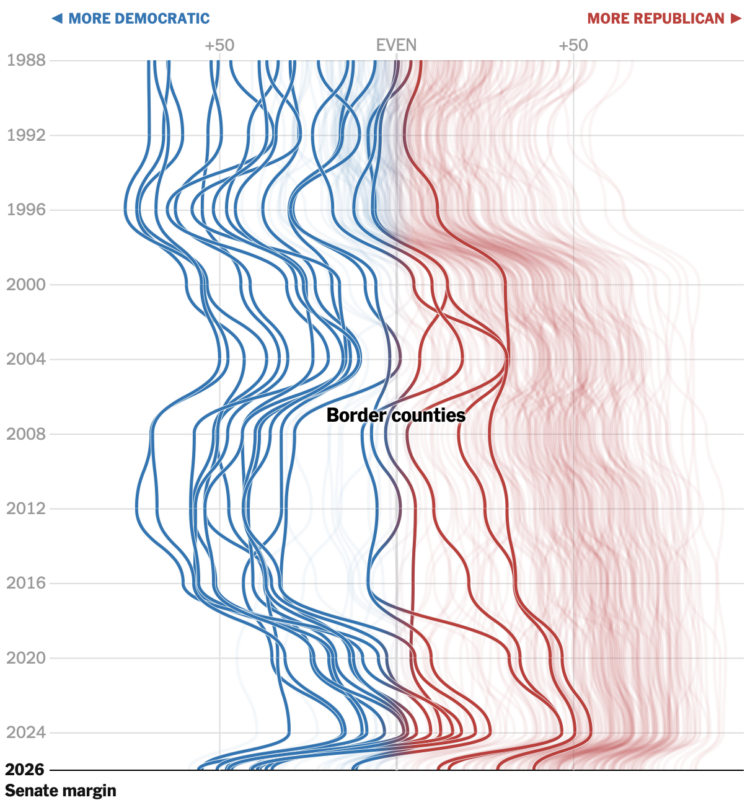
The New York Times produced a series of charts for the shift in Texas. The multi-line chart above shows the changes over time for each county. All the lines take a sharp left at the bottom.
Tags: elections, New York Times, partisanship, Texas
FlowingData is 100% made possible by members. Join today and get access to courses, guides, and more resources from this real person (me, Nathan).
Don't miss what's next. Subscribe to FlowingData Daily: