Who Wants to Be a Billionaire
I made a joke a little while back on Twitter that, given the choice between having my bed magically made up with fresh, clean sheets every day or a one-time payment of $1 million dollars, I might opt for the sheets over the money. Someone pointed out that I could probably use the money to arrange the sheet situation, but there’s something about the magic element that I find very compelling.
Nonetheless, it did get me thinking of the buying power of $1 million and how a lot of pop culture has framed $1 million as a lot of money. Don’t get me wrong, I wouldn’t turn down a million bucks if it were offered, but compared to some of the major wealth in this world, a million dollars feels puny. Anyway, all this is a set up for today’s newsletter, in which we are going to look at what $1 million dollars looks like through a few different lenses.
She Works Hard for the Money
Okay, so we’re going to look at some US Census Bureau data to begin. There’s a lot of data available from the Census Bureau; it’s like my fantasy land. I had an alert set on my calendar for the release of the 2020 Census data and it will definitely come up in future newsletters too. But, whew, it does not pull punches.
In the spreadsheet for today’s newsletter, you can find some of the stats on how income breaks down by binary reported sex, and on the Census Bureau’s site itself, you can see some of the extremely damning numbers once you bring race into the data.1 This doesn’t even delve into the breakdown of the five racial categories the census uses or any of the other issues with the census itself. But let me stay on topic here.
The three historical income categories reported in the census data are per capita, median, and mean income. Per capita gives us the total reported income of US residents (not just citizens) divided by the number of potential earners. The mean is the average of actual earners, so it’s going to be a little higher than the per capita. Median income tells us the amount in the middle, aka half of the people earn more, half earn less.
If ten people are counted in a census and their total earnings are $1 million, their per capita income would be $100,000. If one of them doesn’t actually earn anything that year, then the mean is going to be divided by 9, not 10, giving a mean income of $111,111. And the median will depend on each individual’s income, which means it could vary quite a bit. I know you all already know all this probably, so sorry for the recap, but just in case.
In 2020, the per capita income was $39,052, the mean income was $53,996 and the median income was $36,034. I always like to compare the median and mean of data sets, because that tends to tell you how the data is trending. If the mean is higher, that tells you that there are a few outliers at the top skewing things up. If the median is higher, that tells you the outliers are at the bottom. Wait ‘til the forthcoming newsletter on Congress to see more of this.

Because the median is the lower number here, I’m going to work with that one. Based on the median income in 2020, someone would have to work for 27.75 years at that income to earn $1 million. But obviously that doesn’t factor in inflation and, of course, that’s gross income, not net income. If you look at the historical data, someone who made the median income every year would have had to start working in 1968 to earn $1 million cumulatively. That’s 53 years working. Not to put too fine a point on it, but Jeff Bezos makes approximately $1 million every 7 minutes.
The Billionaires List
Speaking of Jeff Bezos, let's look at the billionaires for a minute. Because the US is what it is, the terms “Millionaire” or “Billionaire” refer to someone with a net worth exceeding that amount in US Dollars. If we determined it by the Russian Ruble or something, I’d be a millionaire. But so would a lot of other people.
The first confirmed billionaire was John D. Rockefeller, noted oil magnet and betrayer of Cleveland.2 Rockefeller is still one of the wealthiest people in history, according to a lot of wiki pages and articles, however all of these exclude monarchs and autocrats and that just seems weird. Rockefeller’s net worth, in 2020 USD is estimated to be around $418 billion. By comparison, Jeff Bezos’s net worth last year was estimated at only $177 billion. Though, considering Bezos managed to increase his net worth by 35% over 2020, and by 143% since 2016, it’s not out of the realm of possibility that he could top Rockefeller’s record within the next five years.
Every year since 1987, Forbes Magazine publishes a list of the world’s billionaires. I could only find the records of that list in full3 dating back to 1996. Back in 1996, there were 423 billionaires with a combined net worth of $1.05 trillion dollars. Last year there were 2,755 billionaires with a combined net worth of $13.1 trillion dollars. The most interesting thing about that growth is that there are 6.5 times as many billionaires, but they hold 12.5 times as much money.

I found two different sets of numbers, both of which purported to be based on the Forbes list over the years, but which had some slight differences. Only one could be easily scraped to produce the above chart, but that one had slightly lower numbers.4 Regardless, it does a pretty good job at illustrating the growth. Obviously 2009 was a hard year for the billionaires, but don’t feel too bad for them, they pay people to do that for them. Plus, while we were all waiting for the government to cut some $2,000 checks last year, they managed to increase their combined net worth by 63%.
Not to get too “eat the rich” here, but to give you a little sense of scale, those 2,755 people hold 2.5% of the net worth of the world, which a McKinsey report estimated to be about $510 trillion in 2021. The world population in 2021 was about 7.9 billion people. So that means that 0.000035% of the population held 2.5% of the wealth. That leaves the average net worth of everyone else at just under $63,000. Obviously this isn’t taking into account the 56.1 million millionaires which, if we factored in their combined net worth, would bring that number for the other 7.8 billion people down considerably. So, you know, fire up the barbecue.
But we aren’t here to discuss billions, we’re talking millions. And with 56.1 million people who qualify as millionaires by net worth, that data is harder to come by. I can tell you this much: even though 56 million feels like a lot of people, that still represents less than 1% of the global population.
Who really wanted to be a millionaire?
What if we look at the pop culture phenomenon that brought the idea of becoming a millionaire into millions of living rooms at the turn of the century? Would you like to phone a friend? Who Wants to Be a Millionaire premiered in the UK on ITV in 1998 and in the US on ABC in 1999. The UK version ran from 1998 to 2014 and saw only five people win the top prize.
The US prime time version only ran from 1999 to 2002,5 but in that shorter time, saw nine people with the top prize. Let’s not try to guess why that is, because I really don’t want to get into a debate over who’s smarter between the people who elected Trump and TERF Island.
When I started today’s newsletter, I thought it was going to go in a different direction, looking at the buying power of $1 million over time, so I decided to focus on the UK version, since it ran longer. Now that I’ve gone in a slightly different direction, it might make sense to include the US version too, especially since there were more winners and hence a larger sample set, but as I’ve stated more than once, this is a free little newsletter with a very small subscriber list, so I’m not going to do that. So let’s look at the five UK winners. They were all relatively early in the run of the show; no one won the top prize for the last 8 years that it was on the air.

Based on the exchange rate of GBP to USD, the winner of the biggest pot seems to be Ingram Wilcox, with £1 million coming out at almost $2 million. But when you consider he won it at the peak of the stock market, right before the Great Recession, maybe that’s the wrong way to look at it. In fact, I started thinking about the winnings in relation to my original question: how could I turn $1 million into endless clean sheets on my bed. And the answer seemed to be magical after all; which is to say: the stock market.
Now, I know my father is probably reading this, so maybe I shouldn’t admit it, but I don’t really understand how the stock market works. I arguably have more than the median stock knowledge of people in the US, but really, I understand it like I understand audio engineering:6 something goes in, *magic*, more something comes out. But what I do understand is how to google historical stock prices.
So here’s what we’re going to do: we’re going to look at a few mutual funds and stocks, and see what these winners could have created out of their top prize winnings.7
Up first: Vanguard 500 Index Fund Admiral Shares aka VFIAX, a mutual fund that debuted on the market a week before Judith won the first £1 million prize on the show. If each winner had purchased VFIAX with their winnings on the next business day, they would have the following returns today:

Certainly no billionaires on this list, but they still would be doing okay. What if, instead, they purchased Apple stock, aka APPL? Certainly wouldn’t be a bad investment, though the first four winners would have faired considerably better than Ingram, who won well after Apple’s comeback began, but he still would have been comfortable. Still no billionaires though.

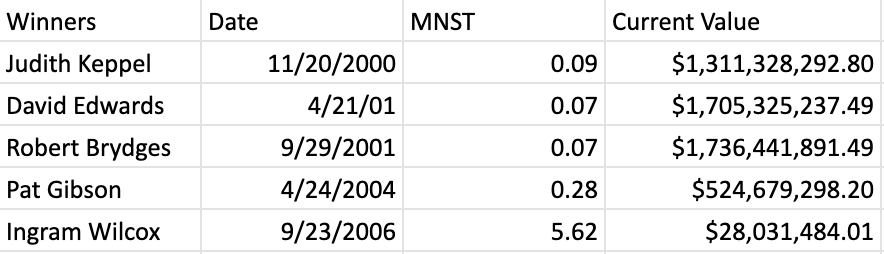
The real winners, however, would have been the ones who bought stock in Monster beverage company. Yes, the drink of Young People in AA (YPAA) and bros the world over. Ingram and Pat would have done better buying APPL. But for the rest of the winners, they could have bought MNST at less than ten cents a share. If they had seen the potential in that fluorescent energy drink at the time, today they would be among those 2,755 billionaires, as MNST has been the top performing stock of this century.
How did we get here
I have no idea, dear reader. This newsletter was a bit of a meandering journey, held together by the thread of $1 million, more than the thread count of my imagined magical sheets. We talked about billionaires and millionaires and incomes and prize shows. And somehow all of that led us to this.

I don’t know what the take away is here, except that money, the stock market, and energy drinks are all weird and Jeff Bezos is kleptocrat. As usual, you can find all the data from today’s newsletter in this spreadsheet. Stay tuned for more useless data next week.
-
The mean income of a white man in 2020 was $67,391, while the mean income for a black woman was $38,106. ↩
-
It’s fine, just build your success in Cleveland and leave us for NYC. You won’t be the last. ↩
-
Please note that this being a free newsletter with very limited circulation, when I say “I couldn’t find” or something similar, that really translates to “I did 2-3 google searches and then gave up.” ↩
-
Sometimes they were the same, sometimes not. Some of that can be explained for one list counting individuals, and another counting families ie. the Waltons versus each individual Walton, but that wouldn’t account for all the discrepancies. ↩
-
The US version spent over a decade after that in syndication. ↩
-
The only class in college that I almost failed. ↩
-
We will, for the sake of the experiment, not be considering taxes or payment schedules or anything. We’re going to pretend like they all got £1 million on the day their episode aired, and invested it immediately. ↩