preview 598: quantum of sollazzo
#598: quantum of sollazzo – 25 February 2025
The data newsletter by @puntofisso.

Hello, regular readers and welcome new ones :) This is Quantum of Sollazzo, the newsletter about all things data. I am Giuseppe Sollazzo, or @puntofisso. I've been sending this newsletter since 2012 to be a summary of all the articles with or about data that captured my attention over the previous week. The newsletter is and will always (well, for as long as I can keep going!) be free, but you're welcome to become a friend via the links below.
I am excited to announce I'll be a judge for this year's Information is Beautiful Awards - a celebration of global excellence in data visualization, something that this newsletter has covered for almost a decade. Stay tuned for the Longlist announcement on March 10th! You can also meet all the judges here.

The most clicked link last week was SQLNoir, an interesting way to learn SQL by solving a crime with queries.
Also, a quick correction: last issues missed the link to the EDJNet's article about solar energy in Europe. Here it is: Solar energy in Europe’s countryside: huge potential, complex challenges.
It's AMA o'clock! This is the Quantum of Sollazzo Ask Me Anything section.
AMA – Ask Me Anything by submitting a question via this anonymous Google form. If there are many questions, I'll select a few every 4-5 weeks and answer them on here :-) Don't be shy!

The Quantum of Sollazzo grove now has 25 trees. It helps managing this newsletter's carbon footprint. Check it out at Trees for Life.
'till next week,
Giuseppe @puntofisso.bsky.social
Events
- On Thursday, 20 March, Connected by Data are running an unconference: Engaging people on data and AI: giving people and communities a powerful say on public sector technologies. It's in London - travel assistance available - and is part of a wider project on public involvement in data and AI, including their online community of practice (next one of those is 12 March).
✨ Topical
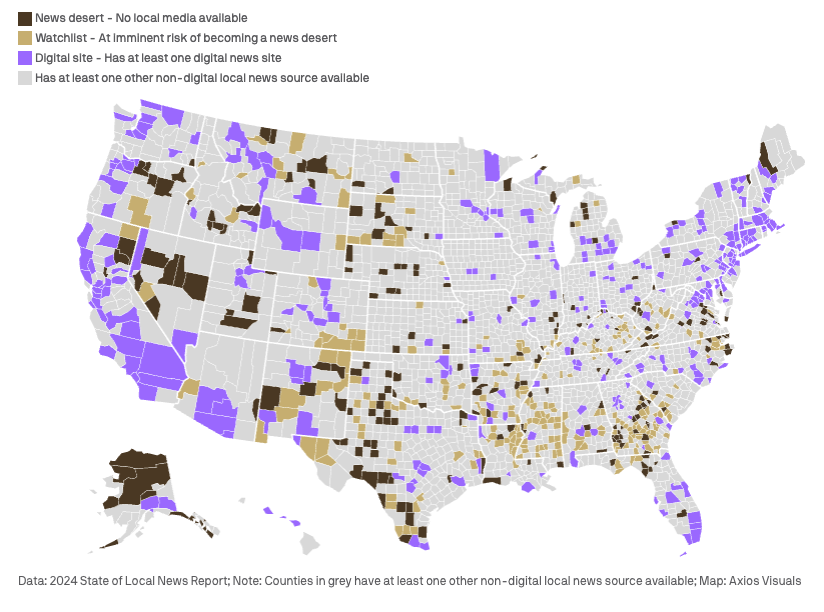
Most U.S. counties have little to no local news sources
Sara Fischer (Axios): "An uptick in newspaper closures this year has left more than half of the nation's 3,143 counties — or 55 million people — with just one or no local news sources where they live."
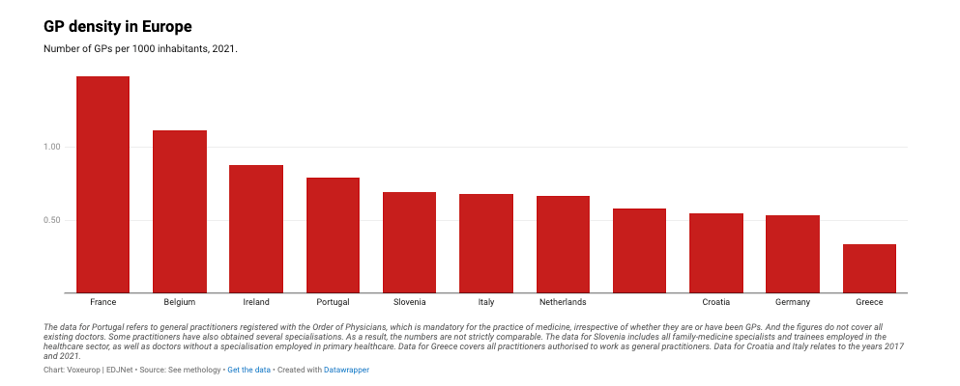
Europe is short of General Practitioners
Adrian Burtin for Voxeurop/EDJNet: "Europe is facing a shortage of doctors, across all specialisations. The deficit of general practitioners is a particular problem. Family doctors are ageing and unevenly distributed, and their profession is struggling to attract new recruits."
For comparison, you can find some data about England here.
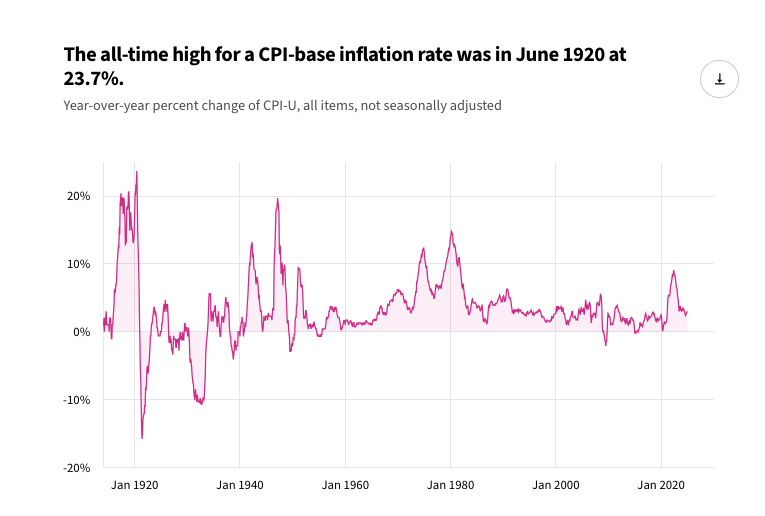
What is the current inflation rate in the US?
Historically speaking, it's not that bad. The 1920s were absolutely terrifying. USAFacts reports. Also, look at their other article on the same topic.
No, 150-Year-Olds Aren’t Collecting Social Security Benefits
David Gilbert, for Wired: "Elon Musk claims to have found rampant fraud in the Social Security Administration. There’s a much simpler explanation."
TL;DR: COBOL. It's interesting to understand the impact of legacy software in this hotly debated issue.
Brain food, delivered daily
Every day we analyze thousands of articles and send you only the best, tailored to your interests. Loved by 505,869 curious minds. Subscribe.

🛠️📖 Tools & Tutorials
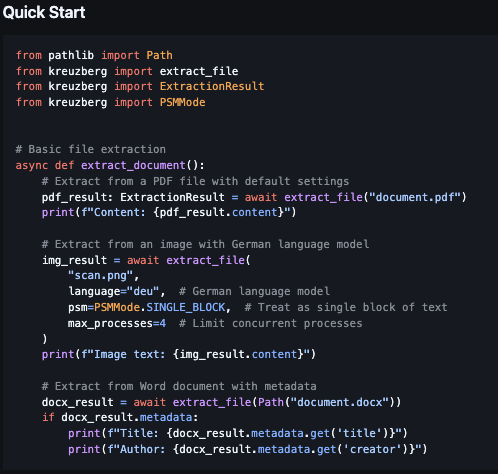
kreuzberg
"A text extraction library supporting PDFs, images, office documents and more".
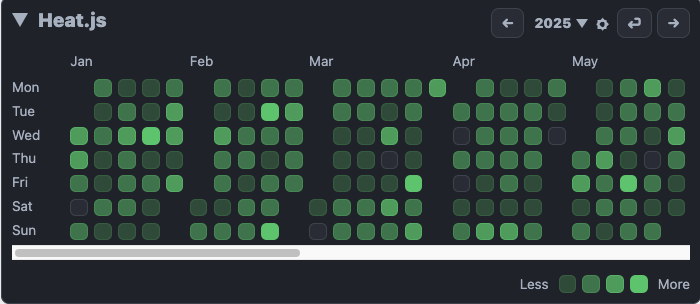
Heat.js
As you can gather from its name, it's a powerful Javascript library to create custom heat maps and charts. It seems to be pretty versatile, and cover a few different use cases.
Learning web extensions
"This covers all the basic information required to get started with web extension development. The extension can be as simple as changing the colour of text on the page or as complicated as a full-fledged application."
It's very comprehensive, and there's quite a bit of interactivity.
Friends Don't Let Friends Make Bad Graphs
This repository is going to be pretty handy to learn about (how to avoid) bad charts.

"A calculator app? Anyone could make that."
It's trickier than you'd think, and this blog post explains the coding challenge step-by-step. This is where software engineering meets algorithm development meets theoretical computer science.
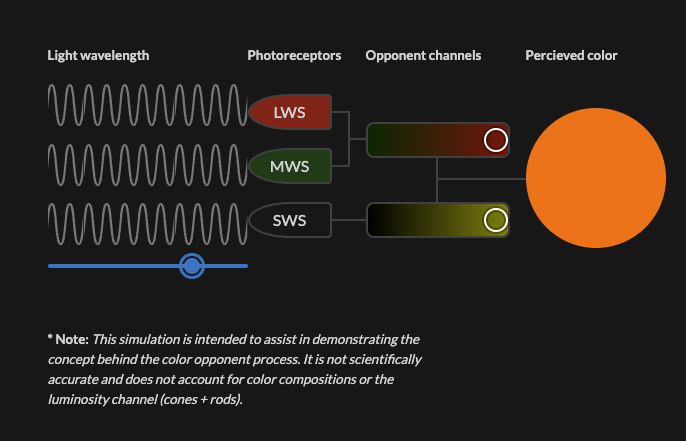
An interactive guide to color & contrast
"A comprehensive guide for exploring and learning about the theory, science, and perception of color and contrast."
Preswald
"Preswald is a full-stack platform for building, deploying, and managing interactive data applications. It brings ingestion, storage, transformation, and visualization into a simple SDK, minimizing complexity while maintaining flexibility for both prototyping and production-grade use cases."

📈Dataviz, Data Analysis, & Interactive
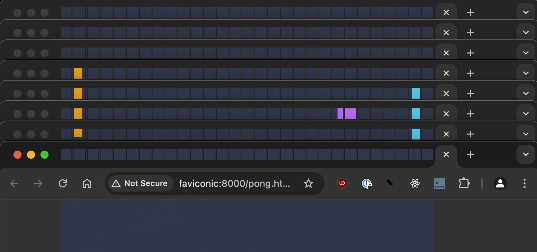
Running Pong in 240 Broswer Tabs
An idea for dataviz?... (don't, just don't).
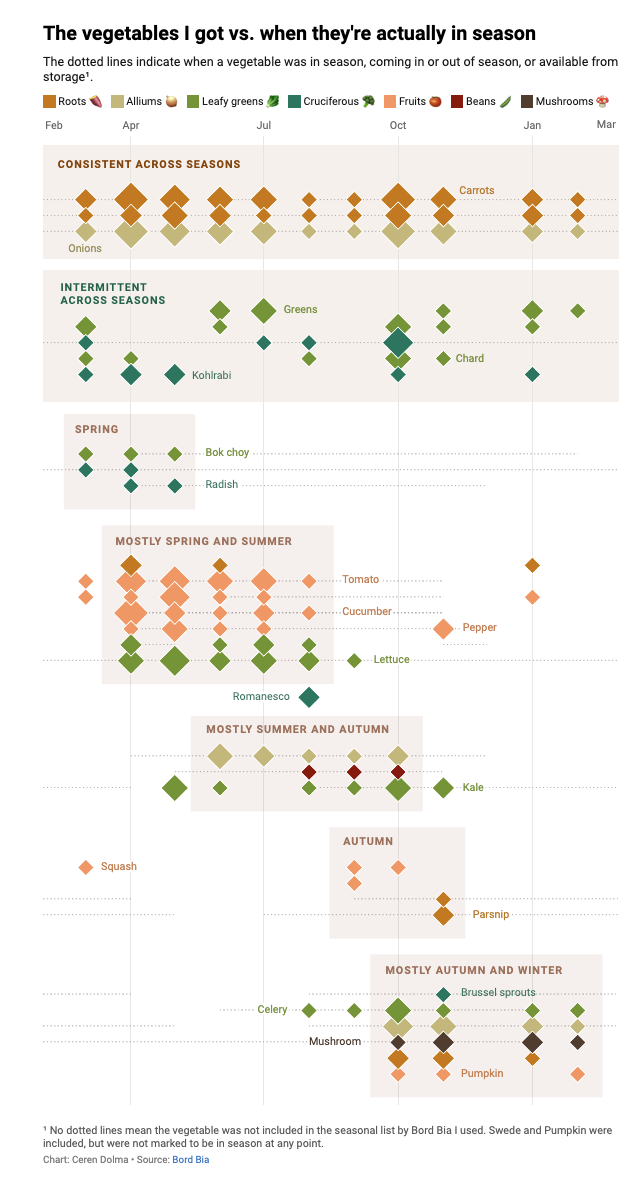
Radish to romanesco: A year in vegetables
Datawrapper's Ceren Dolma takes a look at vegetable subscriptions. When data meets allotment, yours truly is happy :)
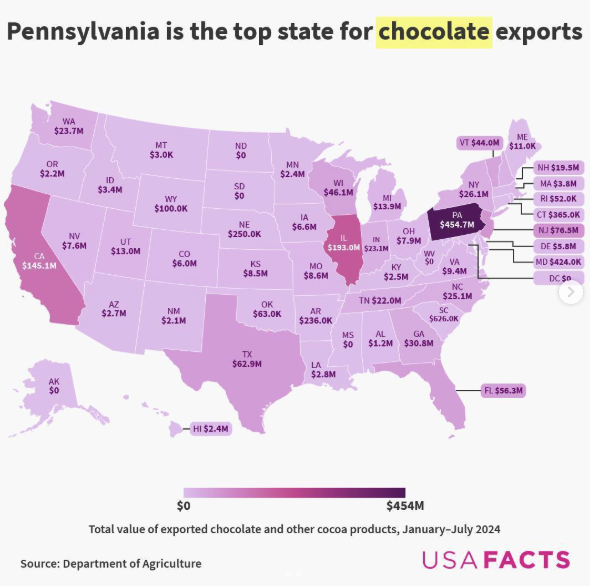
Pennsylvania is the top state for chocolate exports
This, by USAFacts, was unexpected. Apparently, this is down to a few famous confectioners based there (like Hershey's).
🤖 AI
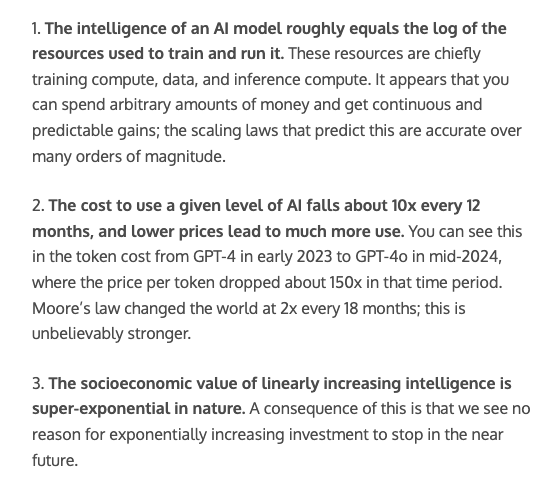
Three Observations
OpenAI founder Sam Altman: "If these three observations continue to hold true, the impacts on society will be significant." As others note, the message might be "and therefore, give my company some money", but the underlying discussion is interesting.
The Anthropic Economic Index
Anthropic: "In the coming years, AI systems will have a major impact on the ways people work. For that reason, we're launching the Anthropic Economic Index, an initiative aimed at understanding AI's effects on labor markets and the economy over time."
Everything Else
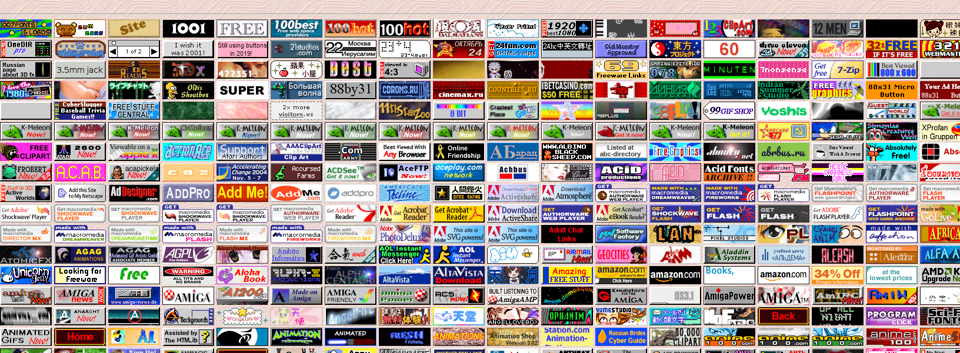
The 88x31 GIF Collection: Part 1
A collection of 4540 classic 88x31 buttons from the 1990s, 2000s, and today in GIF format. I try to update this page regularly. Feel free to copy buttons to your website, but avoid hot-linking if possible.
|
DID YOU LIKE THIS ISSUE>? → BUY ME A COFFEE! 
You're receiving this email because you subscribed to Quantum of Sollazzo, a weekly newsletter covering all things data, written by Giuseppe Sollazzo (@puntofisso). If you have a product or service to promote and want to support this newsletter, you can sponsor an issue. |
quantum of sollazzo is also supported by Andy Redwood’s proofreading – if you need high-quality copy editing or proofreading, check out Proof Red. Oh, and he also makes motion graphics animations about climate change.
