Things that caught my attention
This issue is going to sound a little US-centric but there you go. I found it very interesting to find that the US Census Bureau's Business Trends and Outlook Survey now asks firms about Super Intelligence, or SI, instead of Artificial Intelligence, or AI. This is based on President Trump's September Executive Order in which he famously started referring to Super Intelligence.
Now, I will leave the politics out of this, obviously. But one point to me is that I don't care about AI or SI because, as I've always said, "AI" is an imperfect and shifting label. Whenever I give talks, I remind people that I started university at a time where the phrase "artificial intelligence" referred to rules-based systems, or logic programming. Neural networks were a curiosity, which had become a bit more of a reality by the time I finished university in the mid 2000s. When I started my first job that had AI in its title in the NHS, artificial intelligence mostly referred to deep learning based techniques, and its powers were harvested most spectacularly for image recognition. The sub branch called Natural Language Processing was mostly focused on things like translation, where things were often far from usable. Now, the phrase AI refers mostly to large language models. So I'm not particularly precious about a label that keeps shifting, and if we want to call it superintelligence, or human-like intelligence, or whatever other definition may suit the current flavour of it, that is absolutely fine and, perhaps, more appropriate.
However, it is also true that definitions matter, especially when we're talking about a census or surveys or statistics. As Simon Willison laments in his blog post, that change of definition may cause an issue in how old surveys can be related to new surveys.
What label is best for you?
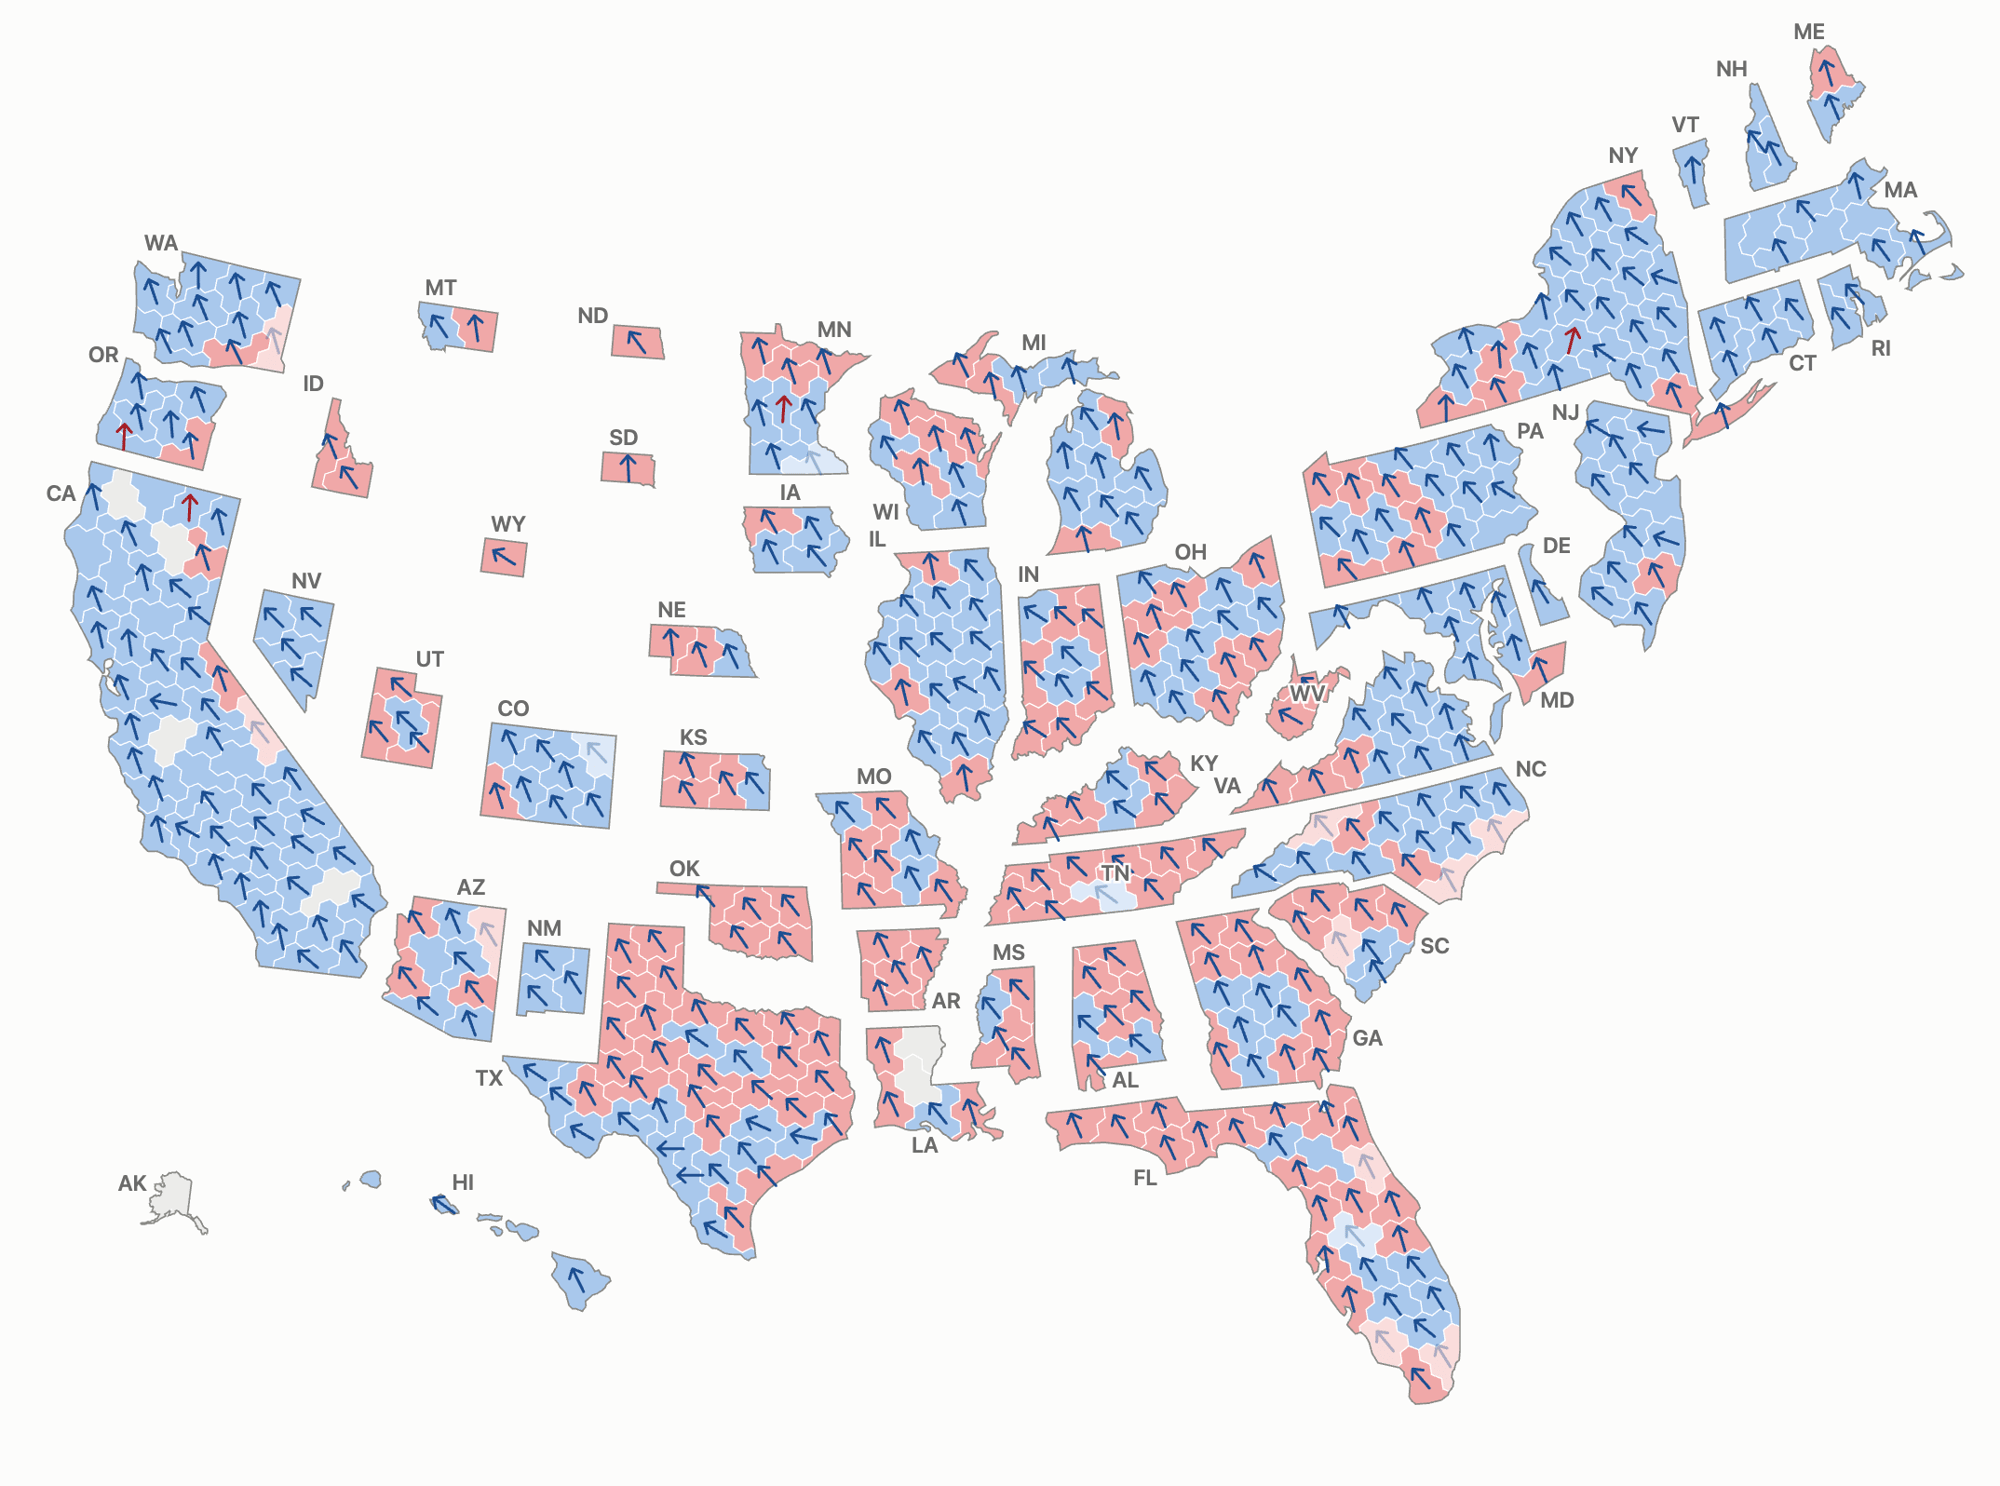
·I wanted to have a go at US Midterms electoral maps, and specifically at hooking together a hex map of seats, together with arrow maps of swing. I played a bit with Claude Code, and I think I've settled on this prototype (with source code available in Quantum's GitHub repository).
This was inspired by seeing the arrow map the BBC developed, which was based on a fully geographical map. As you may remember, I've played with Spikes Map before, for the same purpose.
The key question for you: does having arrows on top of a hex map work better than a geographical map? Does it add value and make the swing easier to understand and measure?
A note on swing: calculating it makes most sense only in 2-party situations, and where both parties were present across two elections with the same electoral boundaries. It loses its power the further you move from this setting. In the US context, it's broadly ok, but there are situations where Independents win. In specific cases, like Montana, there may have been controversy: in this case, the Independent candidate was actually supported by most of the Democratic party against their own candidate; so I opted to show the swing as if the candidate was a Dem.
An issue highlighting that data is not quite neutral, as much as you want it to be.
'till next week,
Giuseppe @puntofisso.bsky.social