Dataviz, Data Analysis, & Interactive
Steven Feldman's latest Claude mapping attempt aims to build an interactive Hiroshige-style map of all 119 woodblock prints from Wikipedia's "One Hundred Famous Views of Edo" table.

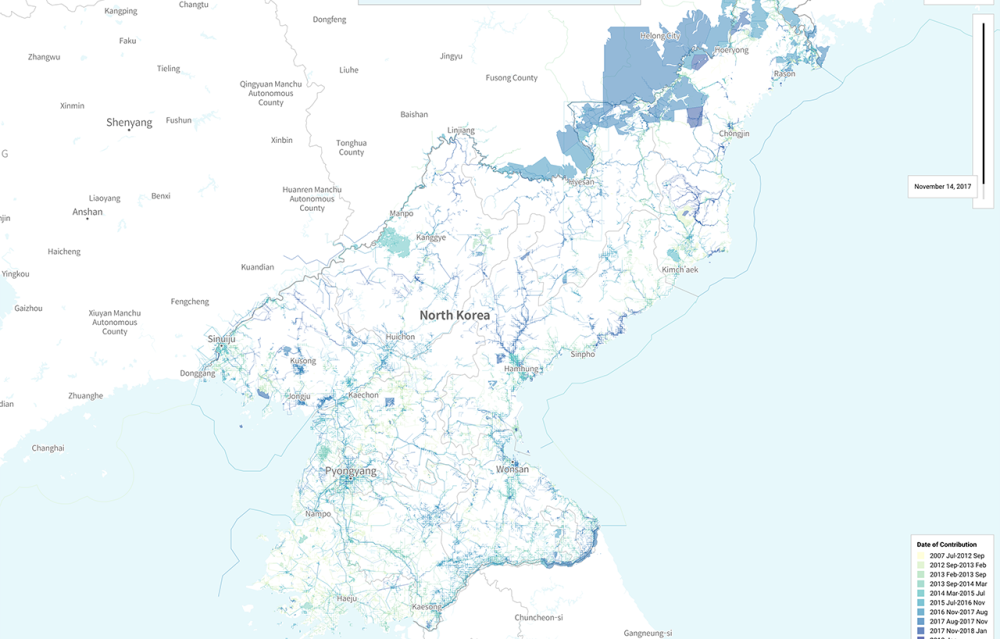
Walkably scores every street in 31 European countries from 0 to 100 based on walking access to eight daily needs. Beautiful, interactive map, too.
(via Durand D'souza)
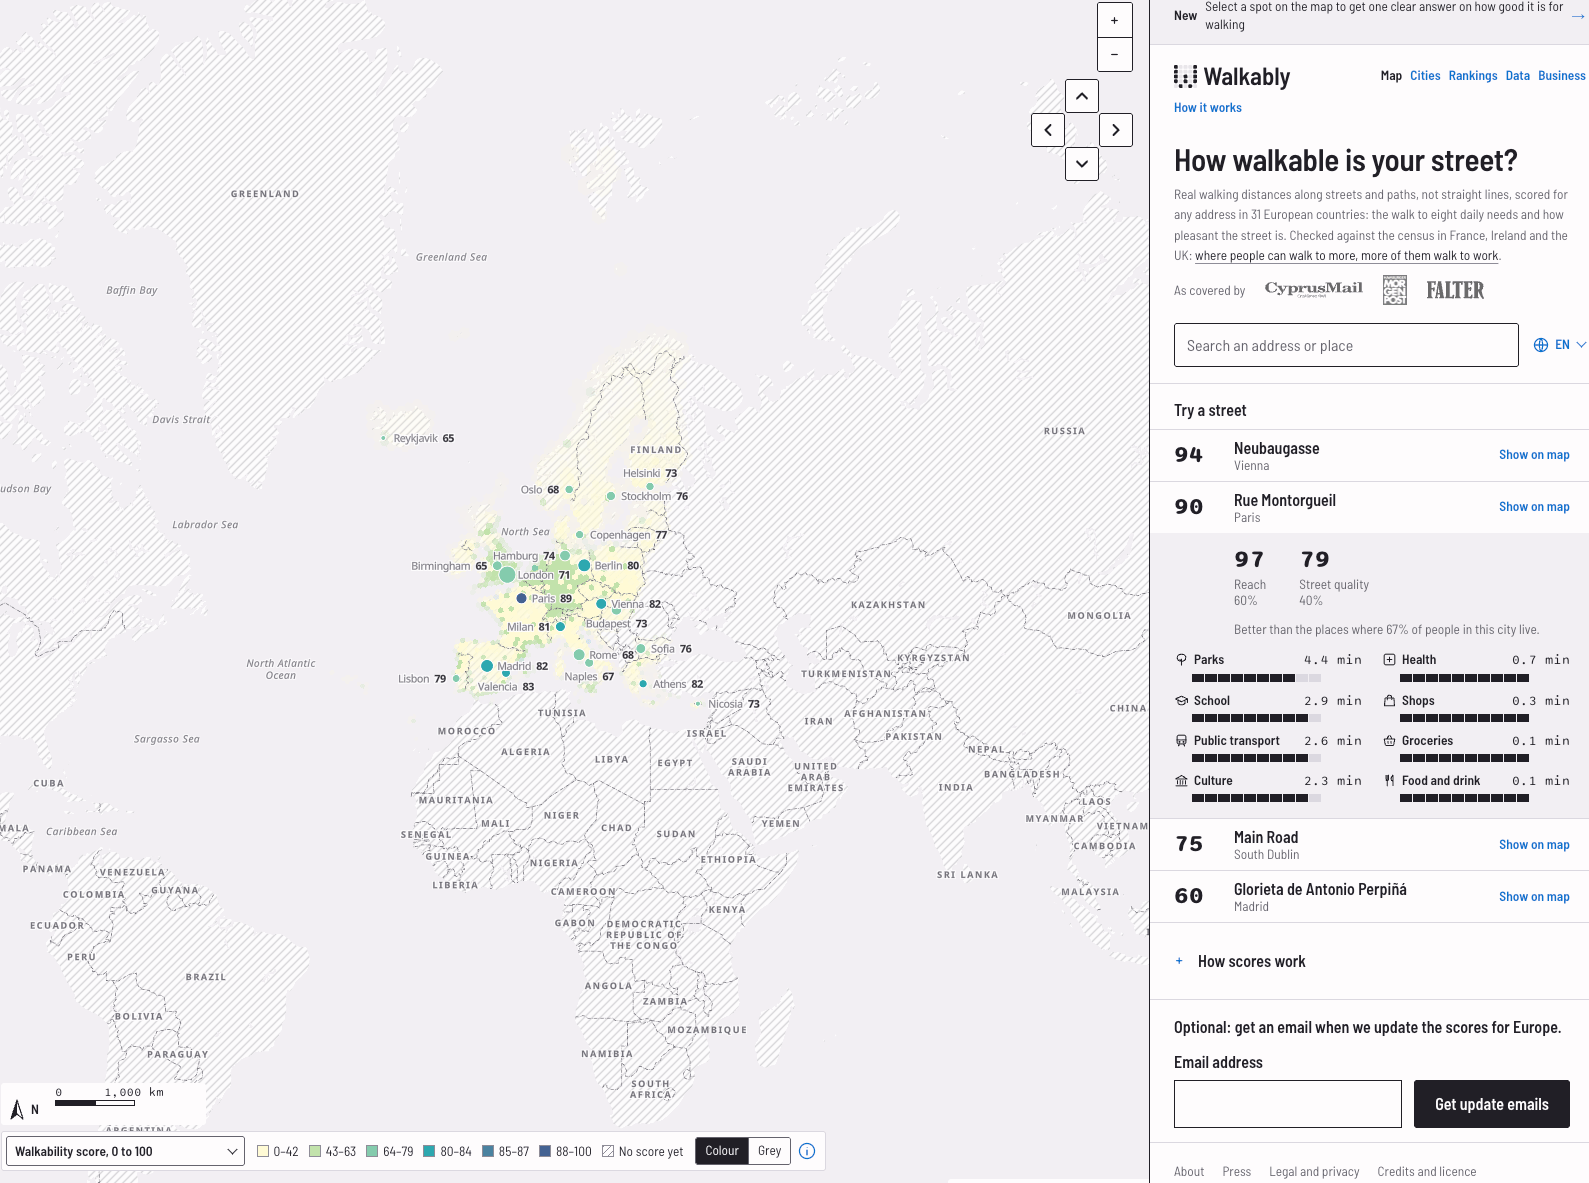
"An analysis of the OpenStreetMap data in North Korea: Who are the contributors? How and Why did they contribute to North Korea"
(via Geomob)
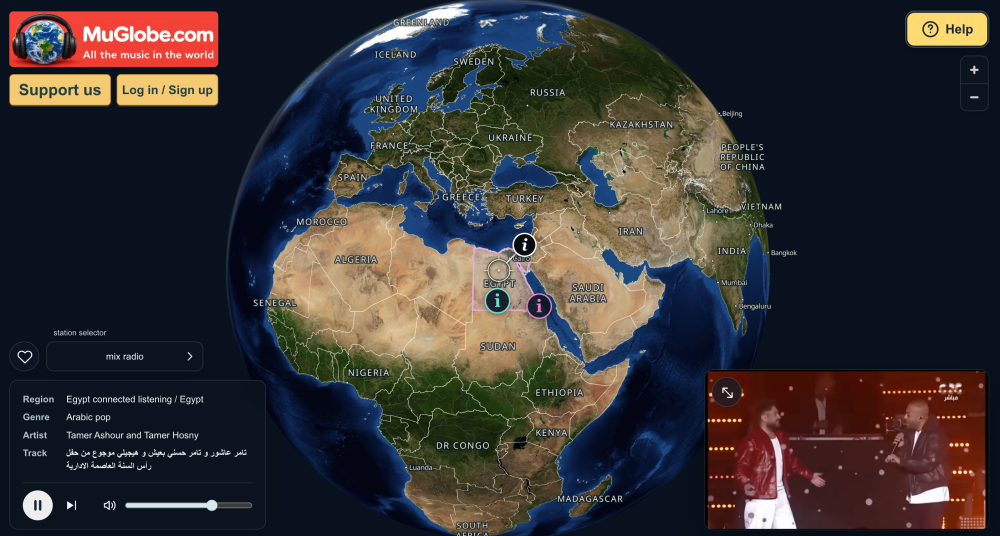
MuGlobe is a free interactive world music atlas combining NASA satellite imagery with Natural Earth geographic data, and linking to local YouTube recordings.
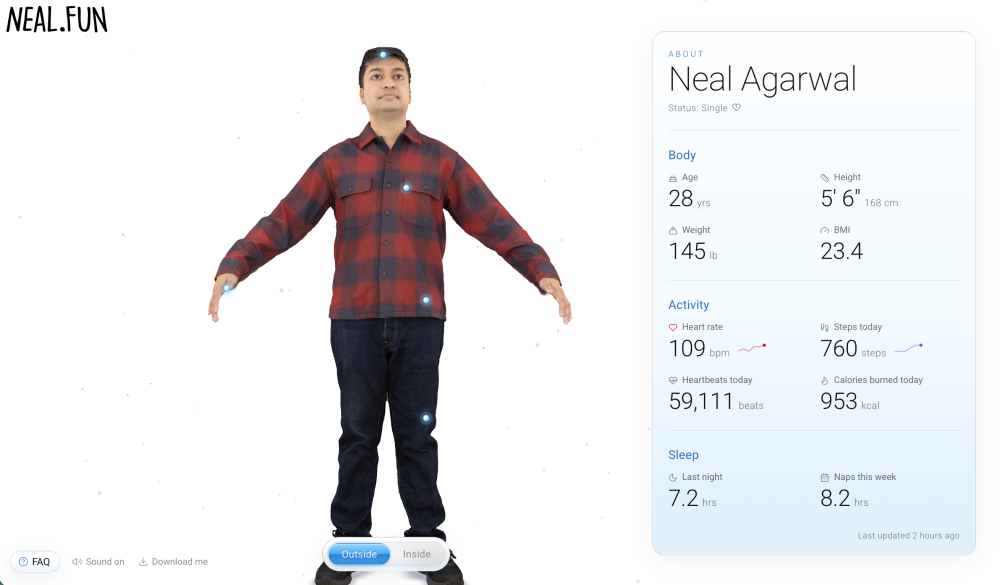
Wow. Neal has published an interactive 3D model of his body, external and internal, with personal stats like heart rate, steps, sleep, and calories, all pulled from his fitness watch and blood test.
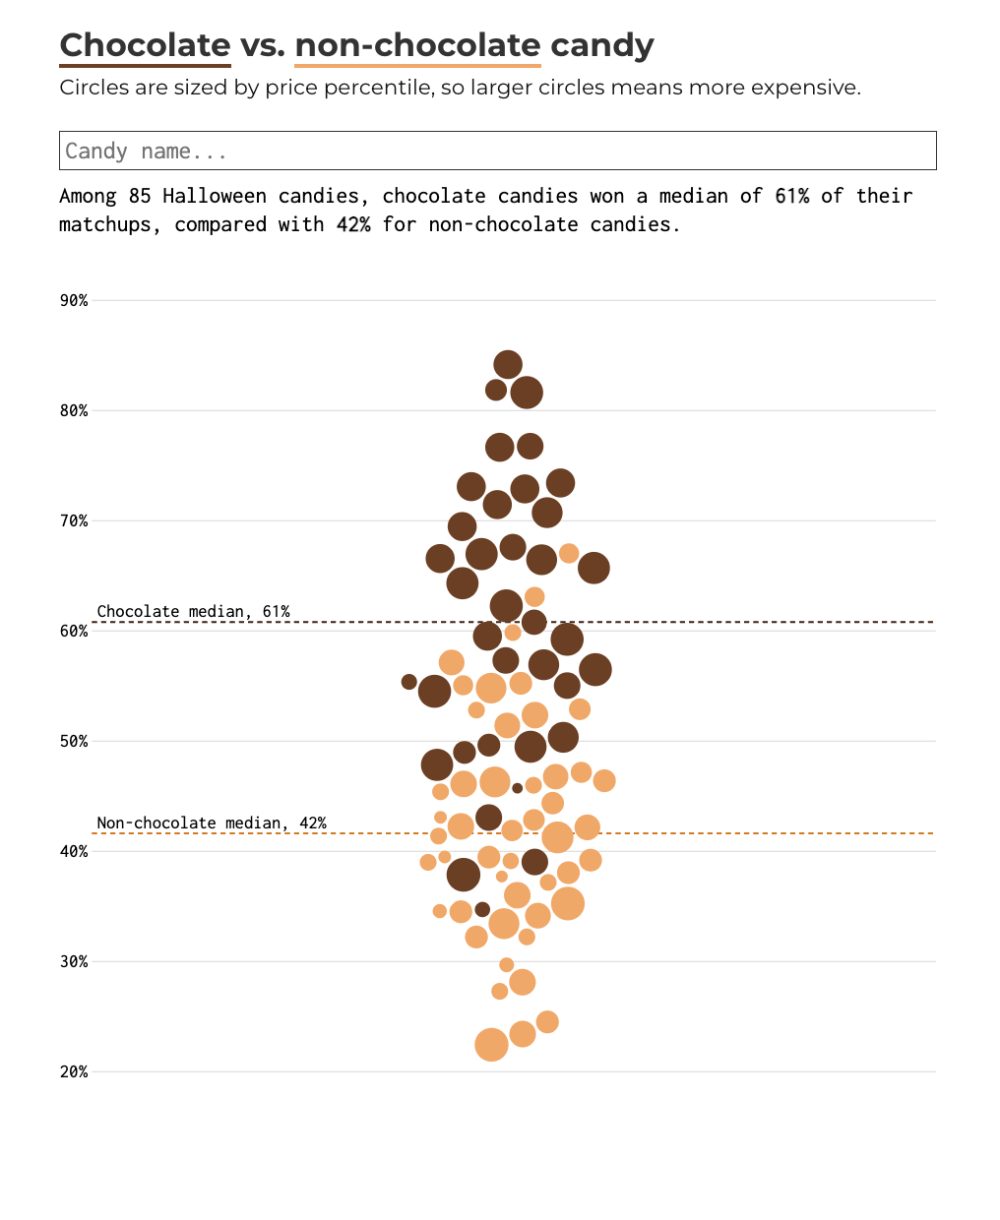
Nathan Yau (Flowingdata): "Some years ago, FiveThirtyEight placed candies head-to-head and calculated the win percentage of each. The site is closed, but some of the data lives on. Below are the results for chocolate and non-chocolate candies."
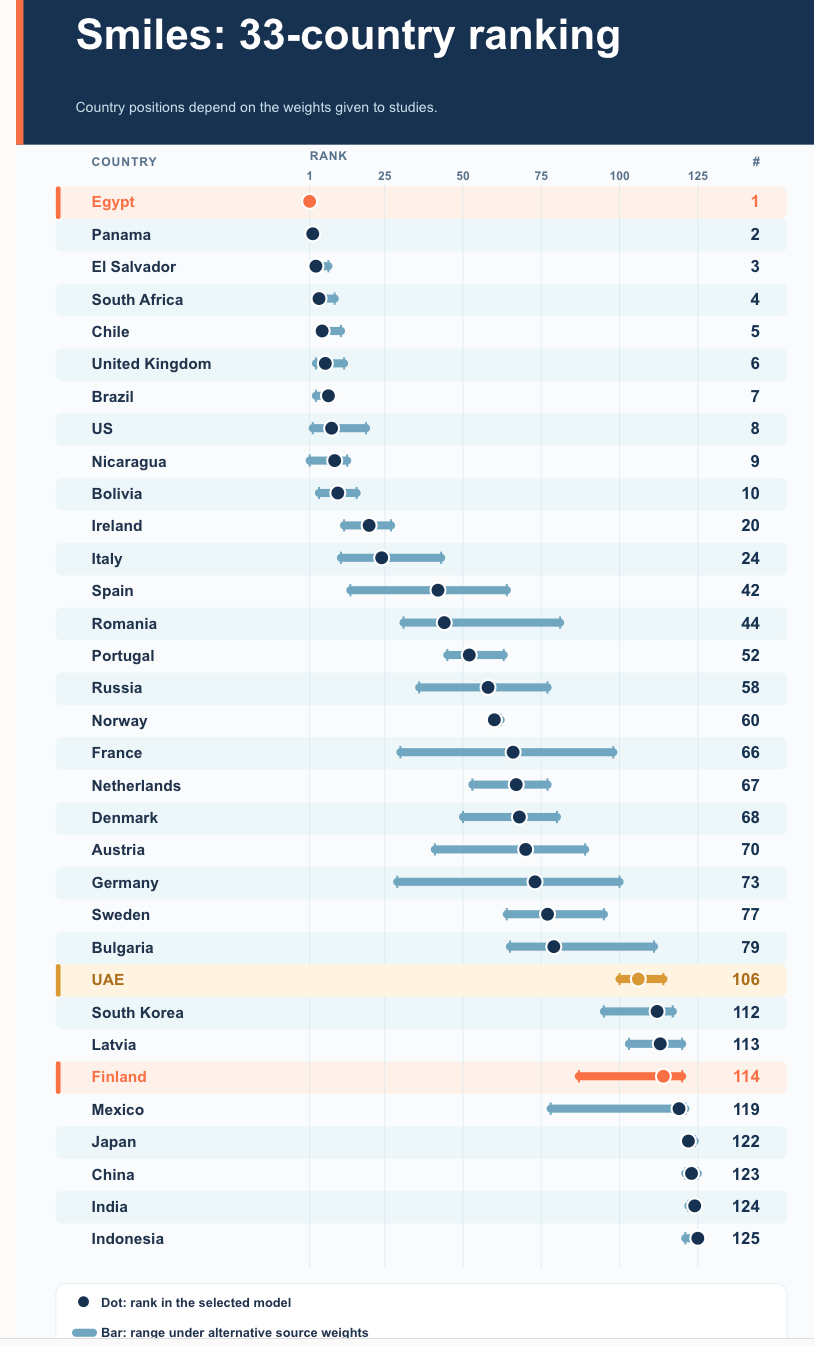
Interesting approach (maybe with some cultural bias involved...) on using video recordings to detect a country's level of happiness by analysing smiles.
Barcelona's Eixample blocks are mostly octagons (32%), Midtown Manhattan is "77% plain four-cornered blocks", etc.
(via Durand D'souza)
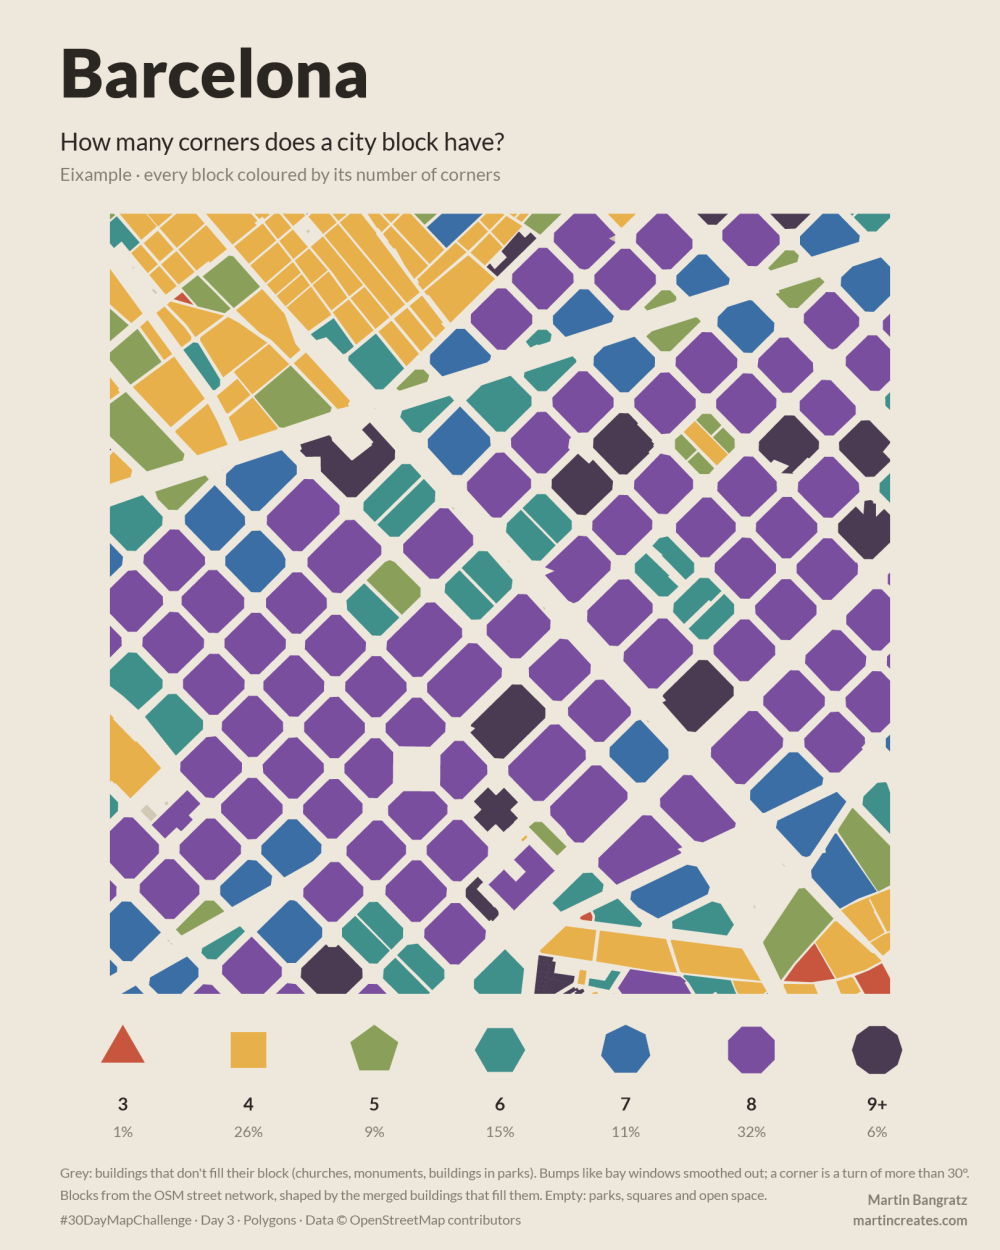
"This video examines the amount of location information carried by inaudible background sounds, using the Doppler effect to locate a reference recording within ~100m, and only needing (in some cases) less 1-min of audio. This video raises awareness of these capabilities and closes by discussing preventative measures one could take."
Basically, using a combo of publicly available aircraft data and Doppler curve spectrogram analysis, the authors show that you can pinpoint a video location to less than 100m distance.
In simple terms: showing an audio file on a spectrogram you can "see" inaudible frequencies left by aircrafts flying over the location of the recording, and cross-referencing these with ADS-B data about aircraft you can find their GPS coordinates. Fascinating, and clever.
(via Durand D'souza)
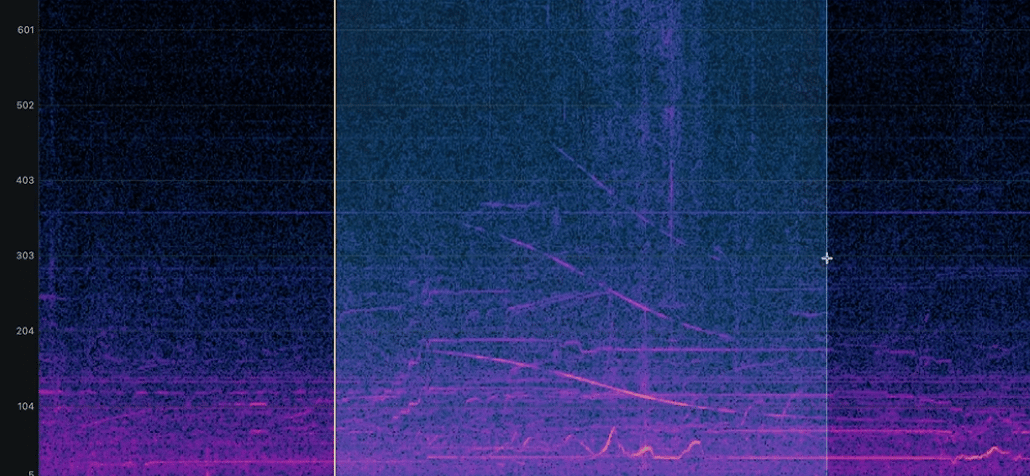
Lisa Hornung delivers on day 1 of this year's #30DayMapChallenge, by mapping German supermarkets in London, showing Lidl has almost double Aldi's shop count.
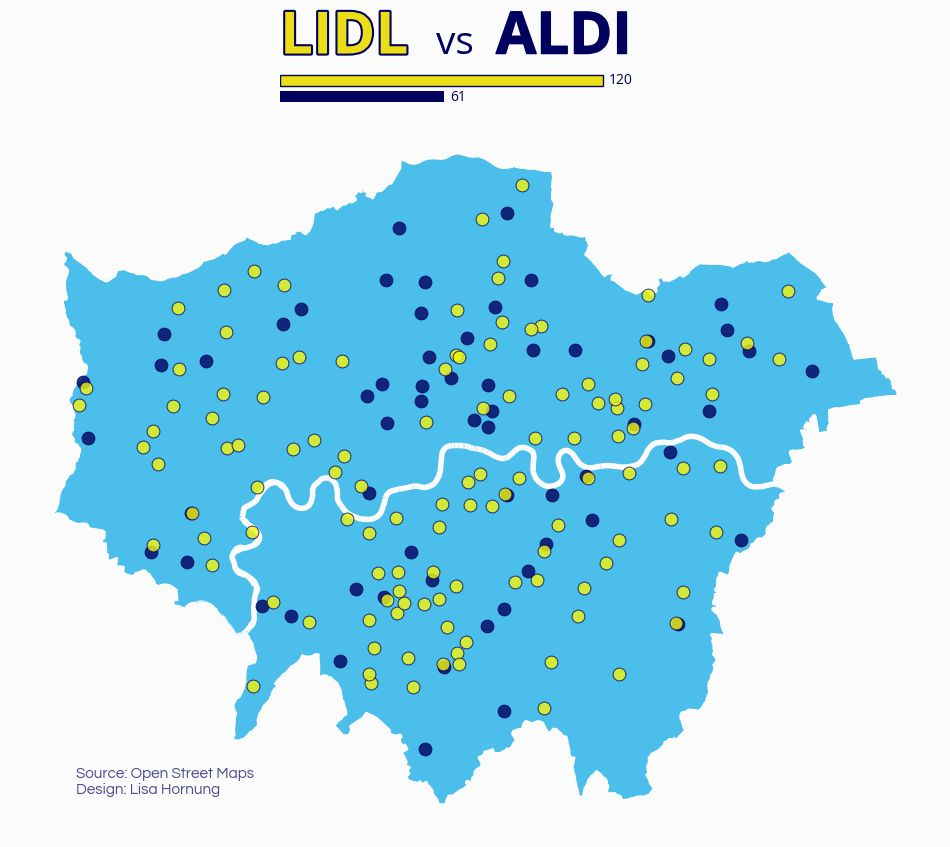
104 software job titles maped from the 1940s "Computer" to 2025's "AI Agent / Context Engineer" using Graphviz. Top findings: titles often split then rejoin (e.g. webmaster divided into web developer, sysadmin and editor before front-end/back-end reunited as "full-stack"). Many "new" roles recycle old ones, like today's "forward deployed engineer" basically being IBM's 1960s pre-sales "systems engineer".
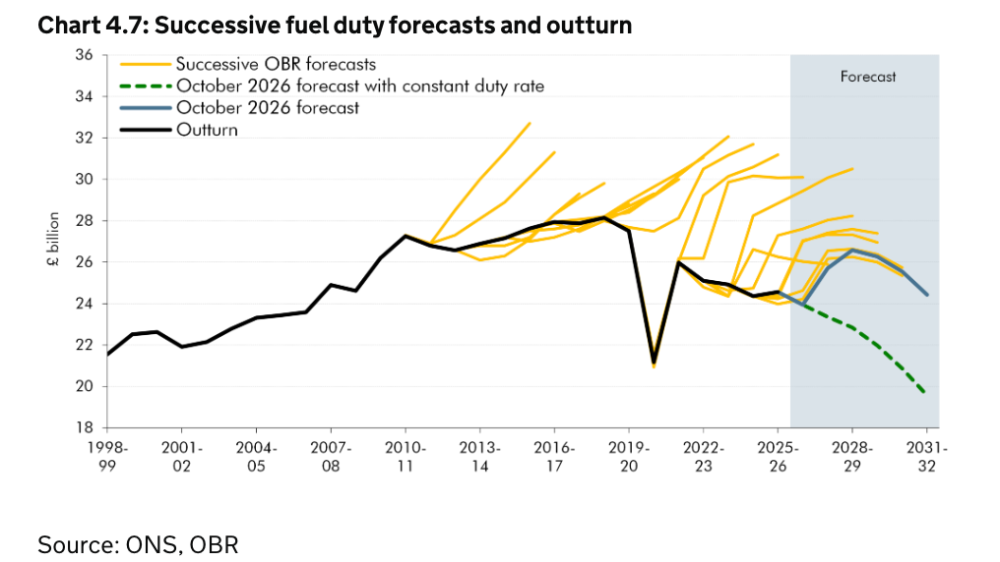
Rising energy prices and interest rates are pushing CPI inflation up. But I link to this predominantly for the chart below, a dataviz style to capture multiple OBR forecasts over time versus the real outturn that reader Peter Wood refers to as "Hedgehog Plot".
(via Peter Wood)
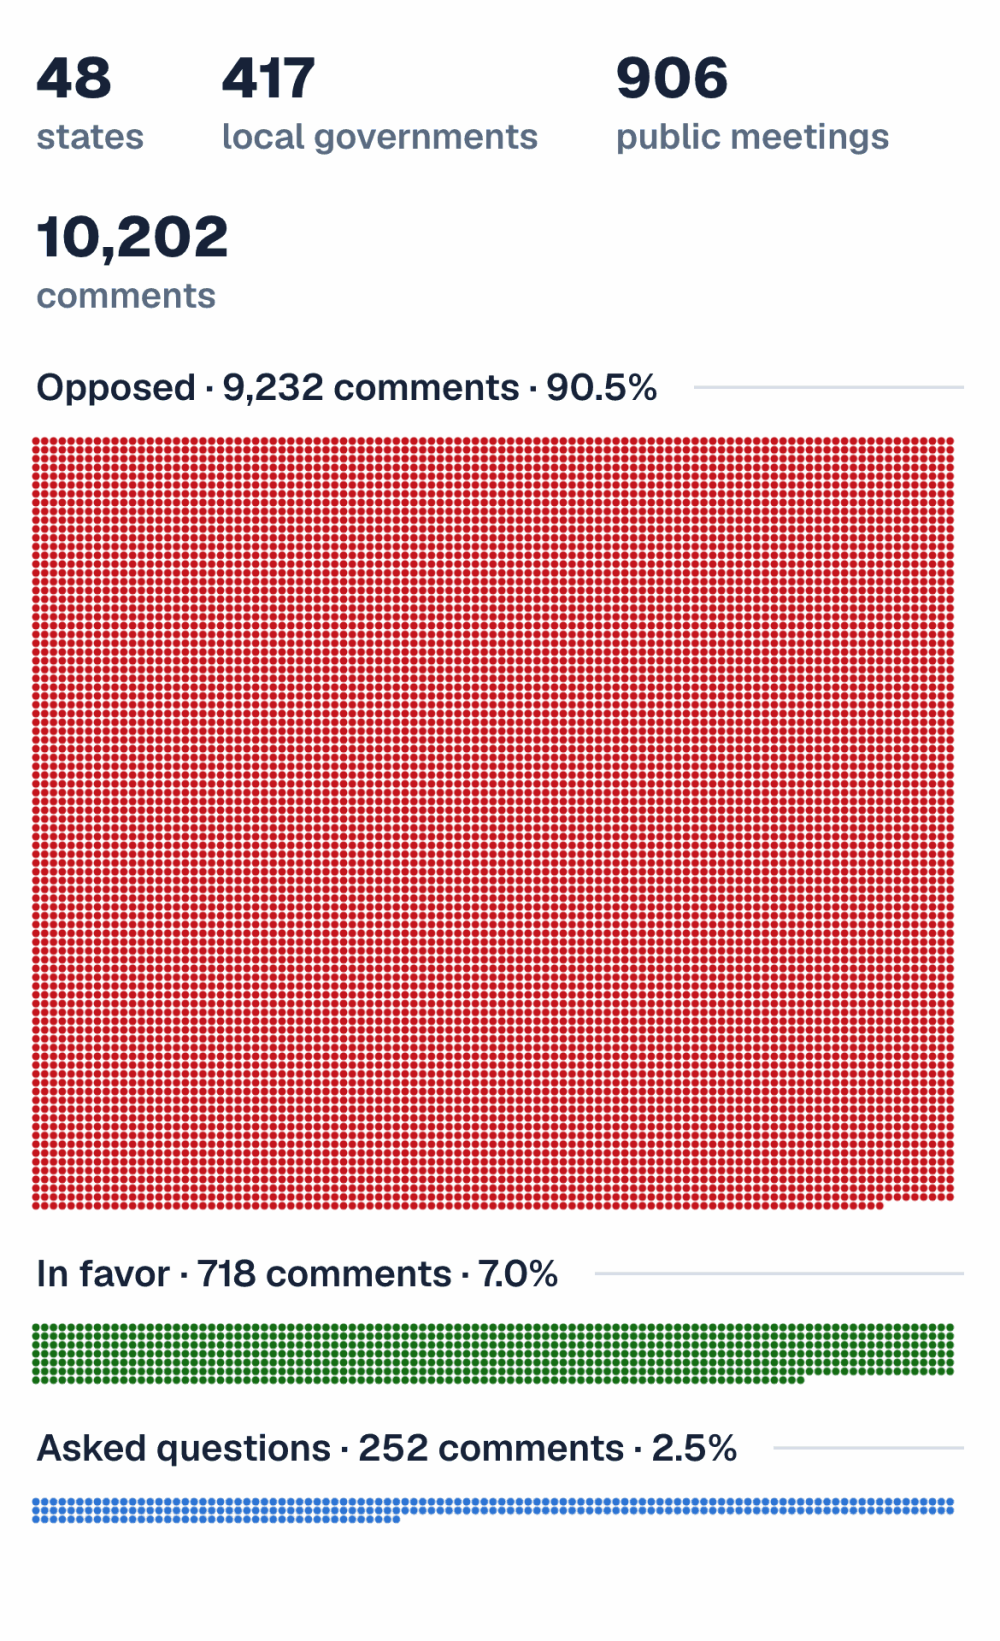
American Sentiment has been researching opposition to data centres in the US by running an analysis of 10,202 public comments at 417 local governments, showing that 73% of meetings had zero data center supporters.
We'll keep an eye on these folks at American Sentiment, because their dataviz approach is outstandingly good.
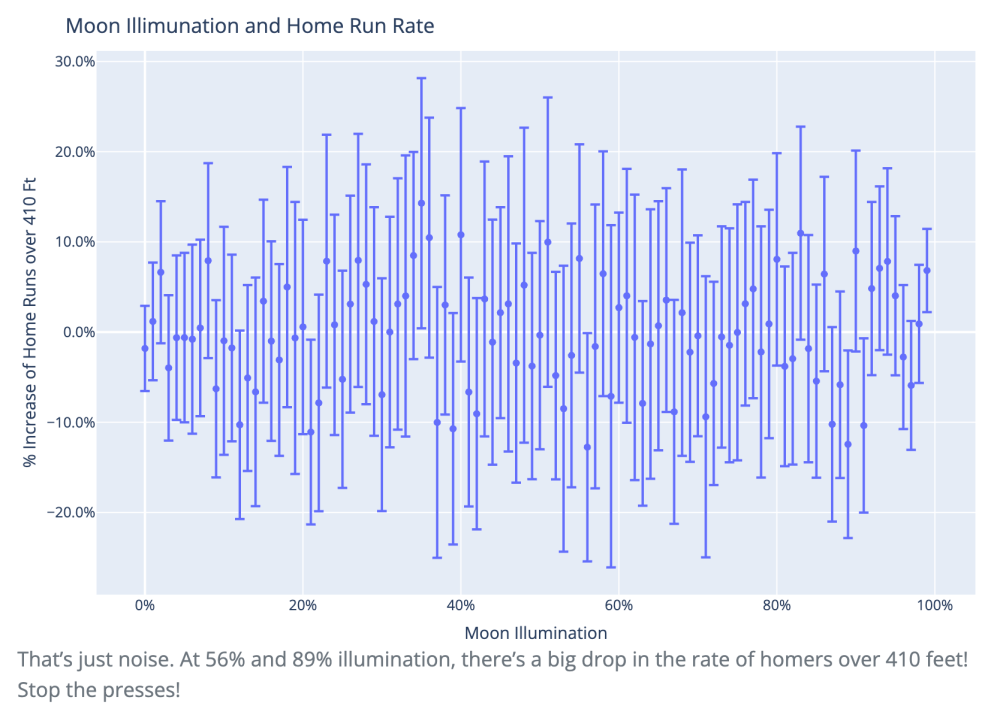
Marcos Huerta: "Google ran a “Gemini with Google Cloud” commercial during the World Series that made 3 dubious claims about stats changing during the full moon. All are examples of small number statistics with large error bars, and analyzing more than one year of data (I used 1900-2025) shows any effect of the full moon to be spurious."
I had no idea about this full moon thing...
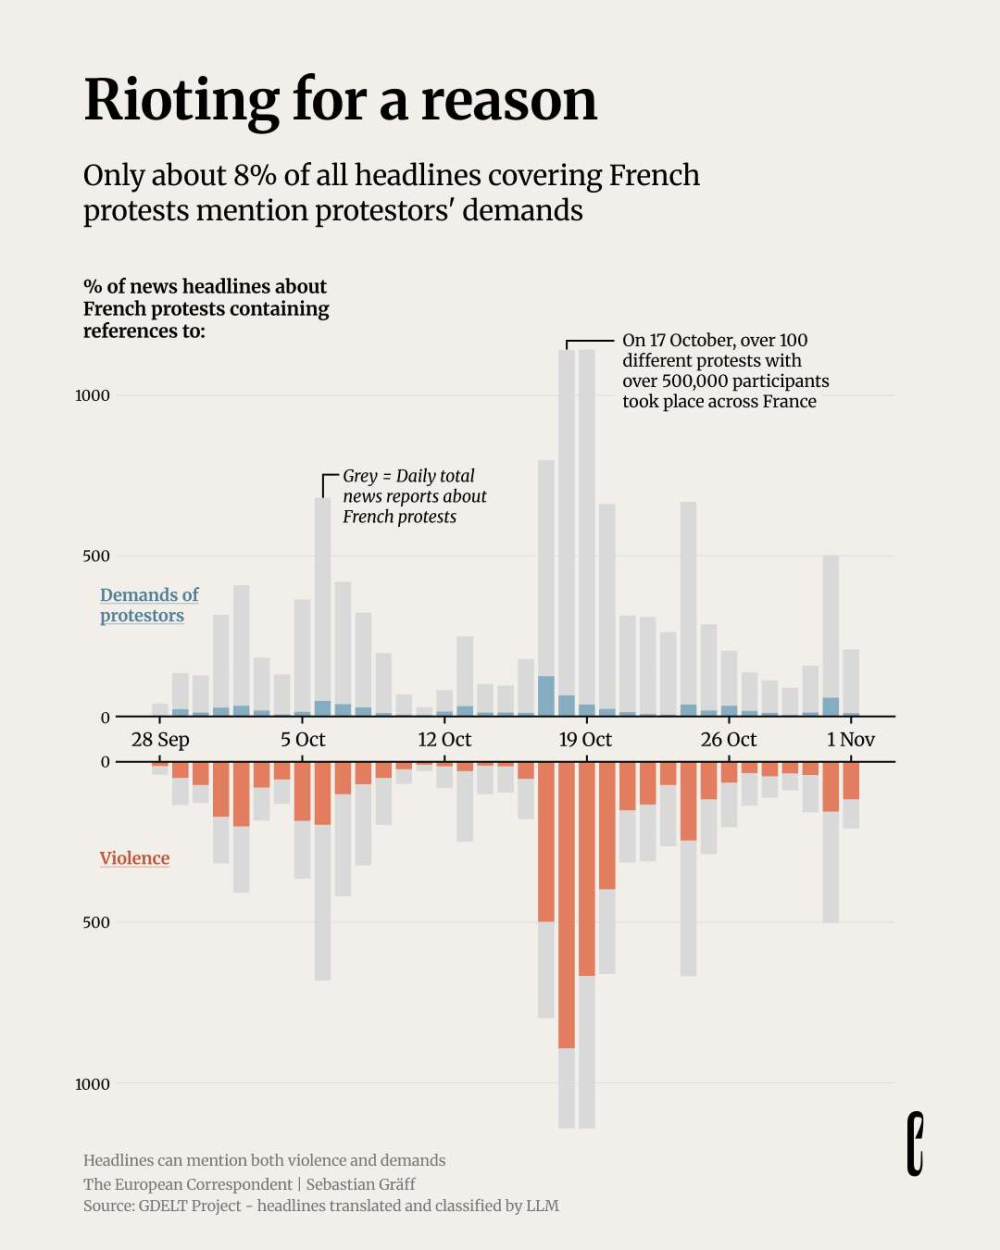
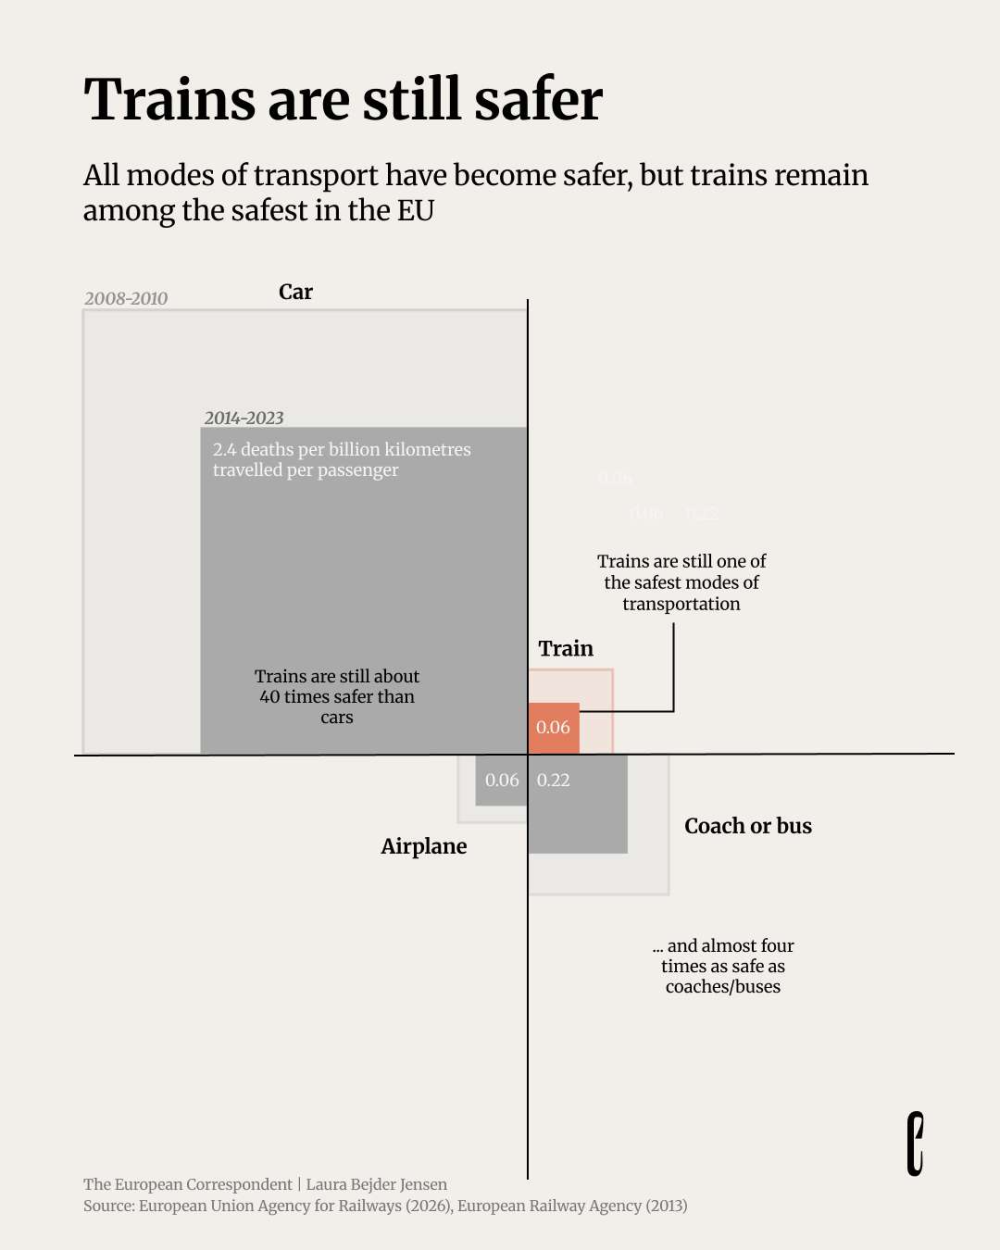
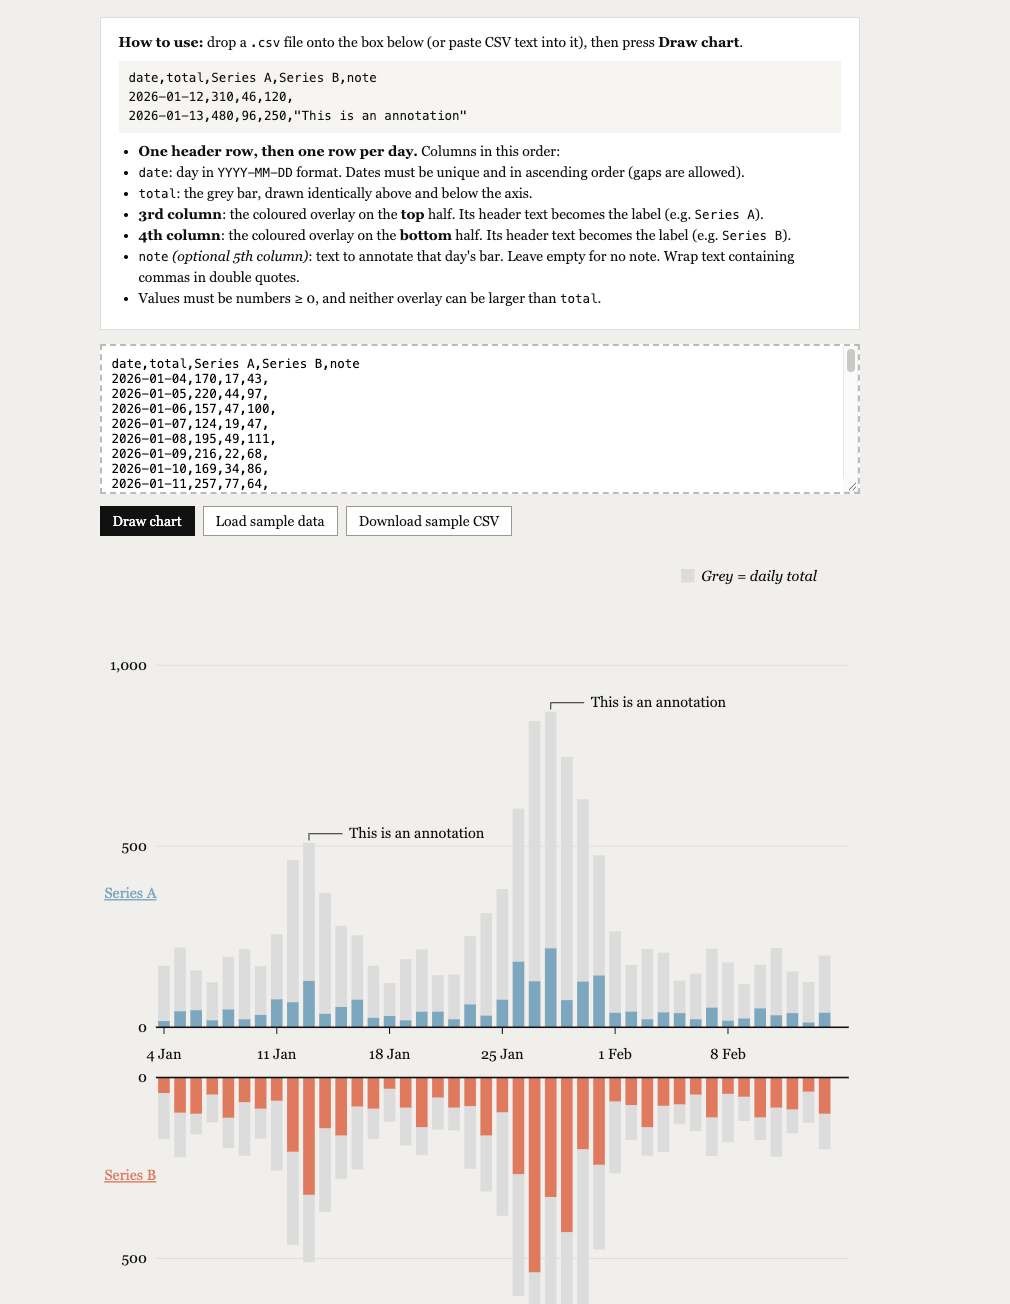
The European Corresponded suggests that only a minority "of over 10,000 European headlines about French protests mentioned protestors' demands". What I find very interesting is the brilliant choice of chart style: a mirrored bar chart, with the same values top and bottom, and with two different variables highlighted on either side.
I liked the chart very much, so you find a self-contained html file to generate your own in the Tools section.