GoFish Updates: April 11-17
Hello! For those of you who subscribed from the PyData talk, welcome the mailing list. After a brief rest for spring break, I’m back with some updates on GoFish this week.
We’re currently working on achieving parity with the Vega-Lite example gallery as well as working on quality-of-life features for nice-looking charts like labels.
For example, we shipped a labeling API that automatically colors the label based on the mark’s background color!
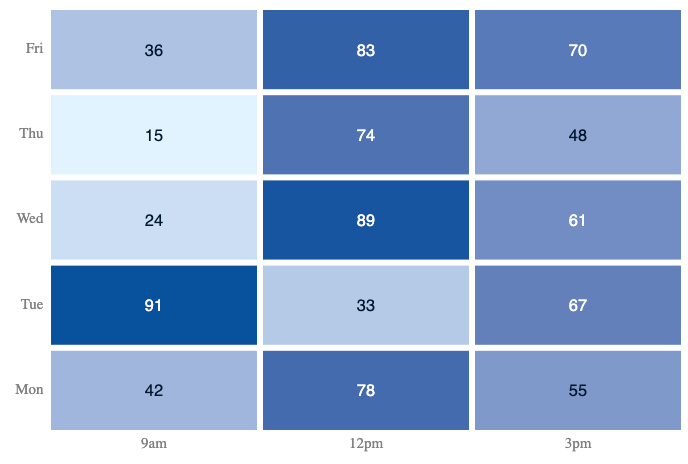
Here’s the code for that:
Chart(heatData, { color: gradient(["#e0f3ff", "#08519c"]) })
      .flow(table("hour", "day", { spacing: 4 }))
      .mark(
        rect({ fill: "value" }).label("value", { position: "center", fontSize: 11 })
      )
      .render(container, { w: args.w, h: args.h, axes: true });
The label modifier can be attached to any mark!
We also added some other examples. Here’s a strip plot:
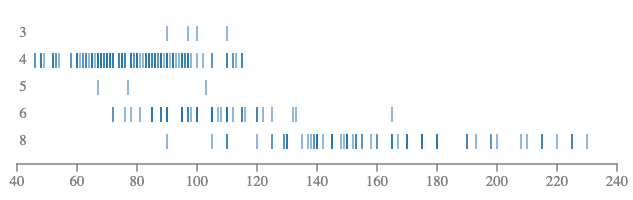
In Vega-Lite, this uses a special tick mark. In GoFish, we can just compose our common operators and marks to do it:
Chart(cars)
      .flow(
        derive((d) => [...d].sort((a, b) => b.cylinders - a.cylinders)),
        spread("cylinders", { dir: "y" }),
        scatter({ x: "horsepower" })
      )
      .mark(
        rect({
          w: 1,
          h: 10,
          fill: "rgb(31, 119, 180)",
          opacity: 0.7,
        })
      )
      .render(container, { w: args.w, h: args.h, axes: true });
Support for these features were added by my wonderful undergrads, Milin and Ace, respectively.
Cheers!
-jopo
Highlights (Auto-Generated From PR/Commit History)
A productive week for GoFish — 16 PRs landed! The big themes were shoring up core rendering correctness (circles are actually circles now, colors actually color), leveling up the labeling system, and overhauling snapshot infrastructure so CI handles baselines automatically.
What changed
Rendering & Marks
Circles now use a proper
Ellipseshape instead of faking it with rounded rects (PR #343), andaspectRatiosupport was added toRect(PR #341)Fixed scatterplot color encoding —
fill/strokefield lookup was checking the array instead of individual datums (PR #347)Added z-order support for layered rendering (PR #336) and rect opacity for strip plots (PR #361)
Color encoding for stroke styles in
rect(PR #337)
Labels & Color
New
.label()API on mark nodes for data-driven text labels (PR #338)Auto label coloring now uses HSLuv luminance for better readability on varied backgrounds (PR #358)
Layout & Operators
Constraint system (
alignanddistribute) added toLayer(PR #245)Histogram story plus improvements to
bin/stack/scatteroperators (PR #271)
Infra & Cleanup
Snapshots moved to orphan branches with Git LFS (PR #356) and auto-updated on every main push (PR #357)
Claude Code GitHub workflow added (PR #353);
scaffoldrenamed toblank(PR #346);experimental.tsdeleted (PR #351)
Examples
Contributor shout-outs
cemeterysummoning — Added stroke color encoding for scatter outlines in PR #337 and contributed several Vega-Lite strip/scatter examples
joshpoll — Drove the bulk of the week's work across rendering fixes, infra overhauls, and operator improvements, including the strip plot + opacity fix in PR #361
milintun — Shipped the new
.label()API for data-driven mark labels in PR #338 🎉