Philosophy and Methodology of Experiments

Sometimes you have to do an experiment. This is rote, manual work that is chiefly concerned with data collection. I'm mostly talking about performance testing here but the general technique applies to any kind of thing like this.
This is the sort of thing that people who are trained in the real sciences (i.e. not "computer science") learn how to do in school but as a programmer you will have to pick up on the job.
This is a methodology of experiments that I have built up as someone who is easily distracted, has no formal training in science, and often has need to do performance testing. If that also describes you then you might find it useful. It's presented as authoritative but you should of course take the parts of it you find useful and discard the rest.
This is primarily about data collection and experiment hygiene. I have some mild opinions on other matters but not to the same level of detail.
Why Run an Experiment
Generally you experiment on your software because you have some question that needs to be answered. "What is the optimal level of concurrency in this stage," "how big should my buffer be," "what is the relationship between the value of this Kafka configuration parameter and my throughput?"
Sometimes this question will be of the form "what's the best choice," and other times it will be "how are these things related?" Running experiments is a good way to answer both of these kinds of questions.
How to Run an Experiment
The golden rule of experiment hygiene is that data collection and data analysis are separate activities. This is obvious, of course, but some nonobvious consequences follow.
One important thing to understand is the data model of experiments. An experiment is composed of several runs. The artifact of an experiment is the results of those runs.
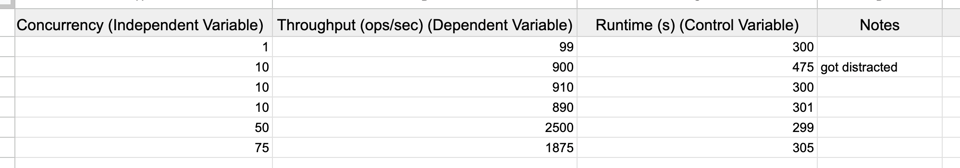
The correct way to represent this data is a spreadsheet that looks like the following:
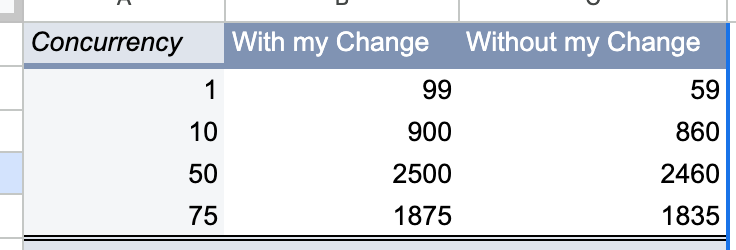
Here is where we get philosophical. Runs are creating information. They are a record of what happened in the world when you ran that experiment. This also sounds obvious but when I first started having to do this sort of thing I would create spreadsheets like this:
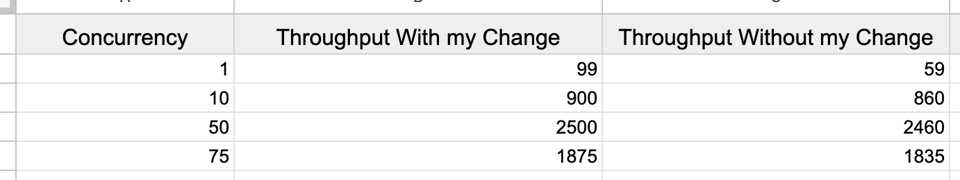
What's wrong with this? Well, first of all, the structure of the spreadsheet suggests that there is exactly one result for "concurrency=1, with my change," when that's not true. You're not "discovering the truth" when you run an experiment, you're doing things, and writing down what happened when you did them. There is a subtle but important difference. This is a log of actual things that happened in the real world, not a list of discoveries.
The second is that we are putting data from multiple runs in a single row of our spreadsheet. This is coupling data collection and data analysis and breaking the golden rule: it's suggesting there is some reason that these two runs in particular deserve to be juxtaposed. It's easy to trick yourself into doing this because you believe that your job is to compare the two versions of the software. That is your job eventually but not right now. Remember: the artifact of our experimentation is a set of runs. Producing any kind of analysis is a separate activity that you are not engaging in at the moment.
For an experiment like this, your spreadsheet should look something like this:
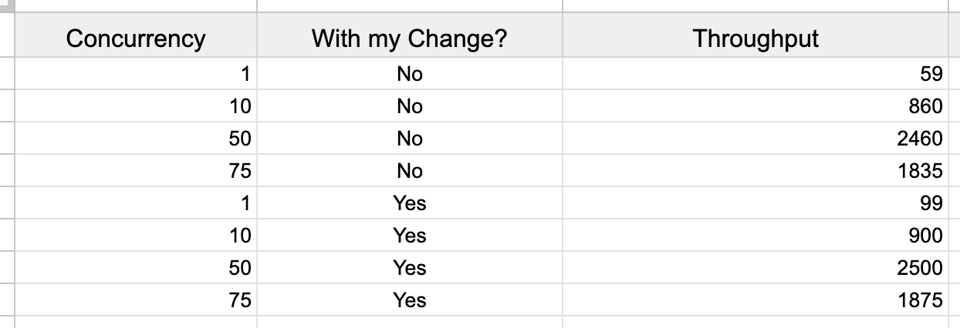
A consequence of this structure is that it's easy to collect additional data. If you need to vary another variable, you can introduce a new column that controls that variable, and add extra rows that change it. If you need to actually do several runs per configuration, you can add extra rows. Tracking a new run is an append only operation.
In practice, you will often have tools that will run a benchmark for you and spit out the results of the runs. I think it's best to view those tools as automating this process which you could have done yourself, manually changing the parameters in between each run. Of course it's generally better if those things can be automated but the nature of many kinds of experimentation is that they are not particularly easy to automate in that way. For example, if a run involves tinkering with a configuration value, deploying your software to staging, and then reading a number off of a graph, it's probably not going to be practical to automate that to run on your local machine (at least for a bespoke, non-recurring experiment). You need to be able to do the mechanical parts yourself.
Analyzing the Data With Pivot Tables
There are two main tools I use to look at this data once I'm done collecting it: pivot tables and graphs.
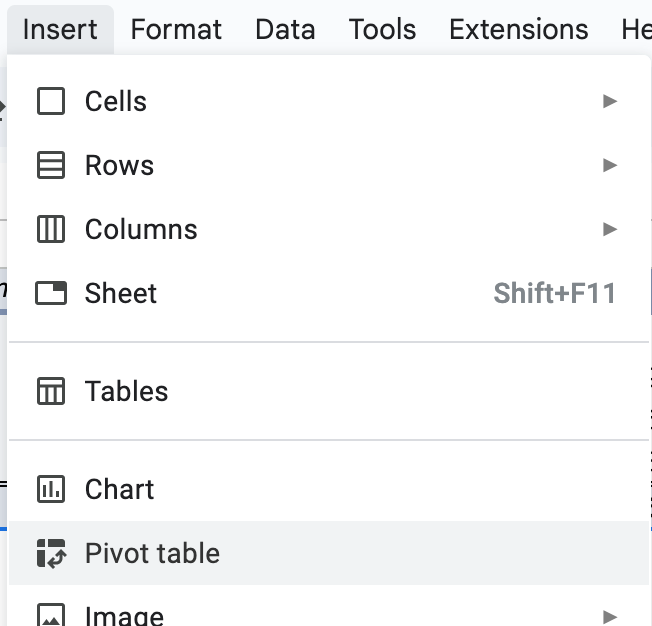
In Google Sheets, you can create a pivot table like this:
Then you give it the data you want to analyze, configure some stuff, and you can slice and dice your experimental data however you like:
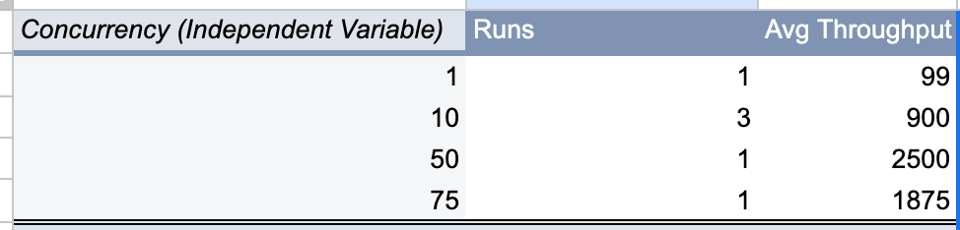
In this example I made the rows "concurrency," and the "values" Runs and Throughput (and configured how I wanted them aggregated).
This is how you turn "append-only tracking of runs" into "data readable by a human:"
Now we have the view of the data we wanted before, but it's derived from a much more solid underlying data model.
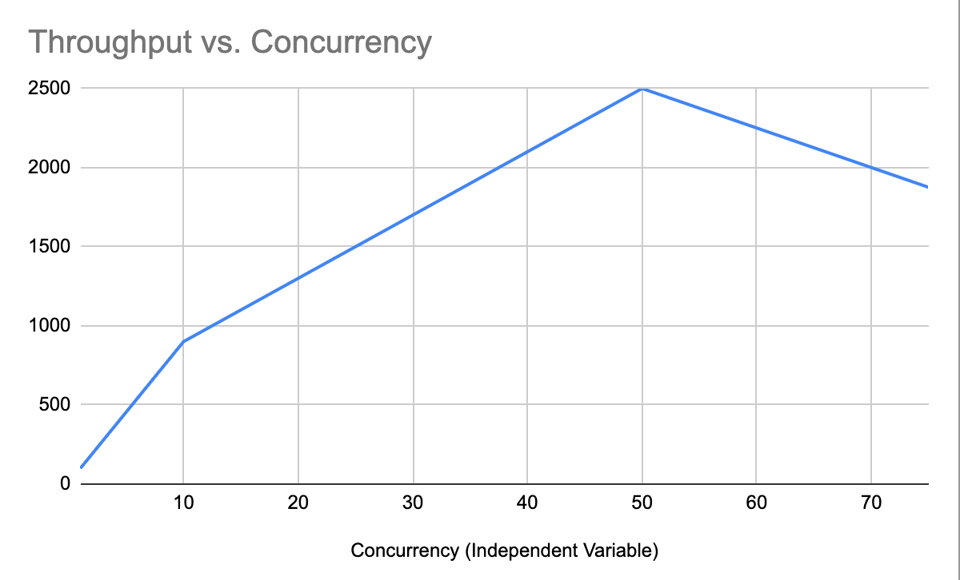
Analyzing the Data with Graphs
I'm not in a position to talk about data visualization because I know people much smarter than me have much stronger opinions. But this is the other main way to look at your data:
You should know how to whip these up and there are lots of ways to do so. Google Sheets is easy, ChatGPT can give you pyplot that you can run in Jupyter.
Automation
Another nice property of this model is that you can automate it really easily. You don't need to like, build up any kind of data structure in memory to track the results, you just have a function that does a run and spits a csv to stdout. I do this a lot (and then I generally use pyplot to plot them, but you can just as easily import them into Google sheets as well). This fits really nicely with the relational model and you can use your favourite database (I like DuckDB) to analyze the data locally.
Programming Note: Next week we are discussing chapters three and four of Feedback Control for Computing Systems: Introducing Control Theory to Enterprise Programmers. Email me your takes at first dot last at gmail.com, or share them in the NULL BITMAP Discord.
Add a comment: