Diagrams For Yourself

I have a large need of diagrams. In particular when I'm writing something longer about a query planning topic I often would like some kind of standardized way to generate diagrams of query plans.
I've tried using Mermaid and graphviz but they leave a little something to be desired, here's an example of a Mermaid implementation of a simple join tree:
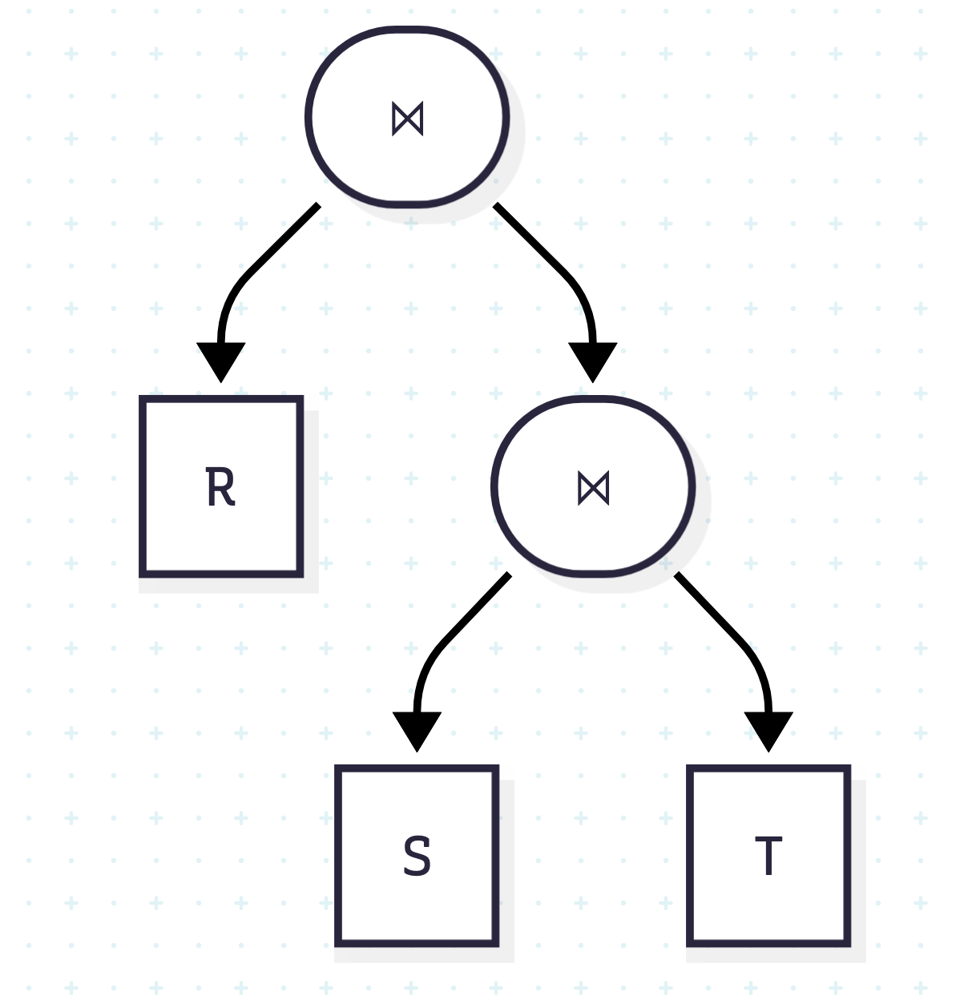
I usually want something a little more TikZ-y, but a little more playful and ideally without the hubbub of actually using TikZ. Closer to this but a little friendlier:
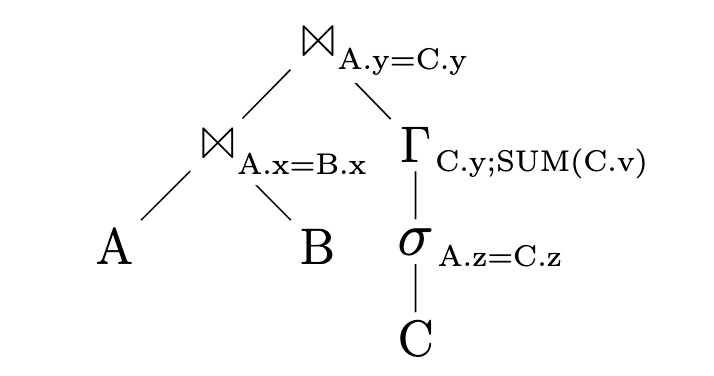
I also just don't want to use something off-the-shelf like Mermaid or TikZ because I think having something homemade with a slightly distinctive style is important. If you're looking at a diagram of mine, I don't want it to be clear you're looking at a Mermaid diagram, or a TikZ diagram, or something. I want it to look bespoke. This is part of the upsides of working with computers, right? You get to make your own tools that work how you want and look how you want and look like you made them and work like you made them.
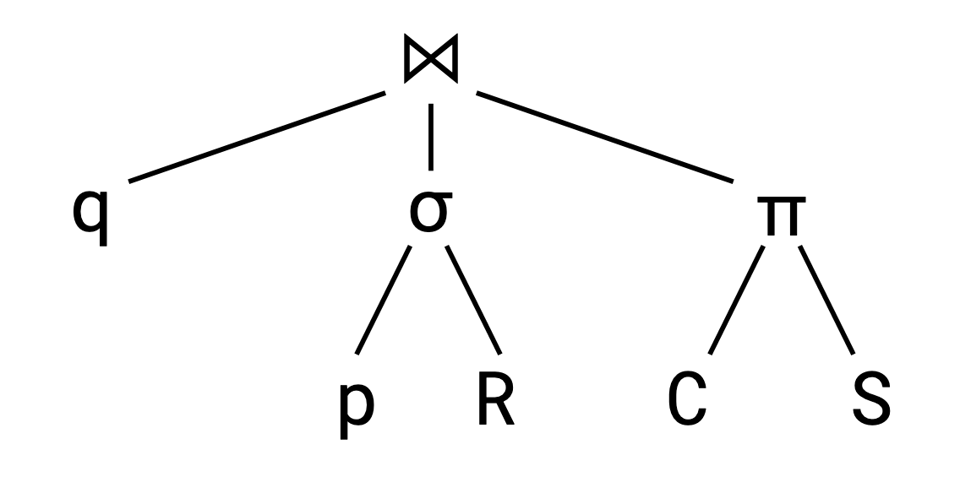
I don't have such a tool at the moment though, usually I wind up just drawing something by hand in Google drawings which often look a little crummy:
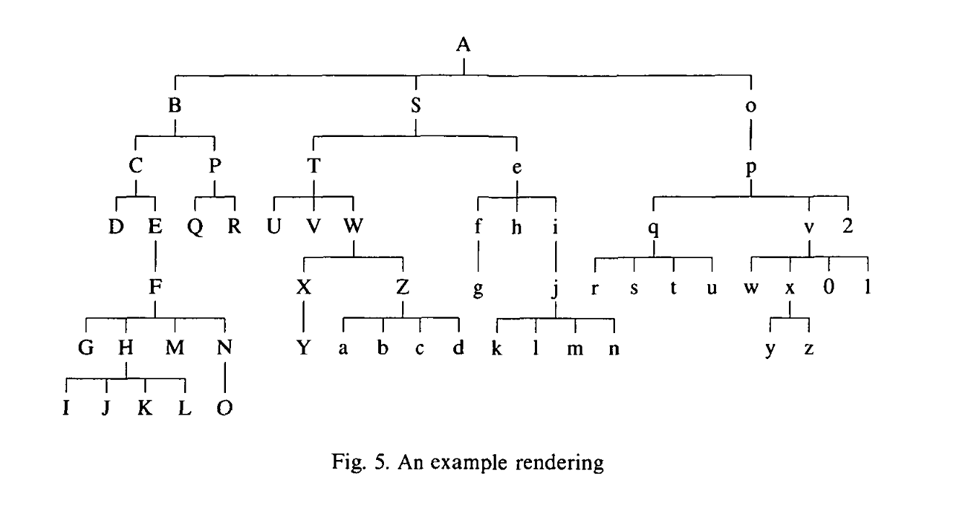
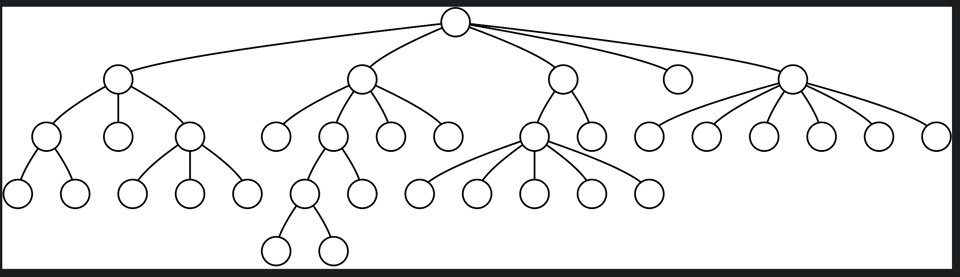
In the past I've tried to automate these layouts and ran into all sort of annoying problems with getting the trees to display nicely, so when I came across Functional Pearl: Drawing Trees, which contains an algorithm for doing exactly this, I thought I would take another crack at this tool I want. The paper contains a functional implementation of layout of trees:
Hell yeah, that's the good stuff.
I'm not sure I see much point in rehashing how the tree layout algorithm works, since the pearl itself does it better than I could. My implementation does similar-looking layouts:
But the question I then had was, once I have this general tool, how should I package it up for myself? If I want to render, say, a tree transformation, I don't want to have to make two separate images and then paste them together, I want a little DSL that will compile various things I tend to need to write into images for me.
Being bad at software design, I'm lucky, because not only is there a cruise-control strategy for acceptable-quality DSL systems of this sort, the canonical example of said cruise-control strategy solves almost exactly this problem!
In example 2.2.4 of Structure and Interpretation of Computer Programs, as an example of how building abstractions can be thought of as creating DSLs, Abelson and Sussman discuss how to design a DSL through thinking of the way that pieces of data in your domain compose to create new, similarly-kinded pieces of data.
They explain this through a "picture" language that lets you build up more complex images via transformations of simpler images:
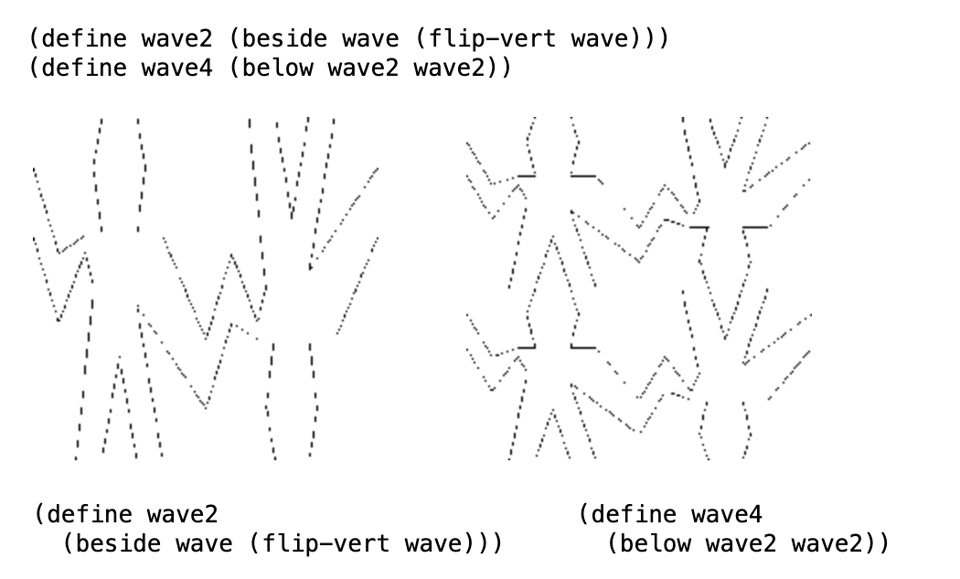
In this way they define a sort of algebra of images, where every individual operator over images is very simple, but more complex images can be built up via composition.
If I was a braver man I might also do this in some kind of lisp but I'm not, and I wrote my tool in Golang. Let's talk through its design.
We start with the notion of a Diagram: a Diagram is an image, with a defined size, fully contained in some bounding box:
// Extent defines a bounding box.
type Extent struct {
    Width  float64
    Height float64
}

type Diagram interface {
    Render(ctx *canvas.Context)
    Extent() Extent
}
canvas.Context is the type used to actually draw values to a canvas, for which I'm using the canvas library.
We can already render a simple shape using this interface:
type arrow struct {
    width, height float64
}

func Arrow(width, height float64) Diagram {
    return &arrow{width: width, height: height}
}

func (a *arrow) Extent() Extent {
    return Extent{
        Width:  a.width,
        Height: a.height,
    }
}

const arrowThickness = 0.4

func (a *arrow) Render(ctx *canvas.Context) {
    ctx.SetStrokeWidth(3.0)
    w, h := a.width, a.height

    stemLength := w - (h / 2)

    ctx.MoveTo(0, h*(1-arrowThickness)/2)
    ctx.LineTo(stemLength, h*(1-arrowThickness)/2)
    ctx.LineTo(stemLength, 0)
    ctx.LineTo(w, h*0.5)
    ctx.LineTo(stemLength, h)
    ctx.LineTo(stemLength, h*(1-(1-arrowThickness)/2))
    ctx.LineTo(0, h*(1-(1-arrowThickness)/2))
    ctx.Close()
    ctx.Stroke()
}
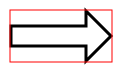
(I've also added a bit of a border and red bounding box just to make it clearer what's happening:)
Arrow(100, 50)
We can create other combinators to combine images in useful ways. The Beside combinator positions images adjacent to each other (with some adjustments so their center lines line up):
type beside struct {
    left   Diagram
    right  Diagram
}

func (b *beside) Render(ctx *canvas.Context) {
    lExtent := b.left.Extent()
    rExtent := b.right.Extent()

    vShove := max(lExtent.Height/2, rExtent.Height/2)

    ctx.Push()
    ctx.Translate(0, -lExtent.Height/2+vShove)
    b.left.Render(ctx)
    ctx.Pop()

    ctx.Push()
    ctx.Translate(lExtent.Width, -rExtent.Height/2+vShove)
    b.right.Render(ctx)
    ctx.Pop()
}

func (b *beside) Extent() Extent {
    lExtent := b.left.Extent()
    rExtent := b.right.Extent()
    return Extent{
        Width:  lExtent.Width + rExtent.Width,
        Height: max(lExtent.Height, rExtent.Height),
    }
}

func Beside(diagrams ...Diagram) Diagram {
    if len(diagrams) == 1 {
        return diagrams[0]
    }

    result := diagrams[0]
    for i := 1; i < len(diagrams); i++ {
        result = &beside{left: result, right: diagrams[i]}
    }
    return result
}
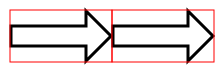
We can use this combinator to generate a more complex image from simpler ones:
arrow := Arrow(100, 50)
Beside(arrow, arrow)
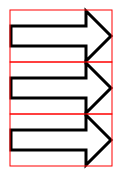
The Below combinator is basically the same:
arrow := Arrow(100, 50)
Below(arrow, arrow, arrow)
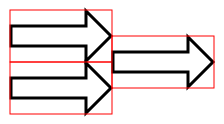
They can be combined:
arrow := Arrow(100, 50)
Beside(Below(arrow, arrow), arrow)
You can imagine many other kinds of combinators we can use to manipulate these things, rotations (at least 90 degree ones) are pretty easy, as are scalings.
Once we have this, and our trees are implementing this rendering interface, we can make all kinds of fun, good-enough diagrams without much effort:
Below(
    Text("Associativity (Ass)", 80),
    Beside(
        Join(Node("R"), Join(Node("S"), Node("T"))),
        Arrow(100, 50),
        Join(Join(Node("R"), Node("S")), Node("T")),
    )
)
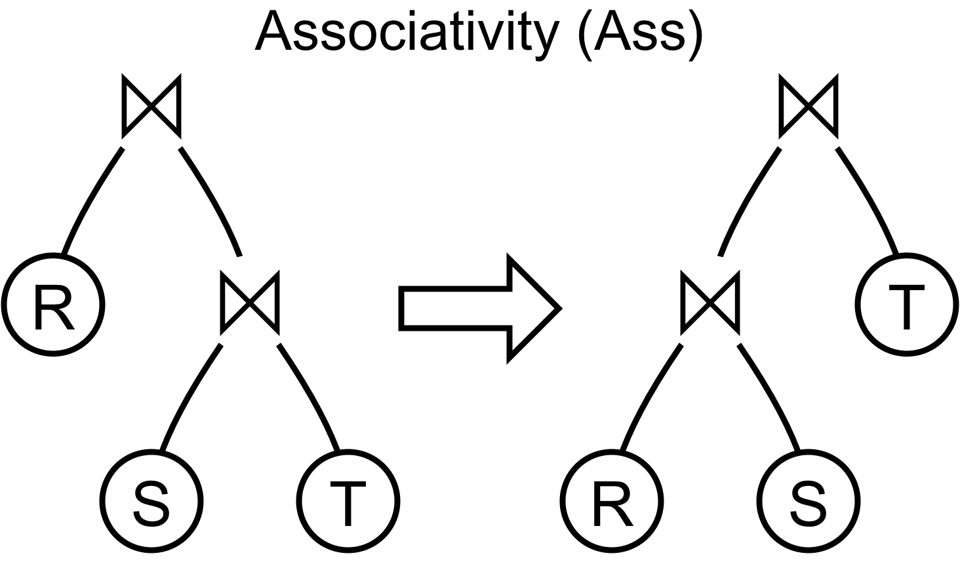
It's not perfect yet, but I think it's a nice start! And it was fun. If you want some kind of home-grown tool for building diagrams I can whole-heartedly recommend this approach. It came together in a weekend and I'm looking forward to tinkering with it going forward.
Add a comment: