
When AI comes for purpose
Mathematician and Cornell professor Steven Strogatz was a guest on NYT’s Daily podcast to talk about the recent developments in Mathematics. Well, it starts...
Rising to top net worth, by age
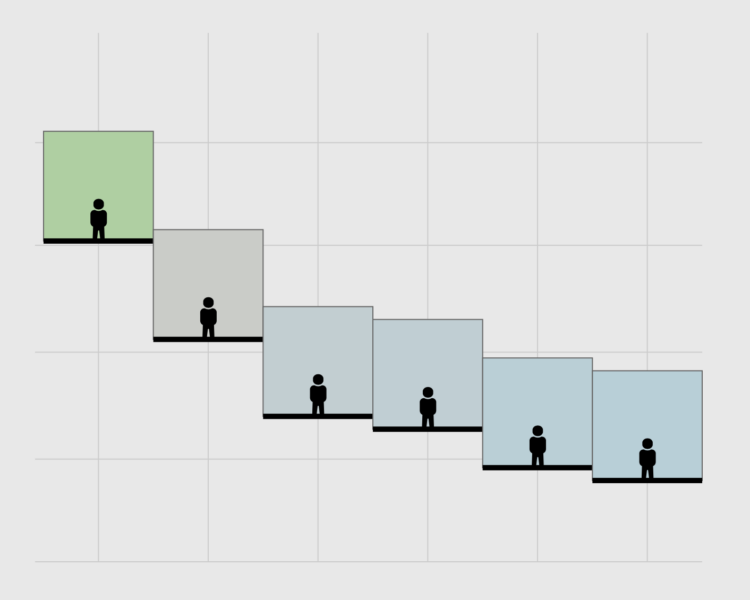
Results from the Survey of Consumer Finances for 2025 were recently released, which means it is time for a rendition of seeing who has a higher net worth....
Increasing number of shots in movies
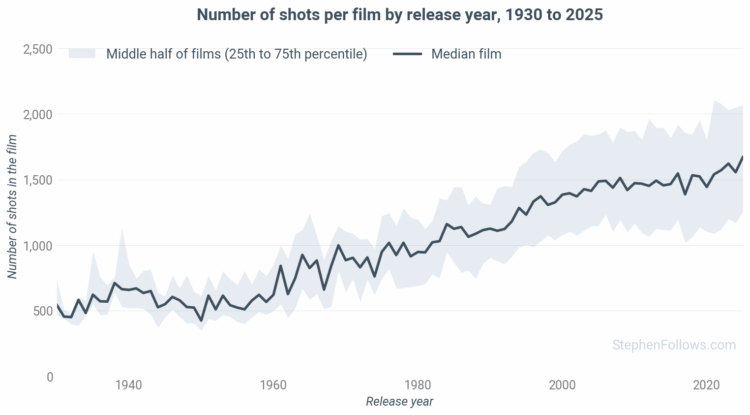
Stephen Follows counted the number of shots in movies, from 1920 through 2025. The overall number of shots increased, and so has the range. Between the 1930s...
Calculation volumes for AI training
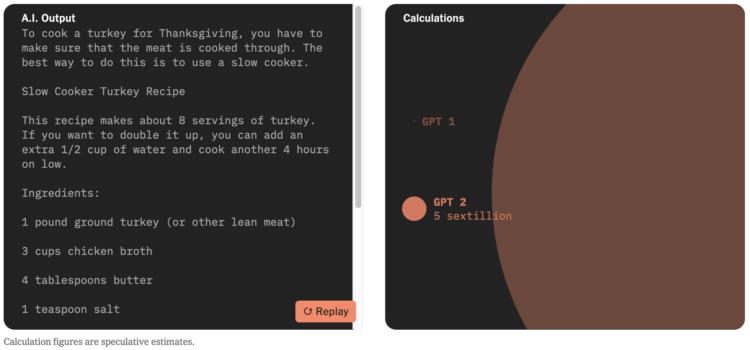
More big numbers coming in. For NYT’s the Upshot, Aatish Bhatia demonstrates the millions of trillions (octillions!) of calculations required for training...

Warming Stripes as a screensaver
This is fun, or I guess very serious depending on your point of view. Georgios Karamanis adapted the Show Your Stripes project, which visualizes average...
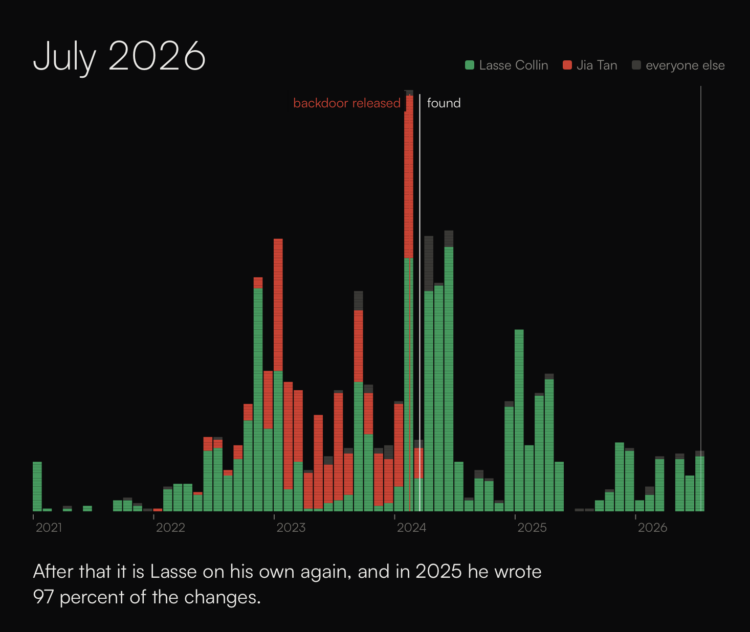
People holding up the internet
In reference to the xkcd comic that illustrates the internet as a stack of blocks propped up by a small project, sheets.works shows development history of...
Searchable database of the enslaved in former British colonies
The Centre for the Study of the Legacies of British Slavery published a searchable database of four million records logged between 1813 and 1840. For the...
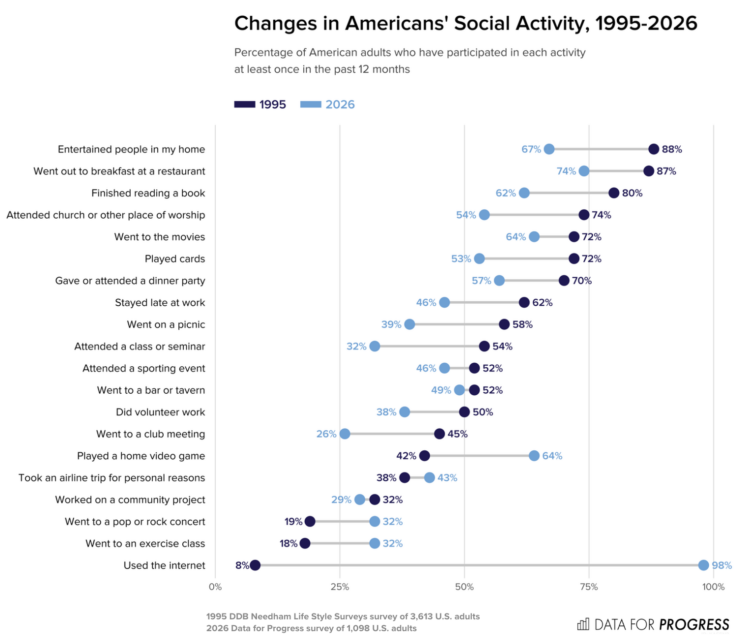
Decline in American social activities
Data for Progress compared social activities among American adults in 1995 against 2026. Hanging out with others is down a lot for many activities. We find...
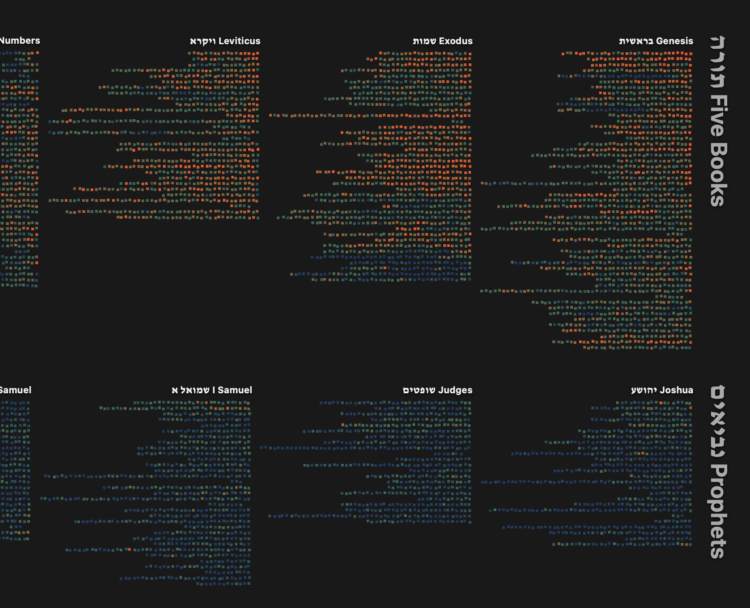
Interactive map of the Hebrew Bible
Torahmap by Danyel Fisher is an interactive visualization of the Hebrew Bible. Each column represents a book, each line represents a chapter, and each square...
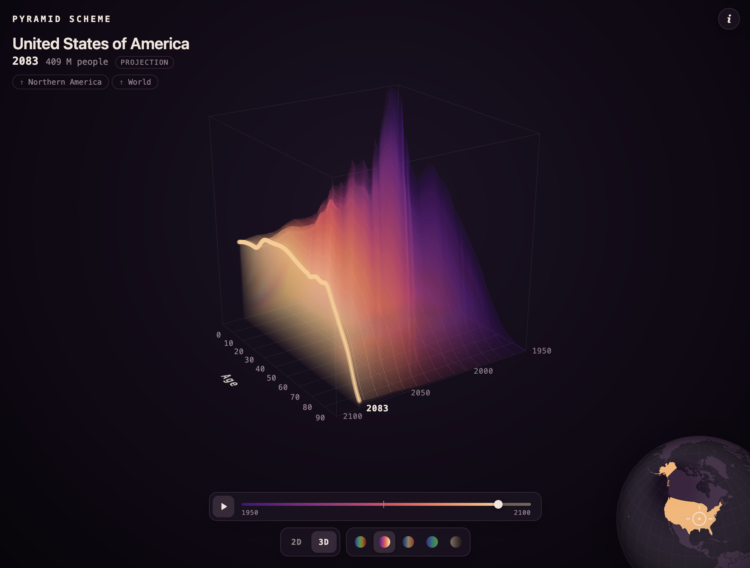
Population pyramid in 3-D and over time
A population pyramid shows the age distribution of a population, usually with counts on the x-axis, age on the y-axis, and two sides for male and female....
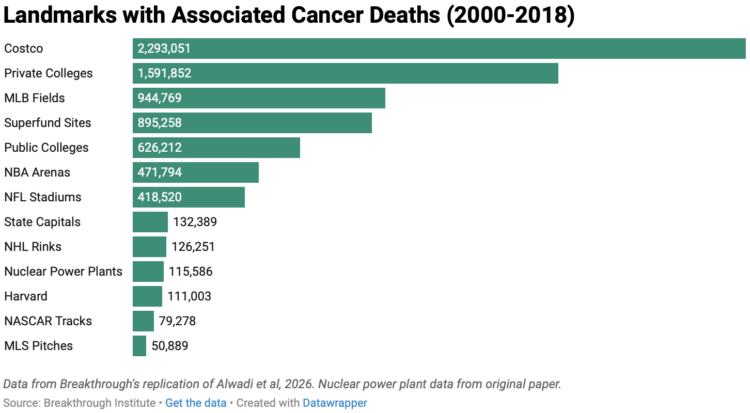
When data shows that everything causes cancer
Harvard researchers published an analysis arguing that risk of cancer increases when people live closer to nuclear power plants. Deric Tilson and Adam Stein,...
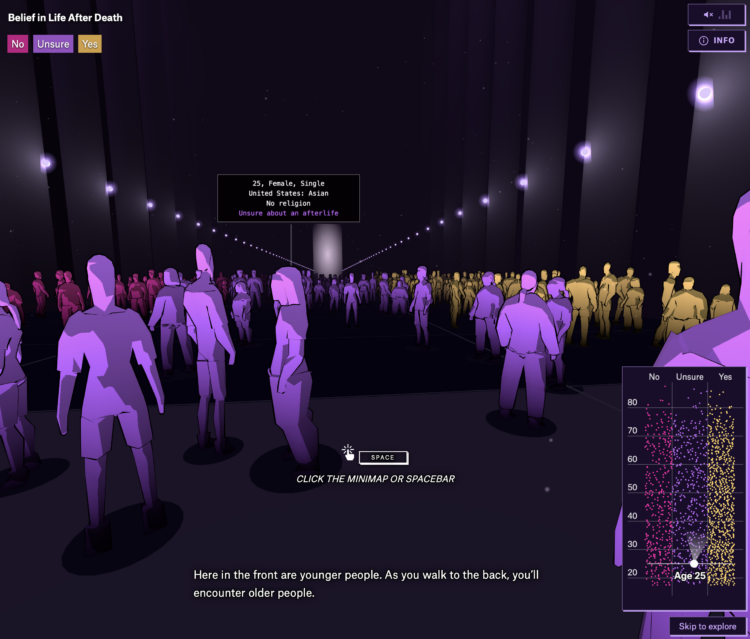
Beliefs in life after death
Is there something that comes after we die? For the Pudding, Alvin Chang imagined what it would be like if you walked into a room and could see everyone’s...
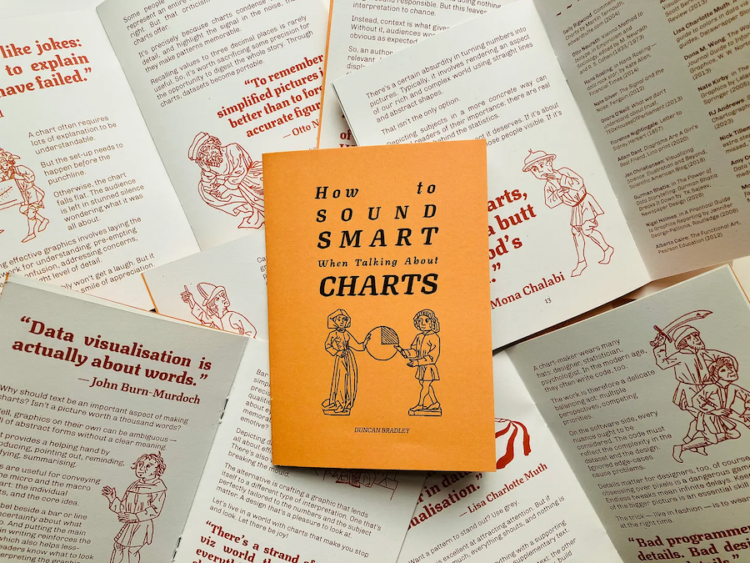
Sound smart about charts
Duncan Bradley made a zine of one-liners from data visualization folks. It is called “How to Sound Smart When Talking About Charts.” Tags: Duncan Bradley,...
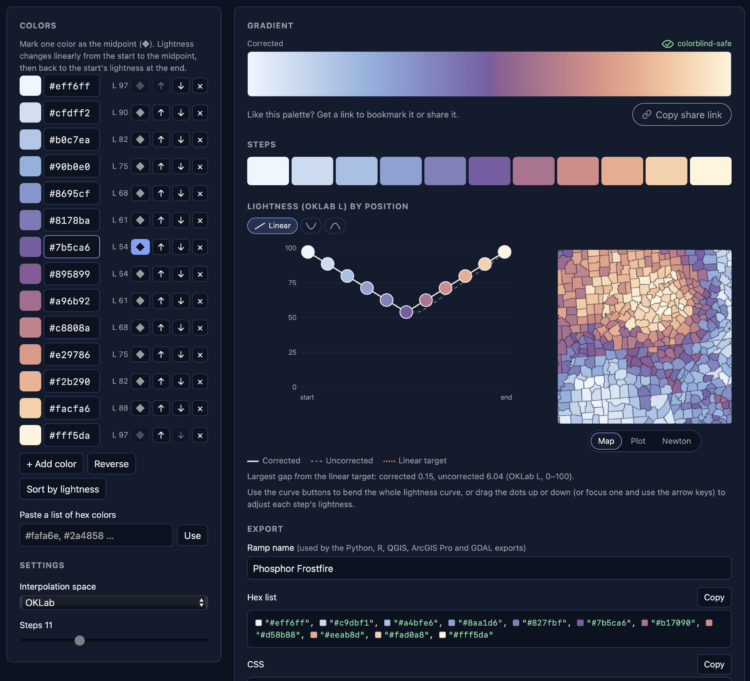
Color gradients that are accessible and perceptually steady
It has been a whole ten minutes since posting a color selection tool, so here is another. Phosphor by Joshua Stevens lets you enter hex colors and get a...

Bedazzled campus surveillance
Over summer break, MIT installed over 500 AI-enabled surveillance cameras around campus. In an act of defiance celebration, professors started a group to...
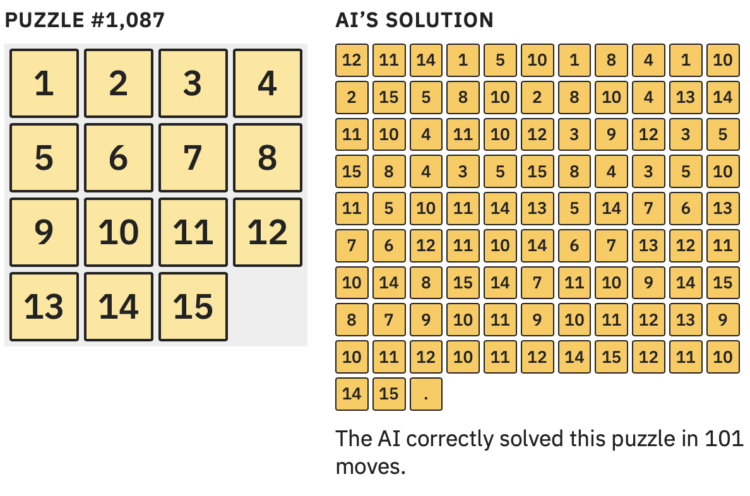
Jagged intelligence demonstrated with a puzzle
Large language models are heavily dependent on training data to determine what comes next in a series of choices. So when there is limited data for a given...
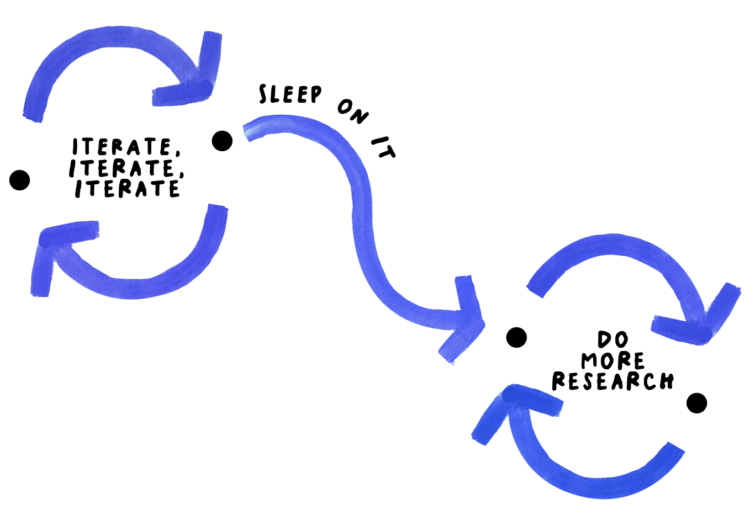
Ideas and thought in the detours
For NYT Opinion, Giorgia Lupi argues that the best ideas come from getting lost: The same is true for a great recipe, a great story or even a thoughtful...

Elevation map of the world
Bert Spaan, with help from Jules Schoonman, made an elevation map for the world, based on data from Actueel Hoogtebestand Nederland (AHN). The nice feature...
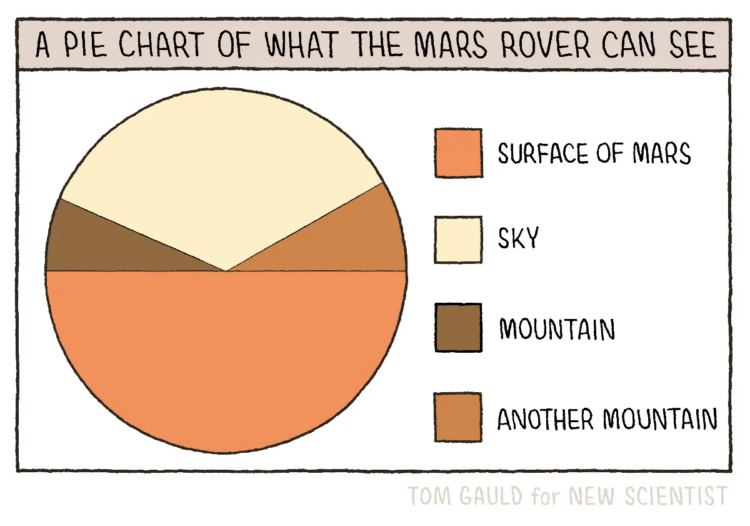
Pie chart of what the Mars rover can see
New to me, Tom Gauld, for New Scientist, made a fine pie chart to show what the Mars rover can see while on the surface of the Red Planet. This is up there...
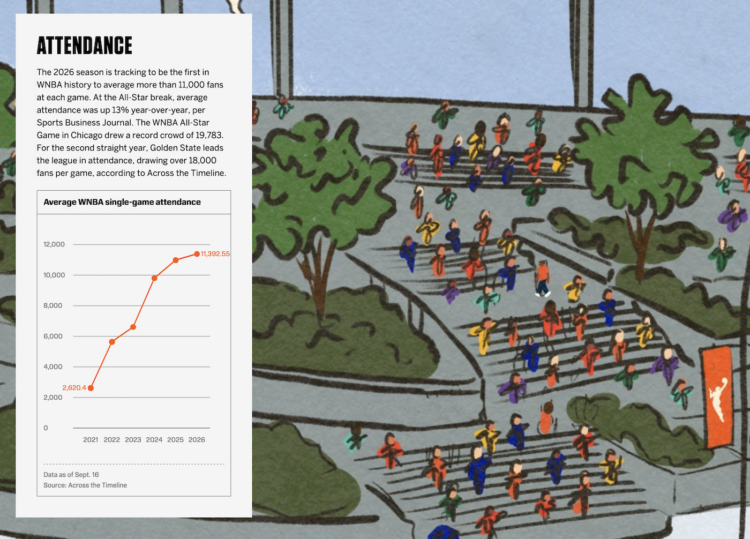
Illustration of 30 WNBA seasons
Celebrating 30 seasons of the WNBA, ESPN has a fun piece on the history of the league and how it has grown. I like the tour of the illustration as the charts...