
Warming Stripes as a screensaver
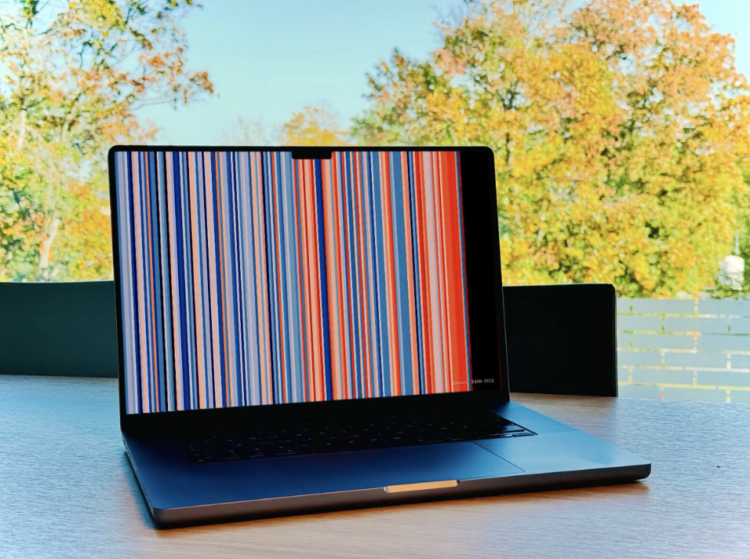
This is fun, or I guess very serious depending on your point of view. Georgios Karamanis adapted the Show Your Stripes project, which visualizes average temperature each year as a stripe, into a screensaver that runs in macOS.
It is fascinating how a simple view of data can fit into different spaces.
Tags: climate change, Georgios Karamanis, screensaver, stripes
FlowingData is 100% made possible by members. Join today and get access to courses, guides, and more resources from this real person (me, Nathan).
Don't miss what's next. Subscribe to FlowingData Daily: