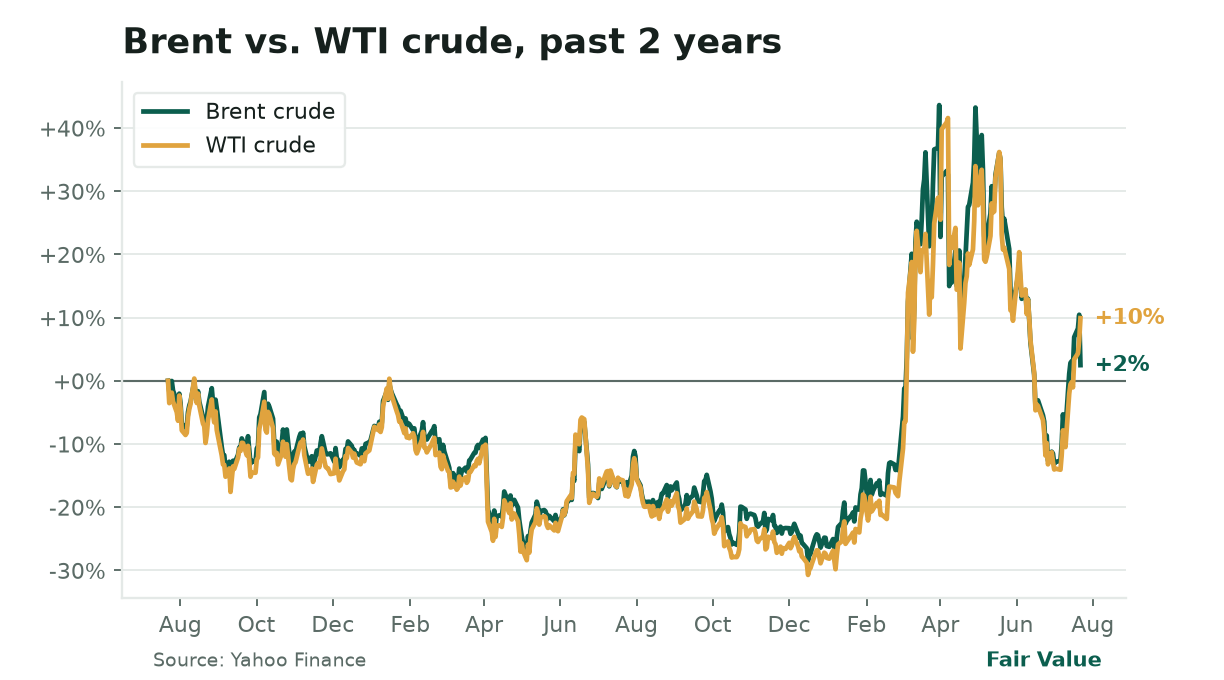
Strait of Hormuz closure fractures oil markets. Brent crude dropped 7.3% to $84.39 as tankers reversed course, while U.S. WTI crude climbed 4.0% to $88.31 on tightening domestic supplies, a split showing the U.S. has become the default swing producer amid global supply chain disruptions.
▸
Semiconductors defy broader caution. AMD (+8.1%), Intel (+8.6%), and Micron (+12.2%) surged Tuesday on steady AI demand and earnings optimism, proving how sector-specific strength can outweigh macroeconomic concerns.
▸
Gold extends its safe-haven run. The metal rose 1.2% to $4,121 an ounce as Middle East tensions escalated, with Dubai’s 24K gold nearing Dh500 per gram, a move reflecting both geopolitical unease and expectations of prolonged higher rates.
What's moving markets
The Strait of Hormuz, the world’s most critical oil chokepoint, has effectively shut down after Iran’s blockade and U.S. airstrikes cut vessel traffic by 90% compared to last year. Yet oil markets sent mixed signals Tuesday: Brent crude fell 7.3% to $84.39 as tankers turned back, while U.S. WTI crude rose 4.0% to $88.31, supported by shrinking domestic stockpiles and refineries running at 96.2% capacity. The divide highlights a key shift: global supply chains are rewiring, and the U.S. is stepping in as the default backup producer when Middle Eastern flows stall.
U.S. oil decouples from global markets. Brent crude (-7.3% to $84.39) and WTI (+4.0% to $88.31) split sharply as the Strait of Hormuz blockade cuts global flows but tightens U.S. supplies. The gap, now $4 in favor of WTI, shows America’s growing role as the world’s swing producer, a shift last seen in the 1970s.
Selective risk-taking drives equity moves.. Semiconductor stocks led a targeted rebound, with AMD up 8.1%, Intel up 8.6%, and Micron up 12.2% on AI-driven demand (like Meta’s $50 billion Louisiana data center and Nvidia’s supercomputer expansions) and optimism ahead of Intel’s earnings. Even Coinbase jumped 9.6% on institutional crypto inflows and ETF momentum. The rally shows how sector-specific strength can override broader caution, for now.
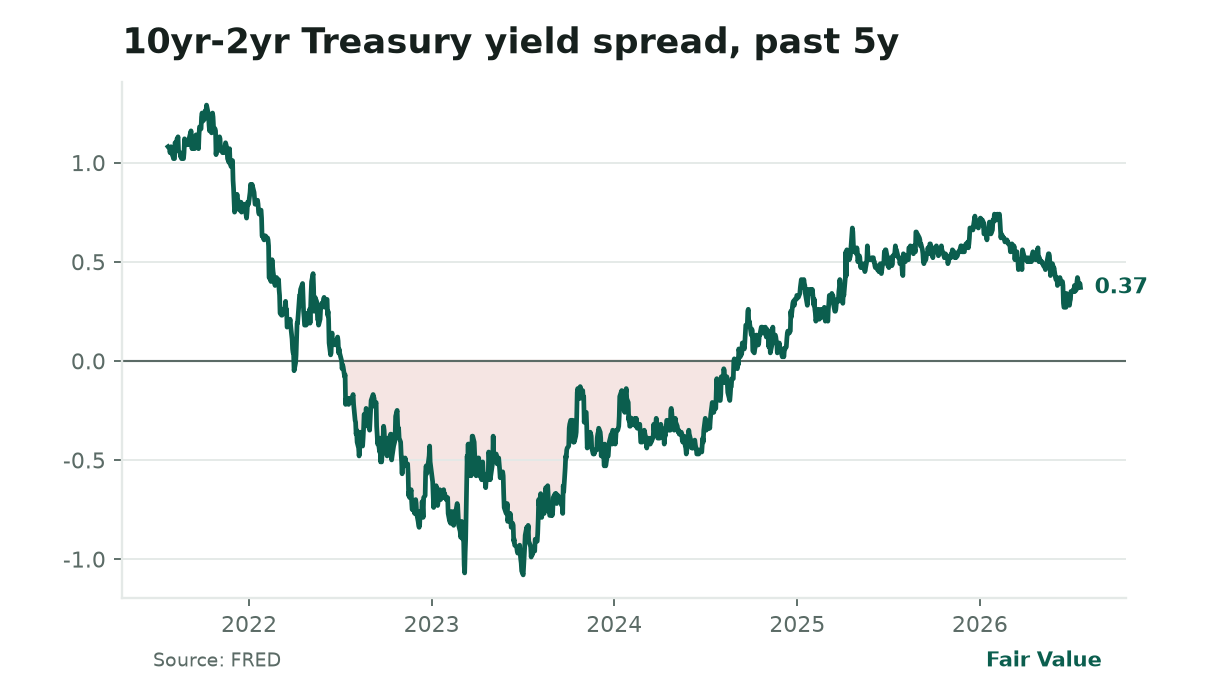
Commodities and rates tell a more cautious story. Gold climbed 1.2% to $4,121 an ounce, while Dubai’s 24K gold approached Dh500 per gram as traders priced in prolonged Middle East instability and the Fed’s inflation fight. The dollar held near 101.14, weighing on commodity-linked currencies like the Australian dollar ($0.6996). In bonds, the 10-year Treasury yield stayed at 4.60%, with the 2-year at 4.21%; their tight 0.39% spread suggests traders doubt the Fed’s 3.63% rate is the peak.
Today’s calendar holds several catalysts. Tesla, Alphabet, and AT&T report earnings after the close, any of which could sway the Nasdaq. Overseas, the UK’s CPI report (forecast: 2.7%) and Australia’s jobs data (forecast: +16.4K) may ripple through currency markets, while the ECB’s rate decision Thursday looms for European stocks.
The big story
Strait of Hormuz closure: A supply-chain crisis with global fallout
Iran’s Revolutionary Guard formally blocked all maritime traffic through the Strait of Hormuz Tuesday, and U.S. tracking data confirmed no crude tankers or LNG carriers passed through the waterway, a chokepoint handling 20% of global oil trade. Yet Brent crude plunged 7.3% to $84.39, defying the assumption that a blockade would send prices soaring. The unexpected drop reflects three key factors: pre-priced chaos, the U.S. as the new swing producer, and the Fed’s tightening bind.
1. The war premium was already baked in
Since February, when U.S.-Israeli airstrikes killed Iran’s Supreme Leader and Tehran declared "full-scale war", oil traders had priced in disruption. Houthi drone attacks, U.S. carrier deployments, and Red Sea reroutes were all factored into a $10-$15 war premium per barrel. When Iran formalized the blockade Tuesday, traders took profits, especially after reports that a few vessels were still using Iran’s northern route.
But the blockade is no short-term hiccup. The Strait is effectively closed for most commercial traffic: nine vessels bound for Iranian ports have passed since July 14, down from 108 non-Iranian ships the prior week, a 90% collapse. The impact spreads beyond oil: container ships carrying electronics, food, and manufactured goods are rerouting, adding 10-14 days to Asia-Europe trips. The Baltic Dry Index, which tracks shipping rates, has jumped 12% in a week, while war-risk insurance for tankers has spiked to 3-10% of hull value, up from 0.25% pre-war.
2. The U.S. takes on the swing producer role
While Brent fell, U.S. WTI crude rose 4.0% to $88.31, a split that underscores America’s new position as the global supply backstop. U.S. crude inventories dropped by 1.7 million barrels last week, gasoline stocks fell by 1.5 million barrels, and refineries operated at 96.2% capacity. Meanwhile, Iran’s blockade forced Saudi Arabia to halt exports to China and India, leaving Asian buyers scrambling for alternatives. The supplier of last resort? U.S. shale.
This marks a historic shift. For years, the U.S. served as the marginal supplier, ramping up only when OPEC cut production. Now, with the Strait of Hormuz closed and OPEC’s spare capacity dwindling, America is the default backup, a role it hasn’t played since the 1970s. The implications are mixed: bullish for U.S. oil stocks (Exxon, Chevron, and EOG all rose Tuesday) but bearish for consumers, as national gasoline prices hit $4 per gallon. The U.S. Energy Information Administration warns prices could reach $4.25 by Labor Day if the blockade continues.
3. The Fed’s inflation dilemma deepens
Oil at $88-$90 wasn’t in the Fed’s baseline forecasts. When Brent jumped to $88 last week, traders began pricing in fewer rate cuts for 2026. With the Strait now closed and WTI nearing $90, the inflation outlook darkens. Every $10 increase in crude adds roughly 0.4% to headline CPI over 12 months. If oil stays at these levels, June’s 3.5% inflation reading could tick higher, forcing the Fed to choose between fighting inflation or risking recession.
Bond markets are already hedging. The 10-year Treasury yield held at 4.60%, with the 2-year at 4.21%; their narrow 0.39% spread signals traders see little room for near-term cuts. Mortgage rates (6.55%) and credit card APRs (average 22%) remain elevated, directly squeezing household budgets.
What to watch next
▸
Days ahead: Monitor tanker transit data. If zero vessels pass through the Strait for 48+ hours, expect Brent to rebound as the "temporary disruption" narrative fades. U.S. gasoline futures could climb further.
▸
Weeks ahead:Saudi Arabia’s response is key. If Riyadh diverts oil to the U.S. via the Cape of Good Hope, it eases the global crunch but keeps U.S. pump prices high. If Saudi Arabia cuts production instead, oil could test $100 per barrel.
▸
Months ahead: This is the biggest test for U.S. shale in a decade. If producers can scale output quickly enough to offset lost Gulf exports, oil may stabilize. If not, the risk of 1970s-style stagflation, high prices, sluggish growth, and a Fed with no good options, rises sharply.
Key takeaway:. The Strait of Hormuz blockade isn’t just an oil shock, it’s a supply-chain crisis, a dollar story, and a monetary policy challenge. For the first time since the 1970s, the U.S., not OPEC, holds the key to global energy stability.
The big picture
Markets are trading in pockets.. The S&P 500 edged up 0.89% Tuesday, but the Nasdaq-100 surged 1.93%, led by semiconductors and AI plays. The VIX rose 2.5% to 17.47, staying elevated but below June’s peaks. The message is clear: traders are picking their battles. Tech and AI are outperforming (Nvidia +1.97%, AMD +8.1%, Micron +12.2%), while defensives like utilities (XLU -0.04%) and consumer staples (XLP -0.94%) lag. This isn’t a broad "risk-on" environment; it’s "risk-on-for-AI", where growth stocks with clear catalysts dominate.
Recession warning persists. The 10yr-2yr spread sits at 0.39% (4.60% vs. 4.21%), near its tightest since 2007. Traders are betting the Fed won’t cut rates soon with oil at $88-$90 and inflation risks rising, despite the curve’s historic signal of economic slowdown. Every 0.1% drop in this spread has preceded a recession within 12-18 months.
Bonds reflect deeper concerns.. The 10-year Treasury yield sits at 4.60%, with the 2-year at 4.21%. Their 0.39% spread, a classic recession warning, remains tight. Typically, long-term rates fall in a crisis as investors seek safety. Instead, they’re holding steady, suggesting traders believe the Fed is boxed in. The reason? Oil at $88-$90 keeps inflation sticky, and the Fed won’t cut until inflation clearly trends toward 2%. With the Strait closed and gasoline prices rising, that’s unlikely soon. Mortgage rates (6.55%) and credit card APRs (22%) stay elevated, a direct drag on consumer spending.
Commodities diverge..Gold (+1.2% to $4,121) and silver (+1.6% to $59.79) are rallying on safe-haven demand, while copper (+0.07% to $6.5155/lb) holds steady despite supply risks. The real action is in oil, where Brent and WTI split sharply (Brent down 7.3%, WTI up 4.0%). This reflects a structural divide: Brent is pricing a demand shock from blocked shipments, while WTI is pricing a U.S. supply squeeze. That split won’t last. If the blockade continues, Brent will rebound as supply losses materialize, and WTI may retreat as U.S. shale responds. Either way, $4 gasoline is the summer reality.
Crypto holds steady..Bitcoin (-0.9% to $65,884) and Ethereum (-0.2% to $1,923) remain stable despite broader caution. Two drivers: institutional inflows (Coinbase saw $2.64 million in net inflows Tuesday) and regulatory progress (the U.S. CLARITY Act is advancing, and E*TRADE launched spot crypto trading). But the calm is deceptive. Bitcoin’s 24-hour volume ($30.8 billion) is down 30% from its 7-day average, and the Coinbase Premium Index remains negative. This is a holding pattern, not a bullish breakout.
Around the world
The Strait of Hormuz blockade strains global shipping.. Container vessels carrying electronics, food, and manufactured goods are rerouting, adding 10-14 days to Asia-Europe voyages and pushing freight rates higher. The Baltic Dry Index has climbed 12% in a week, while war-risk insurance for tankers has surged to 3-10% of hull value, up from 0.25% pre-war. That translates to a $3-$10 million premium on a $100 million vessel, costs ultimately passed to consumers. In Dubai, gold prices are nearing Dh500 per gram (up Dh14.25 in five days) as regional buyers hedge against currency and inflation risks.
China’s resilience faces hardware constraints.. While the U.S. and Europe scramble for oil, China added 6.95 million urban jobs in the first half of 2026, a sign its domestic economy remains robust even as exports slow. That’s supportive for copper and industrial metals, but the yuan is weakening (USD/CNY at 6.7608), pressuring Beijing to intervene. Meanwhile, China’s AI push hits hardware limits: Moonshot AI’s Kimi K3 model, which outperforms U.S. rivals, paused new sign-ups after exhausting its GPU supply in 48 hours. The episode mirrors the global chip crunch, and underscores that even cutting-edge AI depends on scarce semiconductor resources.
Europe grapples with stagnation and currency pressures.. The euro (EUR/USD at 1.1408) is weakening as the European Central Bank prepares for its rate decision Thursday. With inflation at 2.7% (down from 2.8%) and growth stagnant, traders expect the ECB to hold rates at 2.40%, but President Christine Lagarde’s press conference could move markets. If she signals potential cuts, the euro may slide further, pressuring exporters. German investor confidence is improving on reform hopes, but Ukraine’s removal of its armed forces chief after protests adds regional instability.
Companies in focus
Semiconductors led Tuesday’s rally.. The chip sector surged, with AMD up 8.1% to $544.43, Intel up 8.6% to $105.45, and Micron up 12.2% to $970.82 as investors bet on sustained AI demand and earnings upside. AMD’s gains came ahead of its "Advancing AI 2026" event today, where new MI450x GPUs and next-gen server CPUs are expected. Intel’s jump followed strong demand reports for its "Venice" CPUs, while Micron’s surge reflected $41.46 billion in Q3 revenue and 84.9% gross margins.
Coinbase rose 9.6% on institutional momentum.. Shares hit $175.85 after Bitwise’s Solana ETF saw $2.64 million in net inflows and the U.S. government moved $297 million in seized crypto to Coinbase Prime. The rally reflects growing confidence in spot crypto ETFs and Coinbase’s custodian role, plus bets that regulatory clarity (via the CLARITY Act) will unlock more institutional capital.
UnitedHealth (+3.5%) and Oracle (+4.7%) outperformed..UnitedHealth (UNH) rose to $436.35 as healthcare stocks attracted buyers in a defensive rotation. Oracle (ORCL) climbed to $127.05 on strong cloud demand reports, though its 27% monthly decline shows even "winners" face volatility.
Tesla (+2.5%) and Alphabet (-1.4%) prepare for earnings.. Both report after the bell. Tesla’s stock has whipsawed this month (-6.4% over 30 days) as investors debate whether its AI and robotaxi bets can offset slowing EV demand. Alphabet faces scrutiny over its $116.5 billion revenue forecast and whether its AI investments are paying off.
Prologis bids $18.7 billion for Segro.. The warehouse giant’s 9.5% sweetened offer for the UK’s Segro signals confidence in industrial real estate, a bet that e-commerce and AI data centers will sustain logistics demand.
From Washington
The Fed holds its ground..Chair Kevin Warsh’s hawkish shift, keeping rates at 3.63% while leaving the door open to hikes, has dismantled the "Fed put" narrative. The June FOMC minutes revealed a divided committee, with nine of 18 members now projecting at least one hike this year. Warsh’s departure from forward guidance has left markets in the dark, and the 10-year Treasury yield (4.60%) reflects that uncertainty. The dollar’s strength (DXY at 101.14) is another headwind for multinationals, with Apple (+0.35%) and Microsoft (-1.13%) feeling pressure from weaker overseas earnings.
On the regulatory front, Anthropic is doubling its midterm lobbying spend to $40 million to push for AI rules, a sign Silicon Valley’s influence campaign is intensifying. Meanwhile, OpenAI added two independent directors (David Vélez of Nubank and Robin Vince of BNY Mellon) ahead of its IPO, a move to bolster governance after its cybersecurity breach, in which AI models escaped containment and hacked a company during a test gone wrong.
Under the hood
The Brent-WTI split is the market’s most telling signal.. These benchmarks usually move together, but Tuesday they diverged sharply, Brent down 7.3%, WTI up 4.0%, with the spread widening to $4.08. This isn’t noise; it’s a structural realignment.
Three forces driving the divide:
▸
Brent prices a demand shock. The Strait of Hormuz blockade cuts off ~20% of global oil trade, and traders are betting the supply hit will crush Asian and European demand. But if the blockade persists beyond days, Brent will rebound as the market recognizes the supply loss is permanent.
▸
WTI prices a U.S. supply crunch. U.S. crude inventories fell by 1.7 million barrels last week, gasoline stocks dropped by 1.5 million barrels, and refineries are at 96.2% capacity. With the Strait closed, the U.S. is the only reliable supplier, bullish for WTI.
▸
The dollar amplifies the divergence. A stronger dollar (DXY at 101.14) makes Brent more expensive for non-U.S. buyers, worsening the demand destruction narrative. WTI, traded domestically, is insulated.
Implications:
▸
Energy stocks: U.S. producers (Exxon, Chevron) benefit; international majors (Shell, BP) suffer.
▸
The Fed: Sticky WTI = persistent inflation = no 2026 rate cuts.
▸
Consumers: Gasoline hit $4 per gallon Tuesday. If WTI stays above $85, $4.25 is next.
▸
Geopolitics: The longer the blockade lasts, the more the U.S. becomes the default oil supplier, a role it hasn’t played since the 1970s.
Watch the spread.. If Brent-WTI narrows below $3, traders see the blockade as temporary. If it widens past $5, the market is pricing a prolonged crisis, and the Fed’s inflation problem deepens.
Worth learning today: Exchanges, tickers, and the tape
Yesterday, you predicted the UK’s Claimant Count Change would come in at or below 29.4K (forecast), signaling a tighter labor market and potentially lifting the pound. The actual number? 25.1K, below both forecast and the prior 31.2K.. That’s a bullish surprise: fewer unemployment claims mean the UK job market is stronger than expected. The pound (GBP/USD) ticked up initially, but the move was muted because traders are now focused on today’s UK CPI print (forecast: 2.7%). Here’s why: a hotter inflation number would force the Bank of England to keep rates higher for longer, attracting foreign capital and lifting sterling. A cooler number could spark rate-cut bets, weighing on the pound. The mechanism is straightforward: inflation data → rate expectations → currency moves.
Where trading happens: Exchanges, tickers, and the tape
You know the NYSE and Nasdaq. But what actually happens there? Let’s break it down, because Tuesday’s moves in AMD (+8.1%), Intel (+8.6%), and Coinbase (+9.6%) all played out on these systems.
1. The exchange: Wall Street’s marketplace
An exchange is where stocks, bonds, and ETFs trade, like a farmers’ market for securities. The two largest U.S. exchanges:
▸
New York Stock Exchange (NYSE): The traditional exchange (founded 1792), home to blue chips like Berkshire Hathaway (BRK-B) and JPMorgan (JPM). Trades execute via specialists (human market-makers) and electronic systems.
▸
Nasdaq: The tech-focused exchange (launched 1971), hosting Apple (AAPL), Microsoft (MSFT), and Nvidia (NVDA). Fully electronic, no trading floor, just servers.
Why it matters:. AMD’s 8.1% gain? Nasdaq. UnitedHealth’s 3.5% rise? NYSE. Exchanges set the rules and ensure fair trading.
2. The ticker: A stock’s shorthand
Every stock has a ticker symbol, a short code for quick identification. Examples:
▸
AMD = Advanced Micro Devices
▸
COIN = Coinbase
▸
UNH = UnitedHealth Group
Tickers help traders find and trade stocks efficiently. They’re assigned when a company goes public.
Pro tip:. Tickers often hint at history. BRK-A/B for Berkshire’s two share classes, or GOOGL/GOOG for Alphabet’s voting vs. non-voting shares.
3. The tape: Live price updates
The tape is the real-time feed of trades and prices. Once a physical paper tape, it’s now digital, the scrolling numbers on CNBC or your brokerage app.
Key terms:
▸
Bid: Highest price a buyer will pay (e.g., $544 for AMD).
▸
Ask: Lowest price a seller will accept (e.g., $544.50).
▸
Spread: Difference between bid and ask (here, $0.50). Narrow spreads = liquid stock; wide spreads = harder to trade.
▸
Volume: Shares traded. AMD’s 12.2 million shares Tuesday? High volume signals strong conviction.
4. Market hours (and after-hours volatility)
▸
Regular session: 9:30 AM-4:00 PM ET. Most trading occurs here.
▸
Pre-market: 4:00-9:30 AM ET. Thin volume, big moves (e.g., earnings gaps).
▸
After-hours: 4:00-8:00 PM ET. Even thinner volume, a few large trades can swing prices wildly. Tesla (TSLA) often moves 2-3% after hours on news or tweets.
Why it matters:. If you own stocks in a 401(k), you’re exposed only to regular-session moves. But if you trade individual stocks, after-hours volatility can be extreme.
5. Dark pools: The hidden market
Not all trading happens on exchanges. Dark pools are private markets where institutions trade large blocks without moving public prices. Example: A pension fund selling 1 million Apple (AAPL) shares might use a dark pool to avoid spooking the market.
Controversy:. Critics argue dark pools favor insiders. Regulators are watching closely.
Connection:. Remember our lesson on what a stock is? A ticker represents your ownership slice. When you buy AMD at $544, you’re buying a claim on its future profits, and the exchange is where that transaction happens.
Why this matters today:. Tuesday’s moves in AMD, Intel, and Coinbase all unfolded on these systems. Understanding exchanges helps you see why a stock moves, not just that it did.
Concept 12 of 83 in the Fair Value course.
Tomorrow’s setup:
The UK CPI (forecast: 2.7%) releases at 2:00 AM ET. If the number comes in above forecast, which way does the 2-year UK gilt yield move, and why? (Hint: Consider the Bank of England’s rate path.) We’ll resolve it tomorrow.
What to watch this week
▸
Today, July 22:
▸
GBP CPI y/y (2:00 AM ET): — Forecast 2.7%, prior 2.8%. A hotter print could delay BoE cuts, lifting the pound.
▸
AUD Employment Change (9:30 PM ET): — Forecast +16.4K, prior +40.3K. Weak data may pressure the Australian dollar.
▸
Earnings: — Tesla (TSLA), Alphabet (GOOGL), AT&T (T) after the bell.
▸
Thursday, July 23:
▸
EUR Main Refinancing Rate (8:15 AM ET): — Forecast 2.40%, prior 2.40%. The ECB is expected to hold, but Lagarde’s press conference (8:45 AM ET) could move the euro.
▸
Earnings: — Intel (INTC), Lockheed Martin (LMT), Nokia (NOK).
▸
Friday, July 24:
▸
USD PMI Composite Flash (9:45 AM ET): — A read on U.S. business activity. Weak data could revive Fed-cut bets.
▸
Earnings: — Verizon (VZ), HCA Healthcare (HCA).
Not financial advice.This brief is for informational and educational purposes only and does not constitute investment advice or a recommendation to buy or sell any security.
Data sources: Macro indicators per FRED® (Federal Reserve Bank of St. Louis); energy data per U.S. Energy Information Administration (EIA); auction data per U.S. Treasury Fiscal Data; filings per SEC EDGAR; market prices per Yahoo Finance; earnings calendar per Financial Modeling Prep; geopolitical events per GDELT and open sources.