ECB decides at 8:15 AM ET with a 25bp hike priced in, the deposit rate would hit 2.50%, the top of the ECB's estimated neutral range, making the press conference the real market mover for the euro and global bonds.
▸
US producer prices jumped 0.4% in August, double the prior month's flat reading, signaling pipeline inflation pressure that could keep the Fed cautious ahead of tomorrow's consumer CPI.
▸
Brent crude climbed 1.2% to $102.35, the highest settle since July as Strait of Hormuz disruptions cut Middle East exports, adding a fresh supply shock to an already tight oil market.
The big story
Four forces are converging on long-term interest rates today, and the collision is already rewriting the math for mortgages, corporate borrowing, and equity valuations.
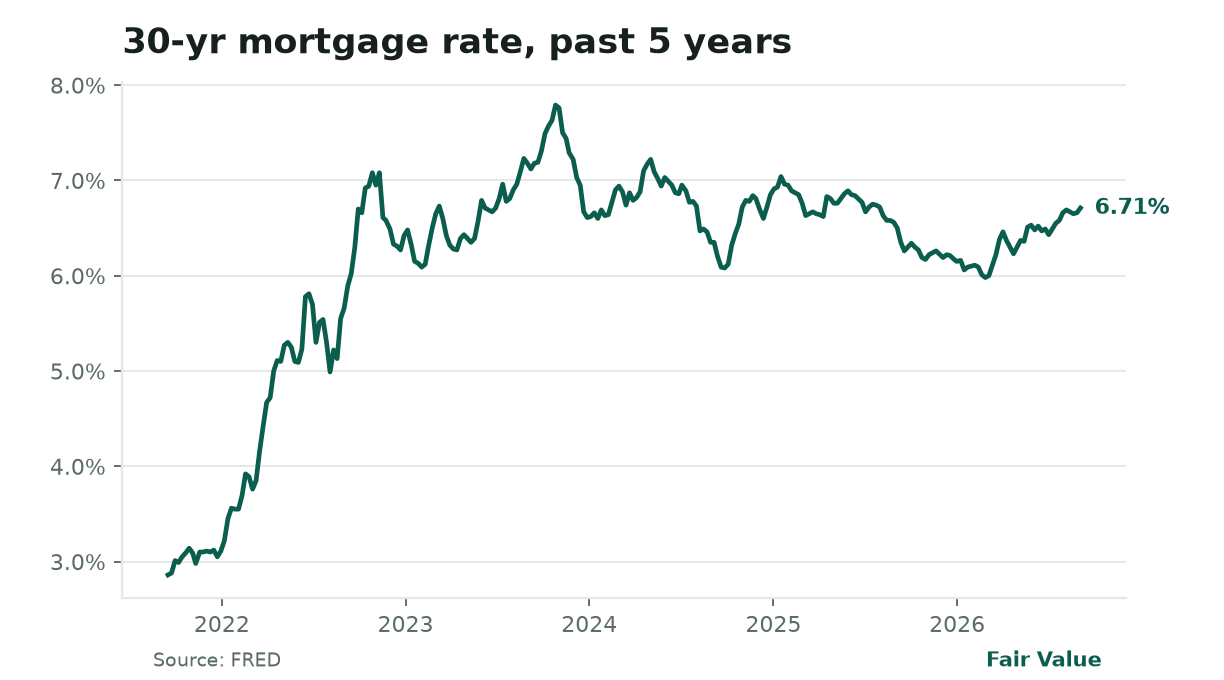
Mortgage rates at 6.7%, highest since mid‑2025. The 5‑year chart shows rates rising from about 5.0% in early 2024 to today’s 6.71%, the last time they topped 6.5% was July 2025, when new‑home sales slumped sharply.
The European Central Bank meets at 8:15 AM ET with a quarter-point hike fully priced in, the deposit rate would rise to 2.50%, the Main Refinancing Rate to 2.65%. But the decision itself is the sideshow. Markets are laser-focused on Christine Lagarde's 8:45 AM press conference for signals on whether this hike marks the end of the tightening cycle or leaves the door open for more.
The ECB's own "neutral range" estimate tops out around 3.00% on the deposit rate, so today's move brings policy to the edge of explicitly restrictive territory. If Lagarde sounds hawkish, the euro rallies and European bond yields climb further, pulling US Treasuries along via arbitrage. If she signals a pause, the euro could give back its recent gains.
At the same time, US producer prices came in hot this morning, the headline PPI rose 0.4% month-over-month in August versus a flat reading in July, and core PPI (excluding food and energy) rose 0.3% versus 0.2% prior. Producer prices are the pipeline that feeds consumer inflation; when factories pay more for inputs, those costs eventually reach households. The hot print reinforces the Fed's "higher for longer" stance and makes tomorrow's CPI report even more consequential. A strong CPI would cement expectations that the Fed holds rates at 5.25-5.50% through its September 16-17 meeting, the probability is already priced at 58% per Edward Jones.
Layer in a Treasury operation that is mechanically steepening the yield curve. Yesterday the Treasury announced a $6 billion buyback of longer-term debt, and yields climbed to fresh multi-year highs on the news. The 10-year Treasury yield sits at 4.80%, the 30-year at 5.25%, both at levels not seen since late 2023. The buyback reduces the supply of long-duration bonds, which mechanically pushes long-end yields up while short-end yields stay anchored by the Fed's 3.63% effective funds rate.
The result is a steeper yield curve: the 10-year/2-year spread is 0.40 percentage points, the 10-year/3-month spread 0.88 points. That steepening feeds directly into mortgage rates, which hit 6.71% this week, the highest in over a year.
Finally, Brent crude above $102 (up 7% this week, 17% this month) as Strait of Hormuz shipping disruptions persist. That geopolitical supply shock adds a fourth inflationary impulse. Every $10 on crude adds roughly 25 cents per gallon at the pump; at current levels, that's a $1.25-per-gallon tax on consumers versus early summer.
The semiconductor rally, the only sector showing consistent leadership, is now running into a genuine discount-rate headwind. Every 10 basis points on the 10-year adds roughly $25-30 to the monthly payment on a $400,000 mortgage. At 6.71%, the median buyer pays nearly $2,100 before taxes and insurance, up from $1,600 at the 2021 average of 3.0%. The housing market is already frozen: new home sales run at 607,000 annualized (recession levels), while permits exceed starts by 194,000 units, builders pulling permits but refusing to break ground because the financing math doesn't work.
What's going on today
Markets are pricing the convergence in real time. S&P 500 futures edged up 0.11% overnight, Nasdaq futures slipped 0.15%, reflecting the tug-of-war between AI-driven semiconductor momentum and broad discount-rate pressure. The dollar held flat near 98.8 on the DXY, gold held near $4,437, and crypto was quiet, Bitcoin down 0.4% in the last 24 hours, Ethereum flat.
The scheduled catalyst is the ECB decision at 8:15 AM ET, but the real information arrives 30 minutes later when Lagarde frames the forward path. US producer prices have already surprised to the upside, doubling last month's pace and suggesting the disinflation trend has stalled at the factory gate. Treasury yields have already priced in the hawkish impulse, the 10-year at 4.80% and 30-year at 5.25% are multi-year highs, and the Treasury's own $6 billion buyback of long-dated debt is mechanically steepening the curve by reducing long-duration supply.
Brent crude above $102 adds the geopolitical supply shock: the Strait of Hormuz has seen commercial traffic drop over 90% since February, forcing Iraq to shut 1.5 million barrels per day of production and Qatar to halt LNG exports. Tomorrow's CPI report is the next major pivot point; a hot print would lock in the Fed's restrictive stance through year-end.
The big picture
The bond market is sending the clearest signal: long-term yields are climbing because the inflation outlook has deteriorated on multiple fronts simultaneously. The 10-year Treasury yield at 4.80% is up from 4.45% a month ago, a 35-basis-point move that represents a meaningful tightening of financial conditions. The yield curve is steepening from the long end, not the short end: the 2-year yield at 4.39% has barely moved, while the 30-year at 5.25% has borne the brunt.
This is the fingerprint of the Treasury buyback operation, which swaps long-dated debt for short-term bills, reducing duration supply and pushing long yields up. Investment-grade corporate spreads remain historically tight at 0.81% over Treasuries, and high-yield spreads at 2.67%, investors are demanding little extra compensation for credit risk, a sign of complacency that could reverse sharply if growth slows.
Oil is the inflation accelerant nobody can ignore. Brent at $102.35 is up 16.7% this month alone, driven by physical supply losses, not speculation. The Strait of Hormuz, transit point for 20% of global oil, is effectively closed to normal commercial shipping. Iran has boarded tankers, laid mines, and restricted passage to approved routes.
Saudi Arabia is rerouting through the Suez Canal, adding two weeks and significant cost per voyage. Iraq has shut 1.5 million bpd of production for lack of storage.
Qatar's LNG is stranded. Global observed inventories have fallen 410 million barrels since February. The IEA now forecasts a 1.8 million bpd deficit in Q3.
The dollar is caught in crosscurrents. The DXY at 98.8 is down 0.75% this week as the yen rallied to a seven-month high (USD/JPY at 153.7, down 3.3% this week) on narrowing rate differentials. The euro at $1.164 is up 0.45% this week ahead of the ECB. Commodity currencies are mixed: the Canadian dollar at 1.381 per USD is pressured by new US tariffs on Canadian motorcycles, dairy, and alcohol, offsetting oil-linked support.
The Australian dollar at $0.721 is up 0.68% this week on China stimulus hopes. Gold at $4,437 is up 1.6% this week, catching a bid from both geopolitical hedging and real-yield dynamics, the 10-year TIPS breakeven at 2.37% suggests inflation expectations remain anchored, but the nominal yield rise is outpacing it.
Equity breadth tells a bifurcated story. The S&P 500 is down 1.5% this month, but only 42.8% of constituents trade above their 50-day moving average, a notably weak reading. The Nasdaq 100 is down just 0.7% this month, propped up by semiconductor leadership. The Russell 2000 small-cap index is down 3.2% this month.
Sector rotation is extreme: Energy (XLE) up 8.5% this month, Technology (XLK) up 0.8%, while Consumer Discretionary (XLY) down 6.0%, Industrials (XLI) down 6.9%, and Real Estate (XLRE) down 2.2%. The VIX at 16.5 is up 15% this week but remains below its long-run median of 18, complacency, not panic.
Around the world
The ECB decision today is the centerpiece of global macro. A 25bp hike to 2.65% on the Main Refinancing Rate and 2.50% on the deposit facility is baked in; the market's focus is entirely on whether Lagarde signals that policy is now "sufficiently restrictive" or leaves the door open for October. Eurozone inflation accelerated to 3.3% year-over-year in August, the highest in nearly three years, driven by energy.
The ECB's updated projections today will likely show higher headline inflation and slightly upgraded growth, a stagflationary mix that argues for caution. EUR/USD has drifted above its 200-day moving average at 1.1635 in anticipation; a hawkish surprise could push it toward 1.1750, while a dovish pivot could see a quick retest of 1.15.
The Middle East energy crisis is deepening. US strikes on Iranian tankers and Iranian missile fire into Jordan have escalated over the past 48 hours. The Strait of Hormuz has seen commercial traffic drop over 90% since February. Iraq has shut 1.5 million bpd of production; Kuwait and the UAE face potential cuts within 18-22 days if vessels cannot be re-routed.
Qatar has halted LNG production entirely. Saudi Arabia's East-West pipeline (5 million bpd capacity) and the UAE's Fujairah pipeline are the only meaningful bypass routes, insufficient for total Gulf volumes. The UAE has terminated its OPEC membership. This is not a temporary disruption; it is a structural rewiring of global energy flows that will keep a risk premium in oil for quarters, not weeks.
Canada-US trade tensions escalated this week. The US banned imports of Canadian motorcycles, certain dairy products, and most alcohol, effective later this month, retaliating against Canada's $20 billion in tariffs on US goods imposed September 8. The dispute centers on subsidized manufacturing including Bombardier. The USMCA framework is straining; integrated North American auto and energy supply chains face new friction just as industrial demand signals (copper at $6.82/lb, near record highs) flash strength. The Canadian dollar has weakened to 1.381 per USD despite oil support.
Ukraine's Zaporizhzhia Nuclear Power Plant reconnected to external power on September 7 after a three-week outage, under an IAEA-coordinated localized ceasefire. This restores reactor and spent-fuel cooling, reducing the risk of a nuclear incident. The plant, Europe's largest, has been a flashpoint since Russian occupation began. The ceasefire is narrow and fragile, but it demonstrates that even in wartime, critical infrastructure protection can be negotiated.
China's rare-earth export halt to the US, triggered by August sanctions on the Responsible Business Alliance, continues to disrupt semiconductor, defense, and EV supply chains. No quick substitute exists for heavy rare earths (dysprosium, terbium) used in high-temperature magnets. US stockpiles are limited. This is a slow-burn constraint on the very hardware the AI boom requires.
Companies making news
Semiconductors extend leadership as the only liquid AI hedge. Marvell rose 4.3% to $235.01 in Wednesday's session (week +11.7%, month +12.7%), AMD added 3.0% to $521.10 (week +13.4%, month +11.0%), Micron gained 2.8% to $1,027.77 (week +10.1%, month +19.4%), and Intel climbed 1.7% to $106.24 (week +19.4%, month +8.9%). Broadcom's forecast of $230 billion in AI semiconductor revenue by 2028, more than triple current levels, reinforced the long-term demand narrative. The rotation has broadened beyond GPUs to include fabless design, memory, and custom ASIC players. Capital is concentrating in the one sector with visible, multi-year demand visibility and pricing power.
Software and e-commerce sold off sharply. Shopify fell 5.5% to $126.79 (week -9.3%, month -18.3%), ServiceNow dropped 2.3% to $131.11 (week -8.3%), Alphabet slipped 2.3% to $330.65, and Comcast plunged 6.6% to $24.59 (week -6.5%). The common thread: high-multiple, growth-dependent names are the most sensitive to rising long-term discount rates. When the 10-year yield climbs from 4.45% to 4.80% in a month, the present value of cash flows five years out drops disproportionately. Adobe reports earnings after the close today, its guidance will test whether enterprise software demand can withstand the rate headwind.
Meta bucked the tech weakness, surging 6.5% to $653.69. (week +13.0%, month +9.9%). The move reflects both AI infrastructure spending credibility, Meta plans $130-145 billion in 2026 capex, and a re-rating of its core advertising business as Reels monetization matures. The stock is now outperforming the semiconductor cohort on a weekly basis, a rare feat.
Energy stocks caught the oil bid. Exxon rose 2.2% to $164.23, Chevron added 1.9% to $213.81, and ConocoPhillips gained 1.1% to $136.53. The energy sector (XLE) is the only S&P 500 sector up meaningfully this month (+8.5%). But the rally is supply-driven, not demand-driven, a distinction that matters for sustainability.
Tesla edged up 0.1% to $367.81. (week +3.3%, month +11.2%), decoupling from the broader consumer discretionary selloff. The market is pricing the Optimus robotics and FSD optionality separately from auto cyclicality.
Banks were mixed. JPMorgan rose 0.3% to $354.71, Bank of America added 0.5% to $62.67, Wells Fargo gained 1.9% to $89.67. Higher long-term rates steepen the yield curve, which benefits net interest margins, but only if credit quality holds. The permit-start gap in housing (1.433M permits vs 1.239M starts) signals builder distress that could eventually hit construction lending.
From Washington
The Treasury's $6 billion buyback of longer-term debt, announced Wednesday, is the most consequential fiscal-monetary interaction in months. By purchasing 10- and 30-year bonds and refunding with bills, the Treasury shortens the average maturity of outstanding debt. This reduces long-duration supply, pushing long yields up while the Fed's 3.63% effective funds rate anchors the short end.
The 10-year/2-year spread at 0.40 points and 10-year/3-month at 0.88 points are both widening from historic lows, the curve is steepening because the long end is selling off, not because the short end is rallying. This is a fiscal operation tightening financial conditions at the exact maturity that sets mortgage rates and corporate borrowing costs, directly counteracting the Fed's easing cycle. The Fed controls the front end; the Treasury just tightened the back end.
The effective federal funds rate held at 3.63% as of September 8, unchanged from the prior week, confirming the Fed has not adjusted policy since the July FOMC. Governor Cook's September 8 speech reiterated a data-dependent approach with no signal of immediate easing. The September 16-17 FOMC meeting is the next decision point; markets price a 58% probability of a hold at 5.25-5.50%.
Canada-US tariffs took effect this week. The US ban on Canadian motorcycles, dairy, and alcohol escalates a dispute that began with Canadian retaliatory duties on $20 billion of US goods. The USMCA review clause (2026) looms, either side can trigger a formal review of the agreement. Supply chain managers are already rerouting cross-border logistics.
Under the hood
The Treasury's $6B buyback is not a liquidity gift, it is a stealth steepening operation that is quietly breaking the housing market's affordability math.
Today the Treasury announced it will buy back $6 billion of longer-term debt, and yields climbed to fresh multiyear highs on the news. This is the first buyback auction with increased volume, so the market is repricing the entire curve's supply-demand balance in real time. The move lands exactly as the 10-year sits at 4.80% and mortgage rates at 6.71%, making the housing transmission the most exposed casualty.
The chain: rates-fed → bonds-credit: the Fed's easing cycle lowers the policy rate, but Treasury buybacks of long-dated debt reduce duration supply and steepen the curve; bonds-credit → housing: the 10-year yield (4.80%) directly sets mortgage rates (6.71%), so a steeper curve raises the 30-year fixed rate and crushes affordability; housing → growth: weak new home sales (607k annualized) and a widening permit-start gap (1.433M vs 1.239M) signal builders are stalling, which drags construction employment and consumer durables spending.
The surface story is simple: the Treasury is buying back $6 billion of longer-term debt, and yields rose. The market's knee-jerk read is that this is a failed liquidity operation, Bessent's move "left investors wanting more," as the WSJ put it.
But that misses the actual mechanism. A buyback of long-dated debt does not inject net liquidity; it swaps one duration for another. When the Treasury buys back 10- and 30-year bonds and refunds with bills, it shortens the average maturity of the outstanding debt.
That reduces the supply of long-duration paper, which mechanically pushes long-end yields UP (less supply, same demand) while short-end yields stay anchored by the Fed's 3.63% effective funds rate. The result is a steeper curve, exactly what we see: the 10-year/2-year spread is 0.40 points and the 10-year/3-month spread is 0.88 points, both near historic lows but now widening. The 10-year at 4.80% and the 30-year at 5.25% are the direct fingerprints of this operation.
Now follow the transmission. The 30-year fixed mortgage rate is 6.71% as of early September. That rate is priced off the 10-year Treasury plus a spread. A 4.80% 10-year implies roughly a 5.0-5.5% mortgage rate in a normal spread environment, but the actual 6.71% shows the spread has blown out, lenders are demanding more compensation for prepayment and duration risk precisely because the curve is steepening.
The housing market is already frozen: new home sales are running at 607,000 annualized, a level consistent with recession, while permits (1.433M) exceed starts (1.239M) by 194,000 units.
That gap is builders pulling permits but refusing to break ground because the financing math does not work. The buyback makes that math worse. Every 10 basis points on the 10-year adds roughly $25-30 to the monthly payment on a $400,000 mortgage.
At 6.71%, the median buyer is paying nearly $2,100 per month before taxes and insurance, up from $1,600 at the 2021 average rate of 3.0%. The buyback is not the cause of this, but it is the accelerant.
The second-order effect is on the Fed. The Fed is in an easing cycle, with the effective funds rate at 3.63% and the ECB deposit rate at 2.25%. But the Fed controls the short end. The Treasury's buyback is fighting the Fed's easing by steepening the long end, the part of the curve that actually matters for mortgages, corporate borrowing, and equity discount rates.
This is a fiscal-monetary collision: the Fed is trying to ease financial conditions, while the Treasury's debt management is tightening them at the long end. The market is now pricing this collision as a hawkish surprise, which is why yields climbed on the buyback announcement itself.
The implication for the rest of the system: if the 10-year breaks above 5.0% on the next buyback auction, the housing market's permit-start gap will widen further, construction employment will roll over, and the equity market's semiconductor-led rally will face a genuine discount-rate headwind that no amount of AI capex can offset.
The sharper edge: The live debate among professionals is whether the Treasury is deliberately steepening the curve to force the Fed's hand, either to accelerate rate cuts (to offset the long-end damage) or to signal that fiscal dominance is now the binding constraint on monetary policy. The alternative read is that this is pure debt-management mechanics with no strategic intent, and the market is over-reading a routine operation. The tell will be the next buyback's size and maturity mix: if the Treasury leans even harder into long-dated buybacks, the steepening is intentional and the housing market is the intended pressure point.
Watch: The 10-year Treasury yield breaking above 5.0% on the next buyback auction would confirm the steepening is accelerating; conversely, if the 10-year falls back below 4.70% despite the buyback, the operation is being absorbed and the housing transmission is less severe than feared.
Worth learning today: Treasury auctions: funding the government
Today's ECB decision, the hot PPI print, and the Treasury buyback all converge on one mechanism: how governments fund themselves and how that funding ripples through every interest rate you pay. The Under the Hood section illustrates this concept directly, the Treasury's buyback of long-dated debt is an auction in reverse, and it just steepened the yield curve enough to push mortgage rates higher.
Concrete first. Imagine the Treasury needs to borrow $100 billion next quarter. It doesn't walk into a bank; it holds an auction. Primary dealers, the 24 large banks authorized to bid, submit competitive bids stating the yield they'll accept. The Treasury fills orders from the lowest yield (highest price) upward until the $100 billion is sold.
The highest accepted yield becomes the "stop-out" rate, the market-clearing price for that maturity. If demand is weak, the stop-out yield jumps. That jump becomes the new benchmark for every mortgage, corporate bond, and auto loan priced off that maturity.
The mechanism. The Treasury issues three main instruments: bills (4-week to 52-week, discount pricing, no coupon), notes (2-, 3-, 5-, 7-, 10-year, semi-annual coupons), and bonds (20- and 30-year, semi-annual coupons). Bills are cash-management tools; notes and bonds fund the structural deficit. The auction calendar is published in advance, next week's 3-year, 10-year, and 30-year auctions will refund about $125 billion in maturing debt.
When the Treasury shifts issuance toward bills (as it has this year, with bill share rising to 22% of outstanding from 17% in 2022), it shortens the portfolio's average maturity. That reduces long-duration supply, which, other things equal, pushes long yields up.
Remember the yield-price seesaw from our bond lesson: less supply of 30-year bonds means higher prices? No, less supply means the remaining holders demand higher yields to absorb duration risk. The buyback is the same mechanic in reverse: the Treasury removes long bonds from the market, reducing supply, and yields rise.
Link back. The risk-free rate is gravity, every asset is valued against the Treasury curve. When the 10-year moves from 4.45% to 4.80% in a month, the discount rate for every corporate cash flow, every mortgage, every stock valuation shifts.
Deficits and the national debt determine the supply side: the Congressional Budget Office projects $2.6 trillion in net new borrowing this fiscal year. That supply has to be absorbed at some yield. The buyback doesn't change the total debt; it changes the composition, more bills, fewer bonds. That composition shift is what steepened the curve today.
Why it matters to your money right now. The 30-year fixed mortgage at 6.71% is priced off the 10-year Treasury plus a spread. The Treasury's choice to buy back long bonds instead of letting them mature naturally pushed the 10-year up, which pushed your mortgage rate up. If you're refinancing, buying a home, or carrying floating-rate debt, the auction calendar and buyback schedule are more relevant than the Fed's dot plot. The next buyback announcement, watch the maturity mix, will tell you whether this steepening is a one-off or a regime.
Concept 54 of 83 in the Fair Value course.
Tomorrow's setup: The EUR Main Refinancing Rate decision at 8:15 AM ET today (forecast 2.65%, prior 2.40%), which asset is most exposed to a surprise, which way does it move, and through what mechanism? We'll have the answer in tomorrow's edition.
What to watch this week
▸
Today, 8:15 AM ET, ECB Main Refinancing Rate decision — (forecast 2.65%, prior 2.40%). The deposit rate hits 2.50%, the top of the ECB's neutral range. Lagarde's press conference at 8:45 AM ET sets the path for October and the euro's trajectory.
▸
Today, 8:30 AM ET, US Core PPI m/m — (forecast 0.3%, prior 0.2%) and PPI m/m (forecast 0.4%, prior 0.0%). Today's hot print (0.3% core, 0.4% headline) signals pipeline inflation pressure ahead of tomorrow's CPI.
▸
Tomorrow, 8:30 AM ET, US CPI m/m — (forecast 0.4%, prior 0.1%) and Core CPI m/m (forecast 0.2%, prior 0.2%). The year-over-year readings (3.4% headline, 2.4% core) will determine whether the Fed's "higher for longer" stance hardens into an explicit hike bias.
▸
Tomorrow, 2:00 AM ET, UK GDP m/m — (forecast 0.0%, prior 0.3%). Stagnation would reinforce Bank of England caution on rate cuts.
▸
Sunday, OPEC+ meeting — (no formal announcement scheduled, but the group's production policy for October is the open question). With Brent above $100 and the Strait of Hormuz disrupted, any output increase would be symbolic; the real supply loss is geopolitical, not voluntary.
Not financial advice. This brief is for informational and educational purposes only and does not constitute investment advice or a recommendation to buy or sell any security.
Data: macro indicators per FRED® (Federal Reserve Bank of St. Louis); not endorsed or certified by the Federal Reserve Bank of St. Louis. Energy data per the U.S. Energy Information Administration (EIA). Auction data per U.S. Treasury Fiscal Data. Filings per SEC EDGAR. Market prices per Yahoo Finance. Earnings calendar per Financial Modeling Prep.