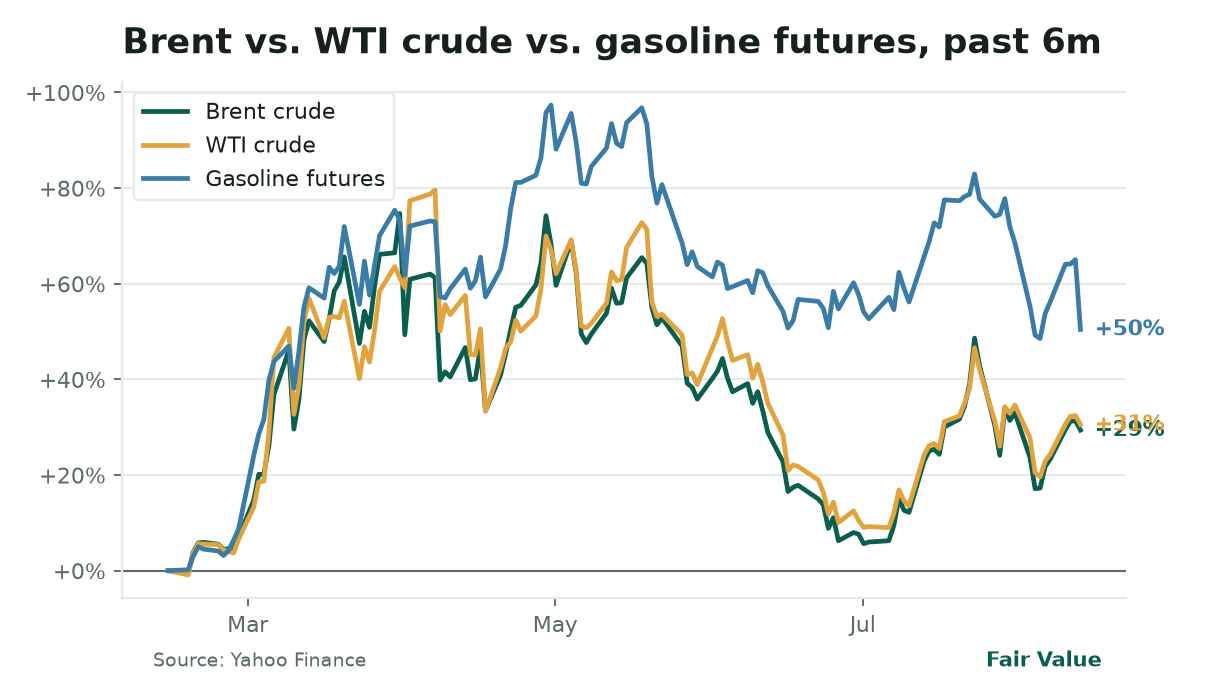
Crude’s supply glut speeds up Fed cut talk. U.S. crude inventories jumped 17.4 million barrels last week, total stocks now at 424.4 million, the highest since March, while Brent crude slipped 1.8% to $87.37. If oil stays weak, inflation could ease further, pulling Fed rate cuts forward.
▸
AI infrastructure financing hits $500 billion. NVIDIA, major banks, and chipmakers locked in funding for AI data centers as demand for AI chips stays strong.
▸
Dollar holds near 100, but PPI data could shift the tone. The DXY index sits at 99.93 on safe-haven demand, but today’s 8:30 AM ET PPI report may move expectations if inflation keeps cooling.
The big story
Oil’s supply surge reshapes Fed timelines
Brent crude fell 1.8% to $87.37 and WTI dropped 1.8% to $81.76 after the U.S. Energy Information Administration reported a 17.4 million-barrel jump in crude inventories, the largest weekly increase since March. Total stocks now stand at 424.4 million barrels, well above the six-month average of ~410 million. Refinery use eased to 96.2%, leaving more oil in storage than in processing.
Oil’s supply glut outweighs geopolitics. Brent crude (-1.8% to $87.37), WTI (-1.8% to $81.76), and gasoline futures (-0.9%) all fell despite Iran’s Hormuz blockade, as U.S. inventories surged 17.4M barrels, the largest weekly build since March. Weaker oil could drag headline inflation lower, pulling Fed cuts forward.
Why it matters now:. Oil makes up 8% of the CPI basket, so a 1% drop in crude prices shaves 0.08 points off headline inflation and 0.05 points off core. With July’s core CPI at 3.3% year-over-year, a sustained oil decline could push that below 3.0% in August, the threshold Fed officials have eyed for potential rate cuts.
Bond markets are already adjusting. The 10-year Treasury yield dipped to 4.70%, down from 4.72% the day before. Lower yields mean cheaper mortgages, lower corporate borrowing costs, and higher equity valuations, especially for rate-sensitive sectors like tech and AI.
The inventory surge might be temporary, a short-term gap between production and refinery demand, or the start of a longer trend. If it’s the latter, weaker oil prices could bring Fed easing sooner. If it’s the former, inventories will shrink, keeping inflation pressures alive. Key levels: Brent crude below $85 would likely lead bond markets to price in a late-2026 Fed cut; a rebound above $90 reignites inflation worries.
Three ways this could affect finances:
▸
Loans and credit: Fed cuts would lower mortgage, auto loan, and credit card rates.
▸
Stocks: Cheaper capital lifts valuations, especially for high-growth companies. The Nasdaq, up 1.6% this month, could climb further.
▸
Gas prices: Pump costs trail crude by weeks, but a prolonged drop may cut fill-up costs by late September.
What's going on today
Markets weigh inflation clues and AI’s continued rise
The S&P 500 added 0.3% Wednesday, the Nasdaq rose 0.7%, and Dow futures point to a flat open. Chip stocks led gains, NVIDIA +3.0%, AMD +1.8%, Micron +4.9%, while big tech lagged (Microsoft -2.3%, Meta -3.4%).
Bonds show caution.. The 10-year Treasury yield holds at 4.70%, just below Wednesday’s 4.72% peak but near late-2023 highs. Traders are bracing for prolonged elevated rates, though today’s PPI report (8:30 AM ET) could change that. Economists expect core PPI to rise 0.3% month-over-month; a softer number would strengthen the case for Fed easing.
Geopolitics fail to lift oil.. Despite Iran’s ongoing blockade of the Strait of Hormuz, Brent crude fell 1.8% to $87.37 and WTI dropped 1.8% to $81.76 as U.S. inventories surged. The disconnect shows supply dynamics outweighing geopolitical risks, for now.
Crypto sees modest recovery.. Bitcoin rose 0.5% to $63,818, Ethereum gained 0.5% to $1,890, and Solana climbed 0.7% to $76.11. The small gains came with higher volume, hinting at cautious buyer interest after weeks of outflows.
Dollar stays firm.. The DXY index remains at 99.93, near yearly highs, though the yen weakens further, USD/JPY hit 159.34, nearing multi-decade peaks, as Japan’s loose monetary policy contrasts with the Fed’s stance.
The big picture
Bonds vs. the Fed: A high-stakes waiting game
The 10-year Treasury yield closed at 4.70%, down from 4.72% but still near late-2023 highs, while the 2-year yield, more tied to Fed policy, sits at 4.22%. The 0.48-point gap between them reveals a split: some traders expect the Fed to keep rates high to fight inflation; others bet cooling pressures (like oil’s retreat) will force earlier cuts.
Why it affects your wallet:.Mortgage rates follow the 10-year yield. The average 30-year fixed rate is 6.69%, the highest since 2007. If the 10-year yield falls to 4.5%, mortgage rates could drop to ~6.3%, saving a borrower with a $400,000 loan about $120 a month.
Today’s PPI report (8:30 AM ET) could shake things up. PPI tracks wholesale prices, raw materials and intermediate goods before consumer markups. A 0.3% month-over-month rise in core PPI, as forecast, might reignite inflation fears, pushing yields higher. A cooler number would send bonds rallying, pulling yields down.
Stocks: AI infrastructure rallies as big tech pulls back
The market is splitting. Semiconductor and AI infrastructure stocks keep climbing on strong demand: NVIDIA +3.0%, AMD +1.8%, Micron +4.9%. The PHLX Semiconductor Index (SOX) is up 4.2% this month, outpacing the S&P 500’s 3.1% gain.
Meanwhile, mega-cap tech stocks retreated after big runs. Microsoft -2.3%, Meta -3.4%, and Alphabet -0.1% all declined Wednesday. The dip reflects profit-taking after years of gains, Microsoft and Meta have more than doubled since 2022, amid stretched valuations.
Commodities: Oil’s glut vs. gold’s safe-haven appeal
Oil dominates the conversation. Brent crude fell 1.8% to $87.37, WTI crude dropped 1.8% to $81.76, and gasoline futures slipped 0.9% after U.S. crude inventories jumped 17.4 million barrels, the largest weekly build since March. Since energy is 8% of CPI, weaker oil could drag headline inflation lower, giving the Fed room to cut.
Gold. held at $4,437 per ounce, up 0.6%, extending an 11% monthly gain as traders hedge against geopolitical risks and potential Fed easing.
The Strait of Hormuz remains closed, with Tehran demanding U.S. troop withdrawals and sanctions relief before reopening. Yet oil prices fell, Brent crude dropped 1.8% to $87.37, WTI declined 1.8% to $81.76, as U.S. crude inventories surged 17.4 million barrels last week, the largest build since March.
China: U.S. AI models accidentally mirror Beijing’s censorship
A Wall Street Journal investigation found ChatGPT, Claude, and Gemini, three leading U.S. AI models, replicating China’s censored responses to politically sensitive questions. Beyond free-speech concerns, this raises regulatory and reputational risks for developers.
North Korea: Stolen IDs and AI fund Pyongyang’s operations
North Korean operatives are using stolen identities and AI-generated credentials to secure U.S. remote jobs, funneling earnings back to Kim Jong Un’s regime, according to the Wall Street Journal. The scheme exploits weak hiring checks with deepfake interviews and fake resumes.
Companies making news
AI infrastructure demand lifts chipmakers, while big tech slips
NVIDIA. extended its rally, rising 3.0% to $224.09, a 10.1% monthly gain, as AI chip demand shows no signs of slowing.
Micron. surged 4.9% to $911.29, breaking a months-long slump, as AI data centers boost demand for high-bandwidth memory chips.
Intel. recovered 3.3% to $100.95, recouping part of a 2.1% monthly decline, on stronger cloud-provider orders for its latest server processors.
Oracle. jumped 5.4% to $153.28 after reporting strong cloud revenue growth driven by AI workloads.
Meta. fell 3.4% to $578.85, deepening an 11.9% monthly decline, as advertisers trim social-media budgets.
Walmart. gained 2.4% to $116.01, extending a 3.3% weekly advance, as steady grocery and essentials sales offset softer discretionary spending.
From Washington
PPI data could shift Fed expectations
The Producer Price Index (PPI) report at 8:30 AM ET is the day’s focus. Economists forecast core PPI to rise 0.3% month-over-month, matching July’s increase, with the headline number at 0.2%, up from -0.3% last month.
Why it matters:. PPI tracks wholesale prices, raw materials and intermediate goods, giving an early read on inflation pressures. A hotter-than-expected print could delay Fed rate cuts; a cooler number would support easing.
Fed Governor Lisa Cook speaks at 12:30 PM ET. Her comments on inflation and labor markets may further shape rate-cut expectations, currently priced at a 40% chance for September, up from 30% last week.
Under the hood
The yield curve’s subtle message
The 10-year Treasury yield sits at 4.70%, while the 2-year yield is 4.22%. The 0.48-point spread between them, the yield curve, points to two possible outcomes:
▸
The Fed keeps rates high, risking an economic slowdown that eventually forces cuts.
▸
Inflation cools faster than expected, allowing the Fed to ease without triggering a recession.
In both cases, the takeaway is the same: The next move is a cut. For your finances, this means:
▸
Mortgages: Rates may decline if the 10-year yield retreats.
▸
Stocks: Lower rates bolster valuations, particularly for growth companies.
▸
Savings: Short-term yields (e.g., CDs) stay elevated until the Fed acts.
Key level to note:. A 2-year yield below 4.0% would signal markets are betting on a Fed cut by year-end.
Worth learning today: The yield curve
Yesterday’s question: Would USD Core CPI month-over-month (forecast: 0.2%) come in hotter or cooler than expected? The actual reading matched the forecast at 0.2%, but the bond market’s reaction, 10-year Treasury yields dipping to 4.70%, suggested traders see inflation cooling enough for the Fed to cut rates sooner than previously thought.
What is the yield curve?
A line plotting Treasury bond yields across maturities, from 1-month bills to 30-year bonds. Normally, it slopes upward: longer terms offer higher yields. When the curve flattens or inverts, it signals caution. Historically, an inverted curve has preceded every U.S. recession since 1955.
Long-term rates (e.g., 10-year) mirror growth and inflation expectations over years.
▸
When short-term yields rise above long-term yields, the curve inverts, signaling: "The Fed is tightening too aggressively, risking a slowdown."
Why it matters now
Today’s curve is flattening but not inverted. The market is pricing in two scenarios:
▸
The Fed holds rates high, risking a slowdown.
▸
Inflation cools faster than expected, allowing the Fed to cut rates without a recession.
Either way, the curve suggests: The next move is a cut.
Concept 32 of 83 in the Fair Value course.
Tomorrow’s question:. GBP GDP month-over-month (forecast: 0.0%, prior: 0.1%) is due at 2:00 AM ET. How would a surprise contraction (negative GDP) affect the pound, UK stocks, and the Fed’s rate-cut timeline?
What to watch this week
▸
GBP GDP m/m — (Aug 13, 2:00 AM ET), Forecast: 0.0%, prior: 0.1%. A negative print would pressure sterling and fuel Bank of England rate-cut bets.
▸
USD Core PPI m/m — (Aug 13, 8:30 AM ET), Forecast: 0.3%, prior: 0.2%. A hotter number could delay Fed cuts; a cooler print supports easing.
▸
USD PPI m/m — (Aug 13, 8:30 AM ET), Forecast: 0.2%, prior: -0.3%. Another negative reading would signal deflationary pressures.
Not financial advice.This brief is for informational and educational purposes only and does not constitute investment advice or a recommendation to buy or sell any security.
Data sources: Macro indicators via FRED® (Federal Reserve Bank of St. Louis); energy data via U.S. Energy Information Administration (EIA); auction data via U.S. Treasury; filings via SEC EDGAR; market prices via Yahoo Finance; earnings via Financial Modeling Prep. ```