Narrating Your Numbers
Take a look at the graphs below and think about what could be learned from each one.
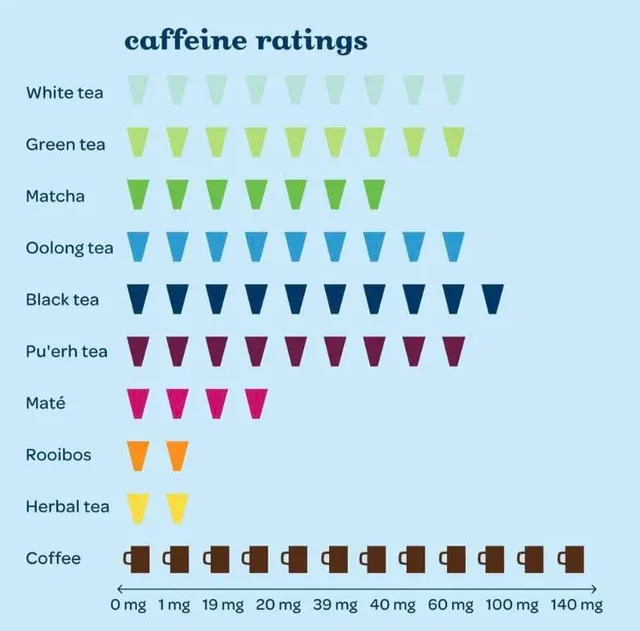
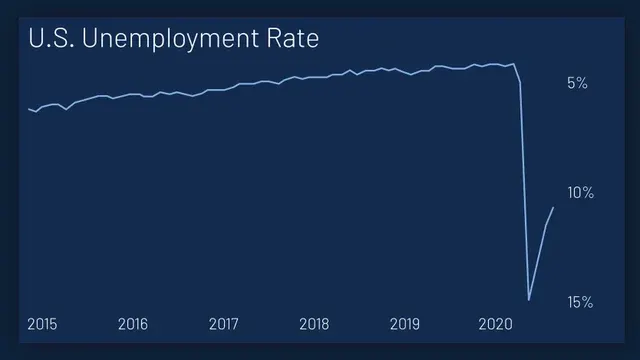
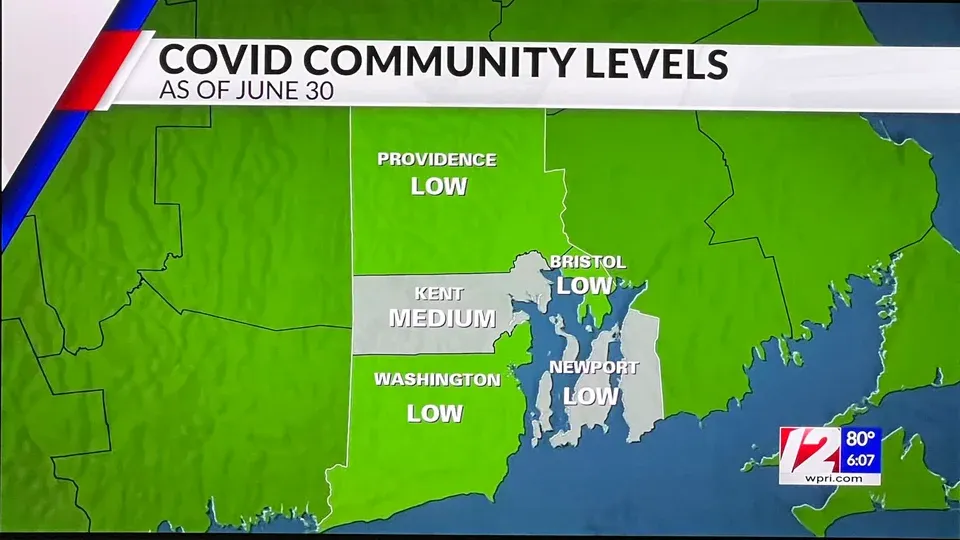
Not the best graphics right? Between their design, lack of context, and poor setups, meaningful conclusions are hard to come by. I mean, does the caffeine rating mean caffeine content or enjoyment? Is the U.S. Employment rate dropping or increasing? Why are states with low Covid community levels both grey and green? Even people who have worked with data for years would be confused by them, so how is someone with an untrained eye supposed to learn anything?
Situations like the ones above are why I chose to read “Chapter 1: Telling Stories with Data” from Visualize This by Nathan Yau. In my previous newsletter, I focused on the importance of creating accessible data visualizations. It seemed fitting that the next step would be to figure out how to convey a good story with those visualizations.
Before going any farther, it is important to note why I focus so much on the communication of data. I am currently a junior at Bucknell University and am working to get a degree in both Statistics and Marketing. My goal is to focus my future career on marketing analysis and consulting. To do so, I must ensure I am knowledgeable about making data accessible to a wide range of audiences and that the important information is highlighted. The readings from Nathan Yau have been helpful with that.
One of the main pieces of advice in the chapter is to ask questions about the data. You have to know what information you have and what stories you can tell before you start creating them. No good author starts writing a book without first thinking up a plot and the same idea applies here. Once you have questions in mind, a draft can be created. This allows you to test that you are accurately communicating the needed information, and see if there are any chances for growth.
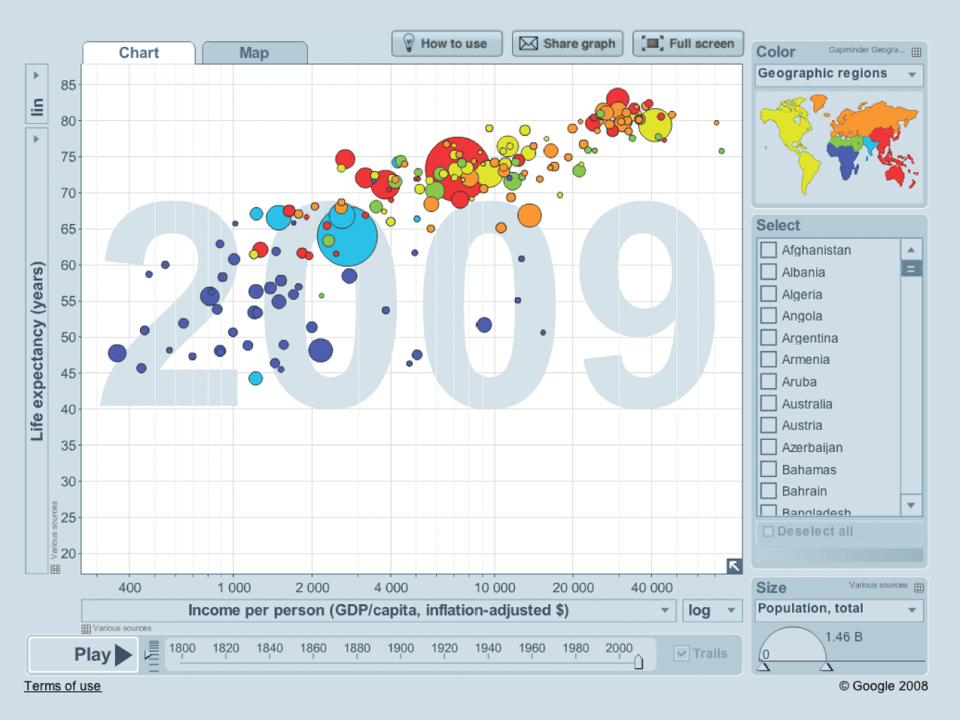
Once the questions are decided, you can start to work on how you want to tell the story. It does not have to be something simple and robotic. It can be emotional and entertaining while still being informative. This is how you make your data compelling to an audience. Yau gives an example of this from Hans Rosling. He created an animation that displayed countries’ changing levels of poverty. The movement intrigues the audience, and the size changes make them care. Rosling achieved all of this while keeping his visualization informative.
As I continue on my education, I have the opportunity to work in multiple consulting positions both from a marketing and a statistical perspective. I will be working with people with varying knowledge on what I am sharing, and I know many others will be in the same position. Thinking preemptively about what questions a visualization should answer allows you to invest more resources into conveying your message in a meaningful way. Ultimately, telling a story with data is about more than presenting accurate numbers. It is about understanding what your audience needs to know and finding the most effective way to communicate it. In the world of business, that is how you turn your ideas into reality.
[1][2][3]
https://medium.com/@thomas.ellyatt/bad-data-visualisation-real-life-examples-out-there-in-the-wild-eb5032329aeb[4]
Ch.1 Telling Stories with Data | Visualize This, 2nd Edition