$42.8 million in bus lane fines, LA's worst intersections, the cost of the Olympics, and much more
|
Mayor 2026 · raised through June 30
Lighter band is public matching funds. Both drew the same
$1,257,000, the primary cap.
|
Two weeks ago we sent you our second newsletter! Since then, six new pieces have hit the site, alongside a new map of LA’s worst intersections. We’ve been looking at where the city puts its cameras, what it expects to spend on the Olympics, and just how much of Los Angeles’s employment fits into Downtown.
There’s also plenty to watch, including a day of aircraft moving around LAX and the city’s housing construction playing out neighborhood by neighborhood.
Bus lane cameras!
If you’ve been wondering how much those cameras mounted on Metro buses are issuing in fines, we pulled the numbers. In the fiscal year that ended in June, they issued 146,184 tickets carrying $42.8 million in fines. That’s nearly a quarter of all parking fines issued by the city, already ahead of street cleaning.
$42.8m
in bus lane camera fines issued in the fiscal year that ended in June, across 146,184 tickets.
The Basin, from the city's parking citation records published by LADOT. FY2026 covers July 2025 through June 2026.
|
The streets where camera tickets were recorded cover an estimated 31 miles. Los Angeles has 7,469 miles of streets. And since the program began, more than three-quarters of its tickets have come from just three: Wilshire, La Brea and Sixth Street.
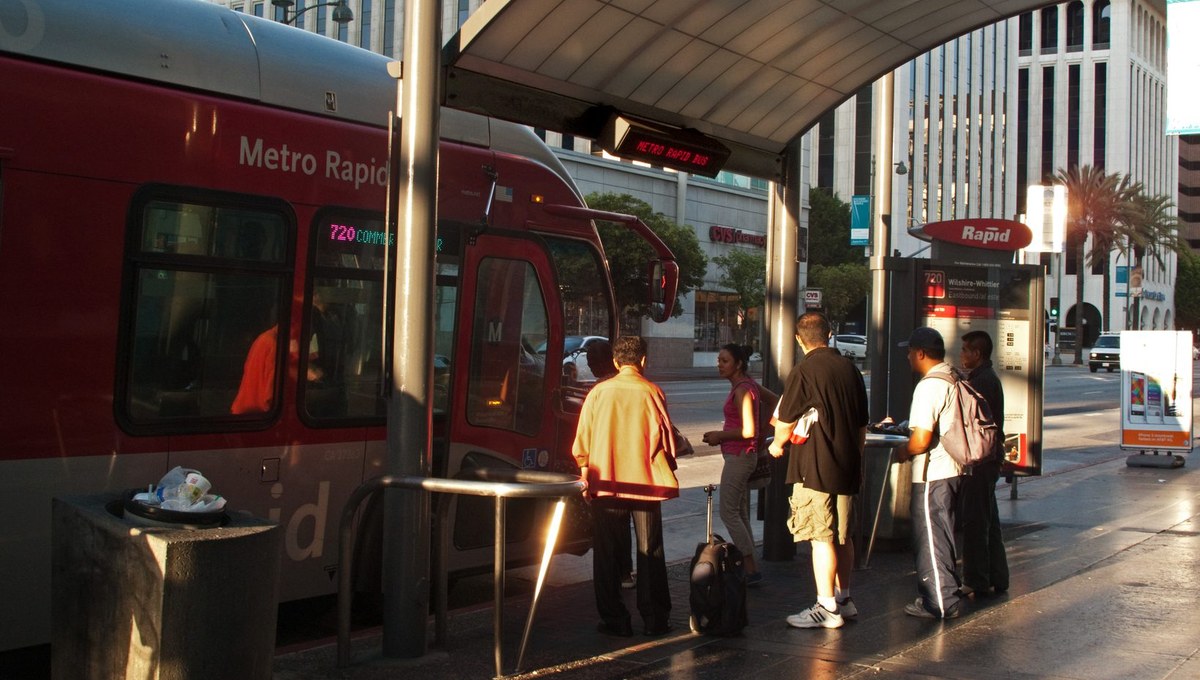 | |
Wilshire is one of the three streets that account for more than three-quarters of the program's tickets. Photograph by Downtowngal, CC BY-SA 3.0, via Wikimedia Commons.
| |
In just its second fiscal year, this program has become an enormous part of parking enforcement in LA. Read the piece →
New map, same intersections
Meanwhile, the city has approved 125 sites for speed cameras, with eight or nine going to each council district. We wanted to see how those locations lined up with the intersections where collisions have repeatedly happened.
Six of the ten intersections with the most reported collisions from 2010 through 2020 are in the Valley. Five of those six have no approved camera site within 400 meters. Citywide, just one of the top ten does.
There are reasons to put a speed camera somewhere besides a busy intersection. These are also historical collision counts, rather than a current measure of how dangerous each corner is. Still, giving every district roughly the same number of sites deserves a closer look when their streets and collision records are so different. Read the analysis →
You can explore it yourself on LA’s Worst Intersections.
About those no-cost Olympics
Los Angeles agreed to host the Games nine years ago. It still doesn’t have a citywide estimate of what hosting them will cost.
LAPD does have an estimate: $1.15 billion for personnel. Equipment is extra. We found no published estimates for what other departments will spend operating during the Games.
Before anyone reads that as a $1.15 billion bill already heading to LA taxpayers, there are some fairly significant qualifications. The estimate includes $290.4 million for regular policing across the city, and the City Administrative Officer has not independently verified the analysis. Federal funding and LA28 reimbursements could cover some costs, but the city’s eventual share remains unresolved.
That leaves LA approving purchases while still working out who will pay for them. We went through the department reports, budget memos and reimbursement agreements to see how far those answers have actually gotten. Read the piece →
And what will it cost to actually go?
In 1932, an opening ceremony ticket at the Coliseum cost $3. Everyone paid the same price. For 2028, prices in that same stadium range from $329 to $5,519, before the service fee.
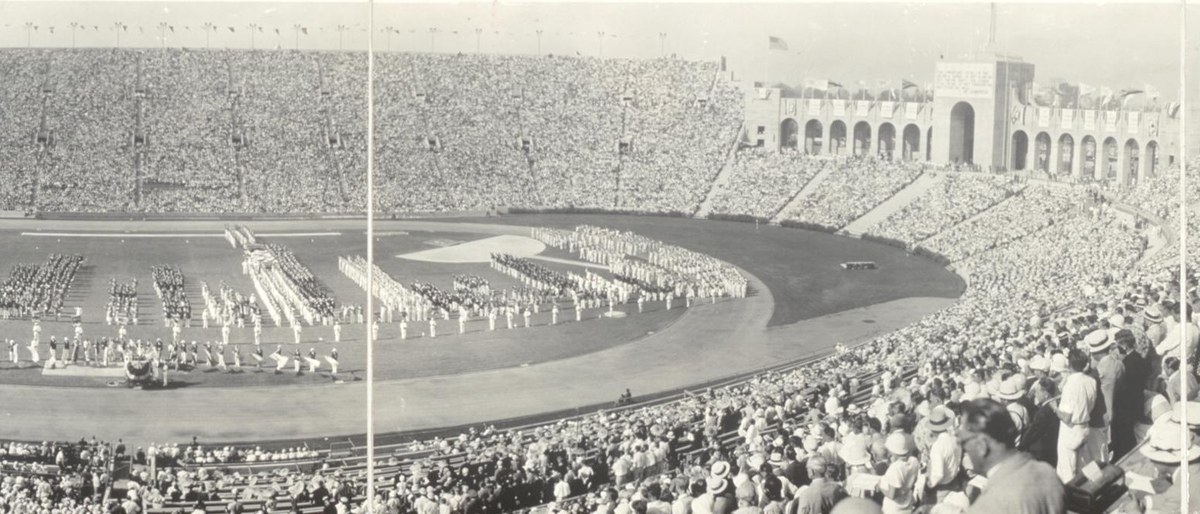 | |
The Coliseum on opening day, 30 July 1932, when every seat in the house cost $3. Photograph by the Organizing Committee of the Games of the Xth Olympiad, public domain, via Wikimedia Commons.
| |
The comparison gets more interesting once you account for inflation. The cheapest tickets at the 1984 Games were actually cheaper than their 1932 equivalents. The middle of the ticket market was cheaper too.
We went back through the 1932 and 1984 official reports to compare all three. The older reports are remarkably detailed! Read the ticket history →
Downtown does the work
Downtown takes up about 1.2 percent of LA’s land. The Census Bureau’s 2023 employment estimates assign it 317,316 payroll jobs, roughly 16 percent of the city’s total. Century City, in second place, has 91,055.
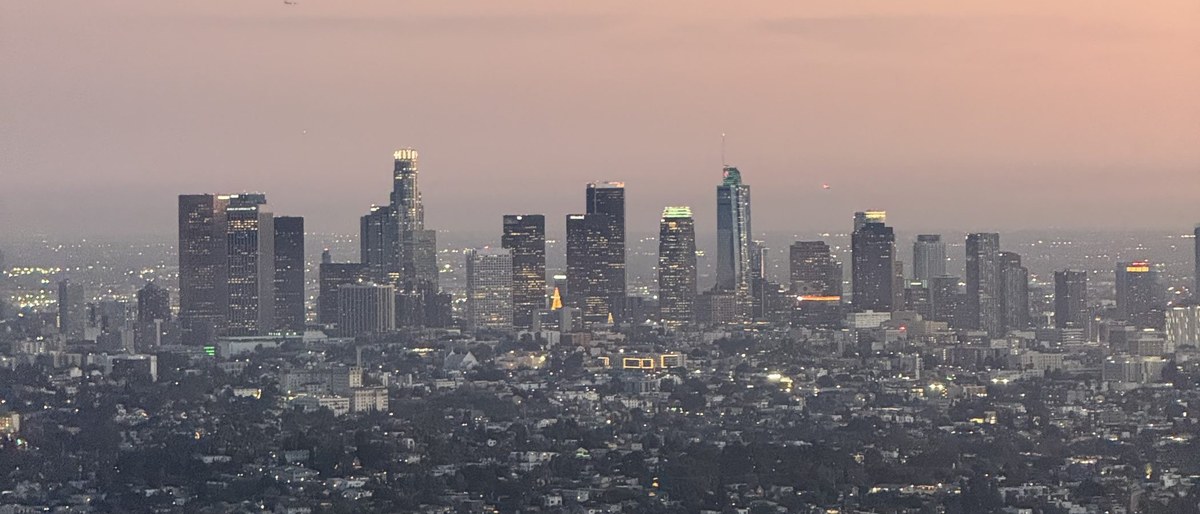 | |
About 1.2 percent of the city's land, and 317,316 of its payroll jobs. Photograph by The Basin.
| |
There’s a catch: employers sometimes report jobs at a central administrative address, which can inflate the count attached to a particular block. We tested several ways of removing those concentrations. Downtown finished first in all six versions.
These records can’t tell us how often people come into the office. But they give us quite a bit to consider alongside the usual conversation about Downtown’s problems. Read the piece →
And how empty is the rest of LA?
You’ve probably heard that LA has more vacant homes than homeless people. That comparison holds in the figures we examined. It also leaves out everyone else struggling to find somewhere to live.
Among the 30 U.S. cities with the most homes, LA’s estimated vacancy rate was the fourth-lowest in 2024. In the separate five-year figures, more than half its vacant homes were for rent, for sale or awaiting occupants.
Getting usable empty homes occupied can help. So can building more housing people can afford. Counting vacancies doesn’t give us much reason to abandon the second while pursuing the first. Read the housing analysis →
New media!
For the aviation folks, 24 hours of LAX operations follows aircraft around the airport using their own position broadcasts.
We also have two ways to watch LA add housing: which neighborhoods are finishing the most homes, and how those homes add up over time. Downtown accounts for a fifth of the 97,914 homes in the series, which starts in 2016.
And on the homepage, Mapping Metro follows transit service from the first bus out to the morning peak.
Keep in touch
The data catalog includes the records behind the reporting, with eight datasets available as free downloads. If you’re a reporter, researcher, campaign or newsroom that needs something specific, write to [email protected].
If someone came to mind while you were reading, forward this to them! A neighbor with strong opinions about Downtown, a friend trying to get Olympic tickets, or someone who has been wondering what those cameras on the bus are doing.
See you in two weeks.
The Basin
basin.la ·
[email protected]