Sundog Bio News | December 2025
Good morning,
As we end 2025, we’re really happy with where Sundog is - and the thinking we’ve done to make a great product for life scientists.
Alex Mitchell | CEO Update
We care how Sundog works, and how people can interact with it, because we believe that work matters. The culture at our jobs and in our workplaces determines, to a huge extent, whether we’re happy or unhappy. Here are some of the ways we are thinking about the work of the researchers who work on Sundog.
Our user model doesn’t define you exclusively through your membership of a lab. Your affiliations to labs and to projects define what you can see, but your user account is yours; when you move labs, you don’t need to make a new account. In part, we chose this model because people collaborate outside of their own labs all the time - that’s one of the reasons Sundog exists. We also chose this model because our users have ambitions and research agendas beyond their current work, and we want to honour that in our product.
Sundog’s users - like all of us - have identities beyond their professional lives as well. We’re building a multiplayer tool, like Figma or Miro, and it matters that our users know with whom they’re sharing digital space. A first iteration of this product could very plausibly have shown only an initial, not an avatar, like you see in our demo videos. But for us, that’s less than a minimum viable product. We’re a tool for collaboration, and the people who collaborate on Sundog deserve to be represented, not just identified, to the people with whom they’re sharing images and insights.
Avatars sound like a small part of our product. But they will change the way people approach and relate to Sundog; they’re a part of the charm and delight we’re building into our product, and I really look forward to seeing how our customers will use them. Our focus on helping trusted teams work together invites our users to have fun with the space. They can use their avatars to talk about themselves; to mark exciting events like a graduation or a new cat, share how they’re feeling via memes, and so on.
We know that we’re not in control of everything that happens on our tool. The Building Slack blog talks about how presence indicators were meant to be useful information, not surveillance, but ended up being used for surveillance at some companies anyway. Similarly, the way people use Sundog will reflect the culture of the lab, as well as shaping it. What we can do is to make sure our belief that work matters shine through in the product decisions we make.
Tom Armitage | CTO Update
This month the tech team have been building on the progress we made in the Stack Viewer last month. I shared that with you via gifs; if you’d prefer to see it at sixty frames a second, or would like a link to share with colleagues, we shared a video of our Stack Viewer over on LinkedIn.
Since then, we’ve implemented filters and adjustments on our layers. Every layer in the Stack now has a control panel like this:
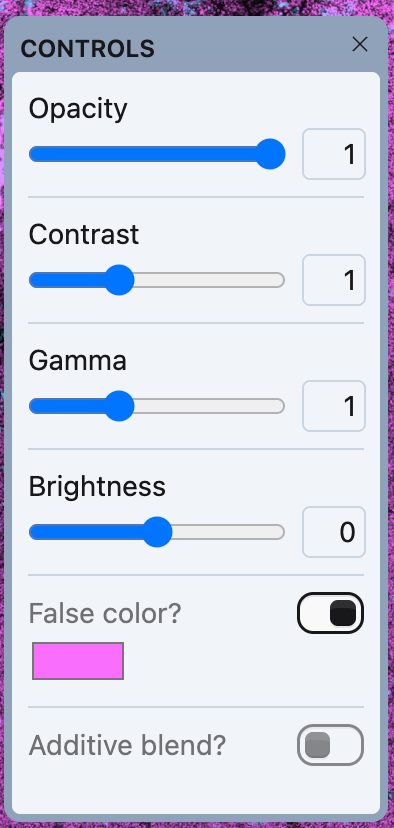
You can adjust the layer, non-destructively, and watch it alter in realtime. But I’m really excited about this for what it enables.
For instance: here’s our mouse tumour stack, with the two layers: one showing the DAPI stain on the bottom, and one showing the CD15 biomarker on the top.
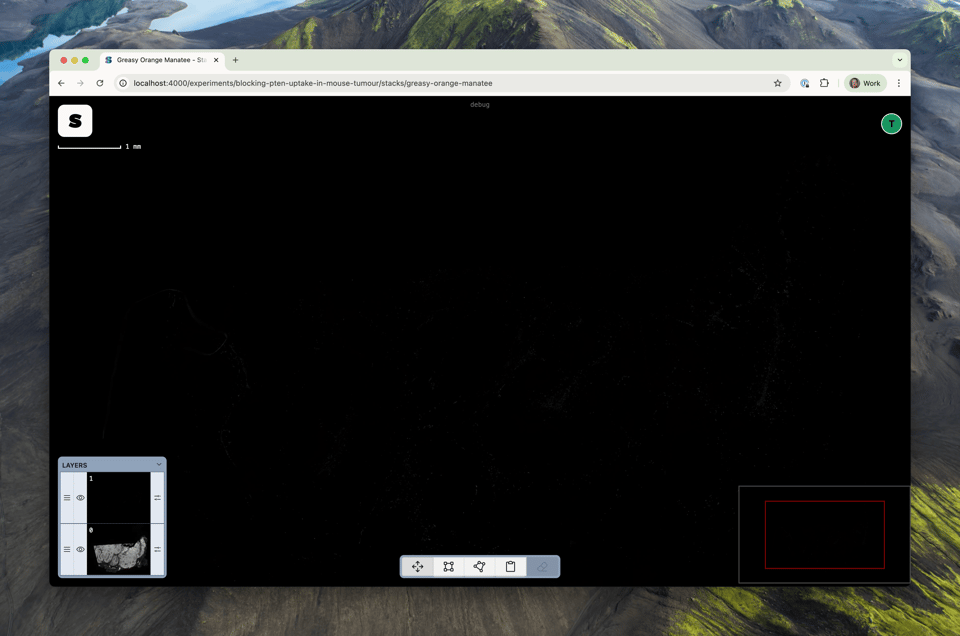
It doesn’t look like there’s much in that top layer. But I can make some adjustments in terms of gamma and contrast, and the biomarker’s expression can now be seen more easily.
What would be great is if we could see how the parts of the tumour that expressed CD15 compare to the tumour as a whole, represented by the DAPI stain.
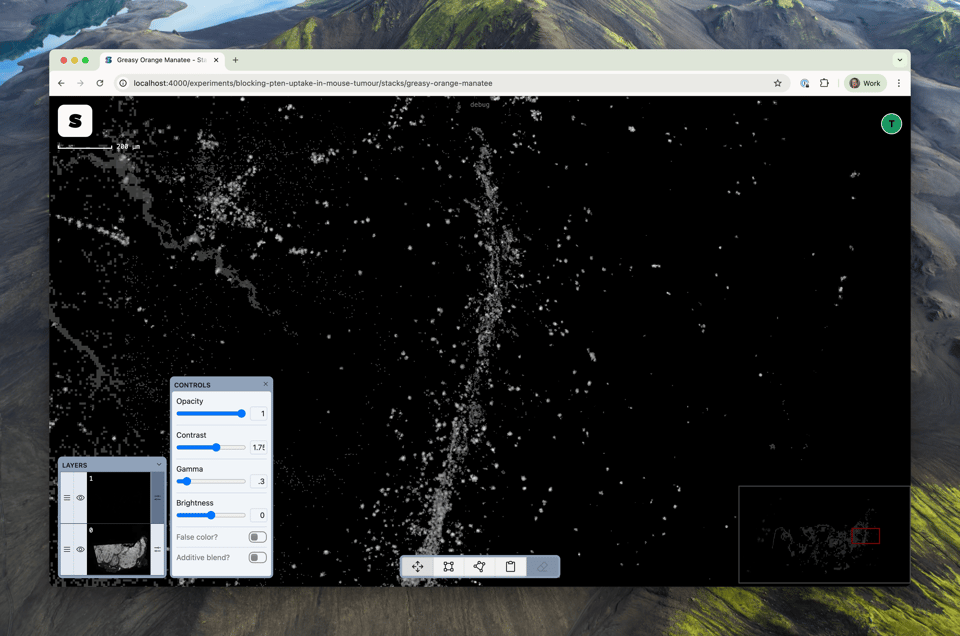
First, I’ll disable the top layer, and false-color the DAPI layer pink:
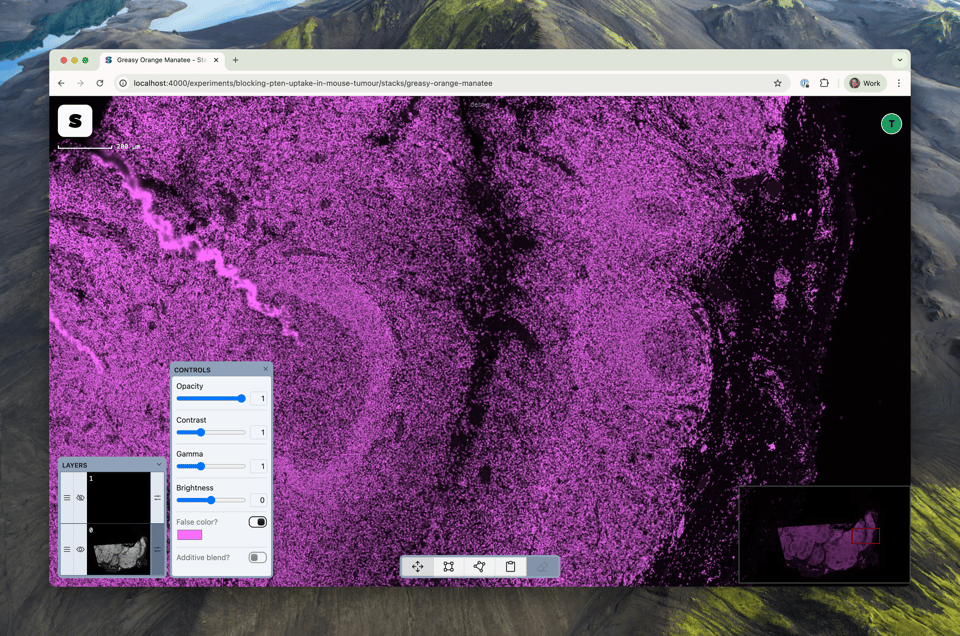
Then, I’ll enable the top layer, set its false colour to cyan… and enable additive blending: this adjusts a layer such that a full-black pixel is completely transparent, a full white one is completely opaque, and in between, we use the average intensity of the pixel to calculate its opacity. But it’s easier to visualise:
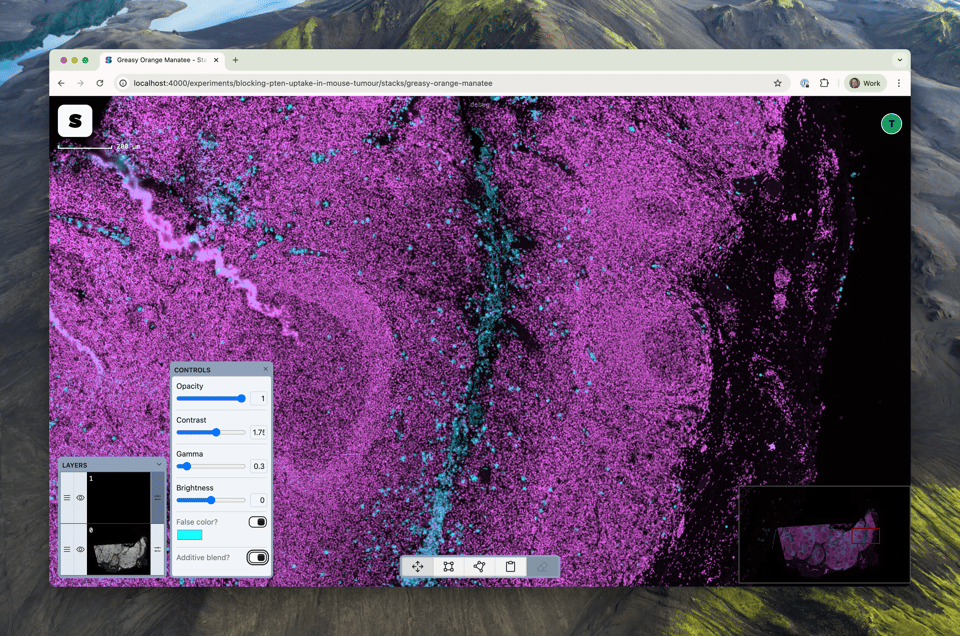
The DAPI layer is pink; where CD15 has expressed, we see blue - and now we can more easily compare the layers. Finally, as an added bonus: it’s now one-click to get a copy of the imagery you’re looking at (without annotations) to either your clipboard or a file on disk. Even as we build out large features, there’s still been space for ‘plussing’ of the product as we go.
Now, this is all technically cool, but it’s more important to me that this is the kind of feature that turns StackViewer into a tool you can do work with. It’s now possible to compare multiple layers with false-color to understand how different biomarkers have expressed, and annotate and discuss that with colleagues.
Or, to use a real world use-case from one of our advisors: you could take an image, overlay the visual output of different cell segmentation programs, toggling between them, or using false color to highlight the differences between each modeloth, and discussing those results with your lab colleagues: all in your browser, in realtime.
Sundog is tipping over from being a minimal product to being a minimum viable product. Not just a proof of concept or a tech demo; a place where real scientists can do their genuine jobs. Sundog is, very deliberately, a focused collection of tools. Rather than building every feature an image-editor could have, we’re focused making just what scientists need - and making it both straightforward and delightful to use.
With viability emerging, that means it’s time to share Sundog with people. We want to launch to alpha customers in Q1, but before that, we’d like to evaluate it with real scientists. So we’re working with a user researcher to do some early studies with target users in January, and then building what we learn there into our initial release.
We’re all looking forward to seeing how real users - both in our UX studies, and our customers - use Sundog. Thank you for following along with us as we build and think; we’re always happy to hear from you as well. Just reply to this newsletter, or email alexandra@sundog.bio.