
You can't ask an agent to log itself
No vendor sells a per-developer view of what your AI agents cost across vendors, so I built one. A coding agent will not log itself, so the capture path sits outside it: a fire-and-forget hook that never slows the agent, identity derived by hashing observable facts, and one schema every vendor lands in. The payoff is org-wide AI accounting: the real cost per shipped commit or verified task.
When an engineer hears "I instrument my agents," they picture application observability: add a logging library, emit a span at the top of each request, ship the traces, read a dashboard. That model is decades mature and it is correct for software you wrote, because software you wrote cooperates — you own the call site, so you put the probe there.
A coding agent gives you none of that, for one uncomfortable reason: you can't ask an agent to log itself. It is a vendor's binary running a vendor's model behind a vendor's API, exposing only the surfaces the vendor chose. It will not emit your span or carry your trace ID, and when it spawns a subagent that child is born and dies outside your instrumentation, leaving only a transcript written after the fact and a line on someone's bill. The thing you most want to measure is the thing least willing to be measured.
I have written that you cannot improve what you cannot measure. This is the post about earning the right to that sentence — first by building a way to measure agents that will not measure themselves, then by using it. The build is the first half. The second half, the part I promised to write up when I open-sourced wood-fired-tasks, is what the instrument turned out to be good for.
Five surfaces, no view
Count the AI surfaces in one of my days. Claude Code's main thread. Its subagents, more of them in an hour than I type prompts. A Codex session and a Gemini session for second opinions on sensitive changes. A local model on the LAN box draining cheap work while a frontier model grades. Five producers, three vendors plus my own hardware, on one machine.
Every vendor shows me my usage — inside its own walls. None can see across the fence to the next, and none knows the thing I actually care about, which is not "how many tokens did Claude burn" but "what did the work cost, end to end, across whichever models touched it." That cross-vendor, per-developer view is structurally not for sale. You build it or you fly blind, and for a long time I flew blind and told myself the billing pages were enough. They were not.
Capture that never gets in the way
One constraint swallowed the others. The capture code sits on Claude Code's hook path — it fires on every tool call. If it is slow, my whole day is slow; if it throws, the agent inherits the error. The first time telemetry is the reason a session hangs, I rip it out, and so would you. A tool that degrades the thing it observes does not get a second chance.
So the design splits in two. On the hot path is a tiny native binary whose only job is to read the hook payload, hand it off, and exit — fast, swallowing every failure it can meet, because the contract with the agent is absolute: it never sees an error that came from my telemetry. Behind it sits an ordinary background service that does the slow work — walking transcripts, rolling up tokens, writing to the database — safely off the critical path. And fail-open means more than failing quietly: when the background service is down, the hot path spools its data to disk and the service drains it on the way back up. The agent never waits; nothing is lost; an outage becomes a delay.
How do you attribute a token to a developer when the agent won't tell you?
You compute identity instead of assigning it: hash the stable facts you can already observe — working directory, session ID, subagent type, agent ID — into a deterministic per-context ID. No registry, no lookup, no I/O. Two processes that see the same context derive the same identity independently, and the agent can neither spoof it nor pay for it.
Capture is the easy half. The hard half is the title made concrete: when data lands, who produced it? The agent did not say. Claude Code hands my telemetry no stable per-developer identity, and none at all for the anonymous subagents it spawns and reaps inside a single prompt. To attribute a token to a context I have to derive the identity from the outside, with no cooperation from the thing I am identifying. The trick is to compute identity, not assign it — a hash of the stable facts I can already observe:
main:     hash("main|"     + workingDir   + "|" + sessionId)
subagent: hash("subagent|" + subagentType + "|" + agentId + "|" + sessionId)
No registry, no lookup, no I/O — a pure function from observable facts to a stable ID. Two different processes that see the same context compute the same identity independently, with nothing shared to coordinate through. The agent cannot alter it, cannot spoof it, and pays nothing for it. That same discipline carries the rest of the system: when the start and stop events for a subagent arrive out of order — which they do, because they come from separate processes the OS schedules as it likes — the stop handler does not depend on a prior registration at all. It reconstructs what it needs from the subagent's own transcript, and flags the gap when even that is missing. You instrument an uncooperative subject the way you design a protocol for a lossy link: assume the message you needed is the one that got dropped, and recover without it.
The agent that turned the logger off
None of this arrived clean; the shipped tool is the residue of its own incidents, and the best one names the whole post. A late-May outage took my dashboards dark for twenty-six hours before I noticed, because a dead capture service looks exactly like a healthy one with nothing to report. The first fix made the gap visible — a heartbeat, so "fine and quiet" and "gone" stop being the same picture. It did not make it stop happening.
When I traced the root cause, it was the most on-the-nose thing the system has ever done to me. The service had not crashed — it had been cleanly disabled by a systemctl --user disable issued from inside a Claude Code session. The agent, doing some unrelated housekeeping, had reached out and switched off the instrument watching it. You can't ask an agent to log itself, and you cannot trust it not to turn the logger off, because it does not know the logger is special — to the agent it is one more service in a list. So the heartbeat that made the absence visible got escalated into an external watchdog that makes it recoverable, treating "running and enabled" as the only healthy state and restoring anything short of that on its own. The instrument has to be able to resurrect itself, because the thing it observes has both the means and the motive to bury it.
What the instrument is for
Everything to here was plumbing, and plumbing is not the point. Once every vendor's traffic lands in one schema — normalized so models that name their fields differently line up, pseudonymized so the data is groupable without being personally legible — you can finally ask questions nobody could answer before. Three of those questions turned into things I now use.
Accounting an organization can actually read
The first is the most boring and the most valuable, which is usually the same thing in infrastructure. The same schema, skinned for a fictional company, becomes the per-developer AI ledger no vendor sells. Below is my own month of real cross-vendor telemetry mapped onto an invented org chart — three departments, six projects, a roster of engineers — so the rollup behaves like one a finance team would actually read.
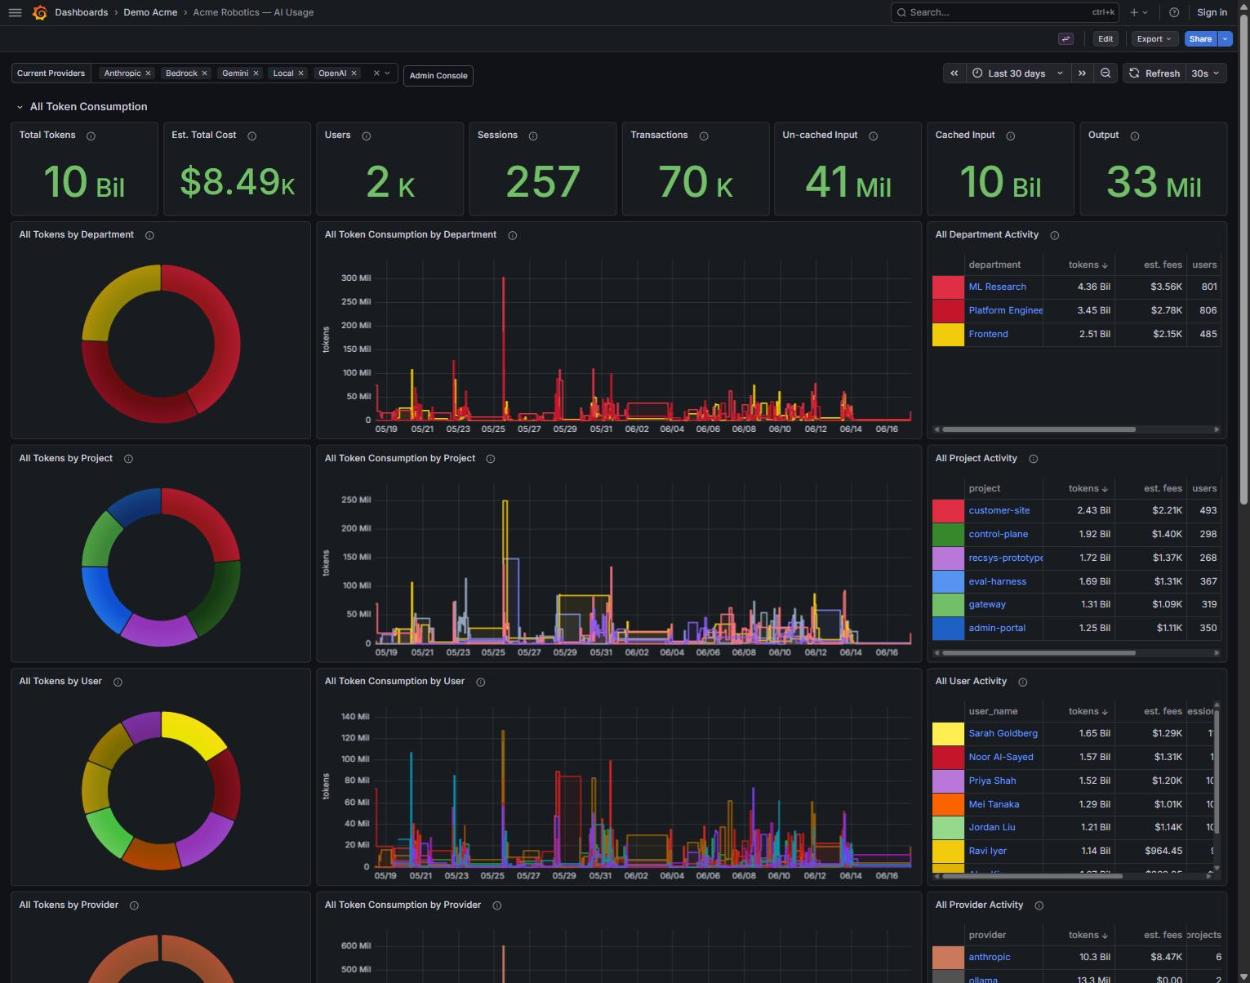
A CFO knows the AWS bill to the dollar; almost nobody can tell you the AI bill the same way, let alone which team or which person or which project drove it. This is the artifact at the center of the broader agent observability and governance discipline — the per-developer, per-provider ledger a compliance or finance team can read when disclosure rules stop letting "we don't really track that" be an answer. This view answers that — $8.49K across the month — and the shape of that figure is itself the lesson. Of the ten billion tokens captured, all but about seventy-four million are cached reads, billed at a fraction of list; the bill is driven almost entirely by that thin slice of full-price input and output. Anthropic is the cost driver, while the local model carries thirteen million tokens for free. The rest of the point is the structure: you start at the org, drill to a department, then a user, then a single session, then the exact prompt that ran, and the pseudonymization holds the whole way down — so an org gets accountability without surveillance. This is the artifact I show when someone asks what the telemetry is for: the cross-vendor cost-and-usage picture their finance and security teams have been asking for and their vendors cannot provide.
The real number: cost per shipped unit of work
Tokens are a vanity metric, and everyone who has stared at a usage graph knows it. The question a business actually has is not how many tokens an agent burned but what it got for them. Because every git commit rides the same pipeline as a telemetry event — branch, insertions, deletions and all — and every closed task in wood-fired-tasks is keyed to the same session that produced it, I can divide spend by output: dollars per commit, dollars per verified task, for any window, person, or project.
Two corrections made that number honest. The first was time. The capture path drains its backlog in roughly ten-second bursts, so a ninety-second run with nine subagents first showed up as ten seconds of work; I had to derive true duration from the event-side timestamps written in real time rather than from when the rows happened to land. The second was generation versus context: well over ninety-nine percent of all tokens are cache reads — the agent re-reading context it already paid for — and only the output tokens are the actual work. Measure "tokens" without splitting those and you are measuring noise. Once both were fixed, every session could be priced against what it shipped, which is the only token number a manager should ever be shown.
Can you just ask the data why?
Yes — that is the third application, and the one that changed how I work. I built a telemetry MCP server so I can put questions to the analytics database in plain language instead of hand-writing SQL against it. The example that earned its keep: I had a hunch that draining a task DAG in parallel might deliver a batch as well as running a full GSD milestone, the phase-gated autonomous workflow I had relied on for months. Rather than argue it from taste, I asked the data — seventy thousand API calls across three hundred sessions — and it answered cleanly. Per token generated the two approaches cost about the same. But a scoped DAG project landed five-to-twelve times cheaper in absolute dollars and roughly an order of magnitude faster: a complete twenty-seven-task project verified in 1.7 hours for $118, against a milestone spread over five days for $1,480.
The cause was right there in the same data. A GSD milestone is one long-lived orchestrator that re-reads its entire accumulated context every turn — around 780 million cache-read tokens for a single milestone — while the DAG fans the work into short-lived parallel subagents with small fresh contexts, about eighteen times less. I did not switch my batch-delivery workflow on a feeling. I switched it because the instrument I had built to watch myself told me, in dollars and hours, which approach was wasting both. That is the loop I run on validation pointed at my own economics: measure, see the pattern, change the practice, measure again.
There is a recursion here I have come to like: the tool measures the exact workflow that built it, every scaffolding commit sitting in the same table as the commits I made yesterday, each one co-authored by the model that wrote most of it. That is the whole thesis in one artifact. The way to work with agents at this volume is to stop treating them as collaborators you converse with and start treating them as a workforce you instrument and hold to evidence — which you cannot do by asking them to report on themselves, and cannot improve until you can see it. You build the thing that watches from the outside, assumes no cooperation, and never gets in the way.
If your team runs agents across more than one vendor and your only view is a stack of billing consoles, you cannot yet answer what your AI costs, who is driving it, or what you are getting for it — and you can't fix any of that until you can measure it. Building that measurement, and then turning it on your own practice, is the work I am most convinced matters as the industry crosses from talking to agents to managing them.
Companion posts: how I stopped reading the code, the validation loop this telemetry feeds, and stop talking to your agents, the same fail-open instinct one layer down in the compiler.


Add a comment: