One click “Open in Rowboat,”thematic maps in two clicks, and finding your soulmate in three
This email is about Rowboat, our tool for instantly making sense of very large datasets. You're on this list because you tried out rowboat.xyz, but feel free to unsubscribe if you're not interested. We don't like receiving unwanted email either! And for those of you sticking around, our small team appreciates the support. We hope you enjoy this update on our progress from Ellory. —Ben Fry, Fathom
This week marks the one year anniversary of the launch of Rowboat.
We’re celebrating — but we’re also working hard on a fresh set of updates and new features for the year ahead. In the meantime, we wanted to share a few recent improvements we’ve made to Rowboat heading into our Sophomore year.
Who doesn’t love maps?
In the United States, there are 31 states that have a Washington County. 26 have a Jefferson County, 25 have a Franklin — the list of duplicate county names goes on. Mapping geographic data is one of the easiest ways to understand it, but an individual column of county data can be pretty meaningless without an associated state.
In the spirit of accuracy—and simplicity—Rowboat now has a straightforward way to connect state and county columns.
In this dataset that tracks all of the dams in the United States, we have both state and county information for each dam. By clicking “Select a state column,” you will see a list of all columns in your dataset that are likely to contain state information. Just choose the best fit, and you’ll have a county choropleth map ready to go!
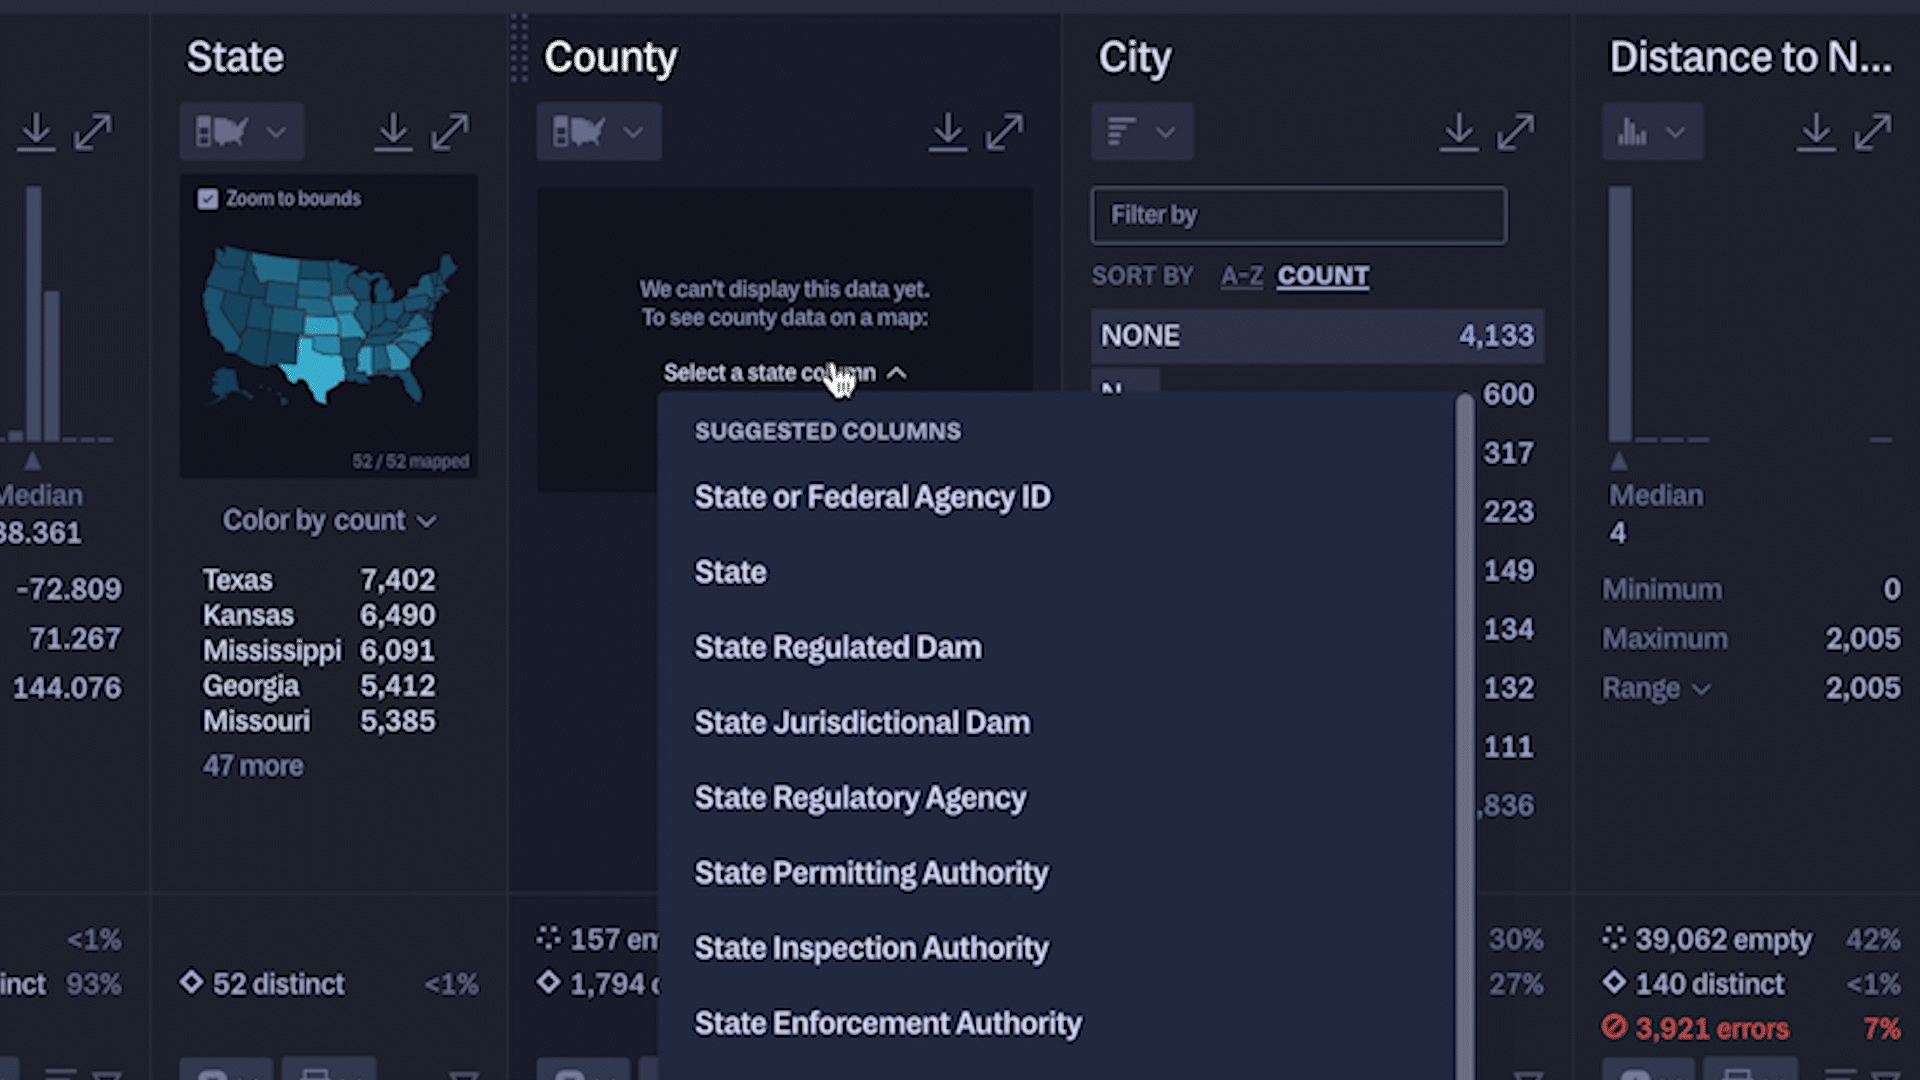
Or, if you know all your data comes from a single state, you can opt to “choose one state” instead.
While we had maps on the mind, we also made some adjustments to how we show map coordinates.
A round of visual refinements has made it even easier to spot areas of map where data is more concentrated. Here, we’re looking at coordinates of major world cities and seeing bright hotspots of densely populated areas.
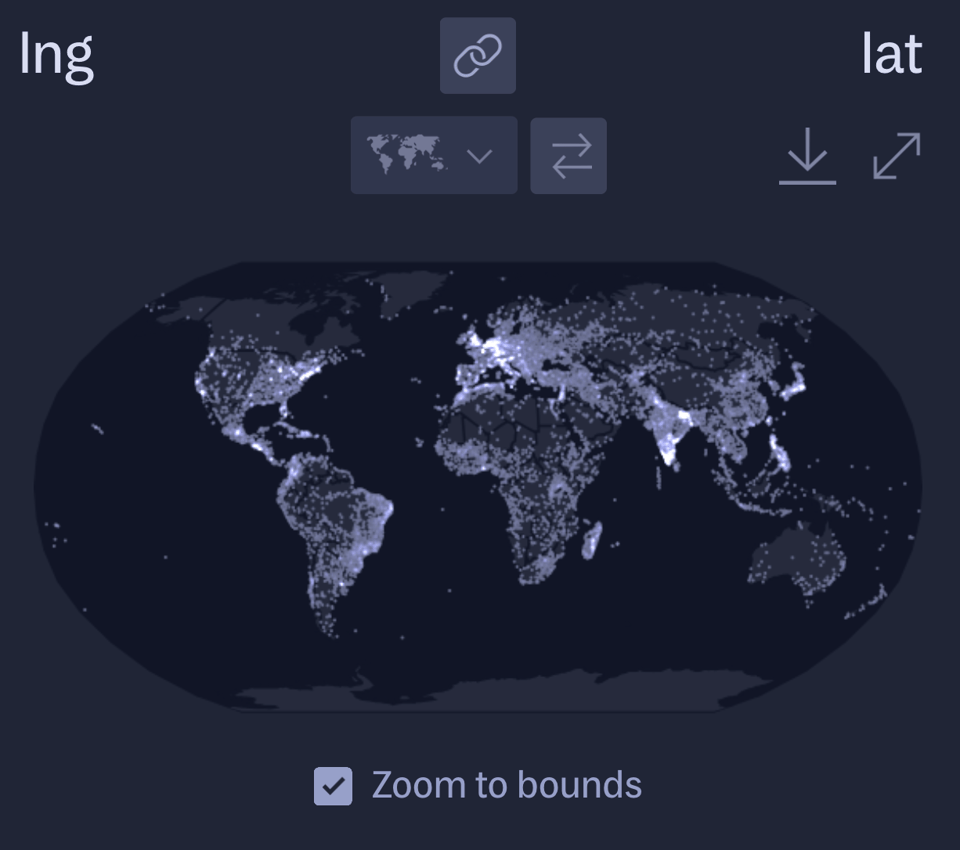
Our “Zoom to bounds” feature, also helps you focus on a specific subset of coordinates and explore regional patterns.
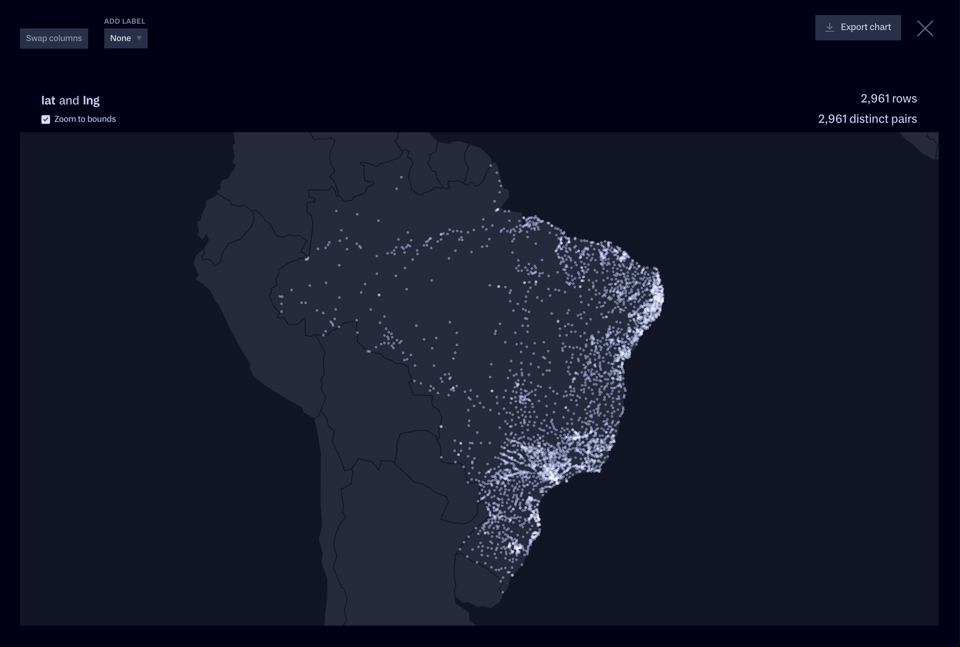
Once we filter down to Brazil, we can expand the map and see the country in more detail.
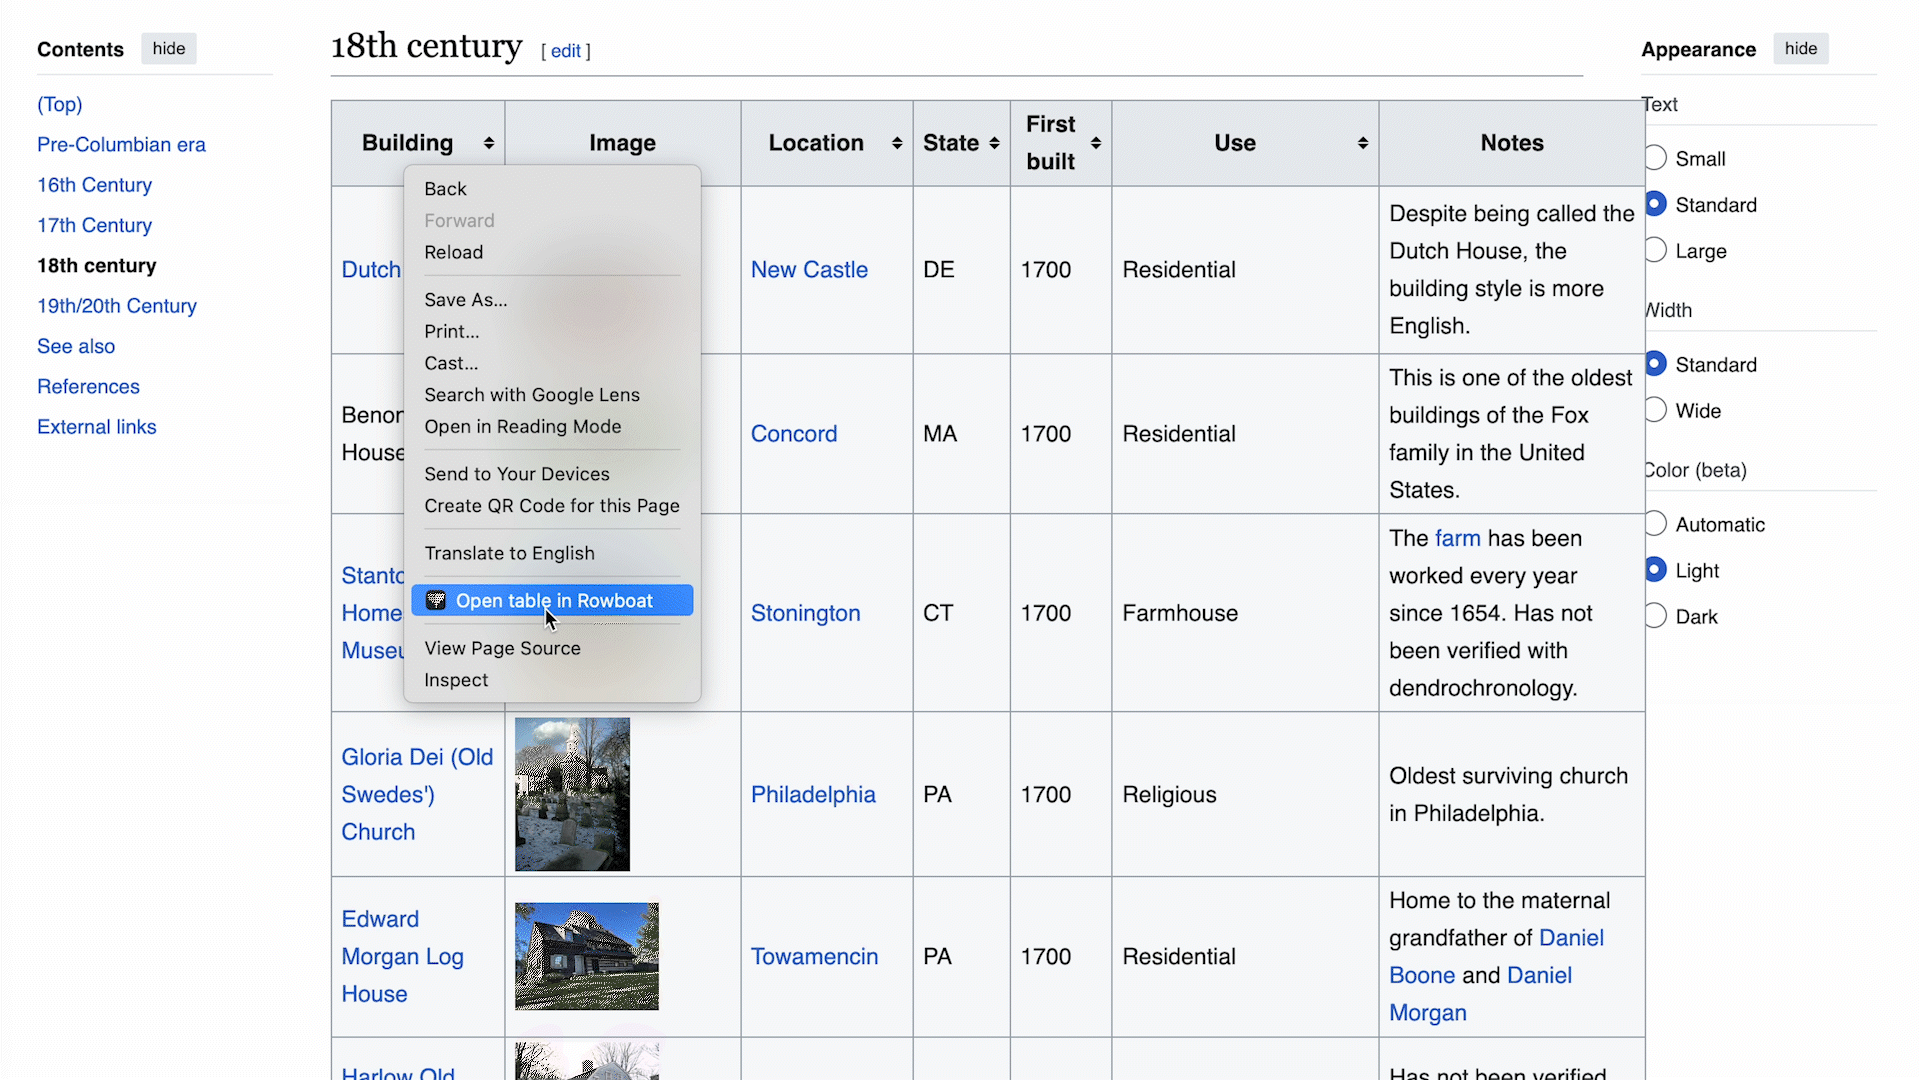
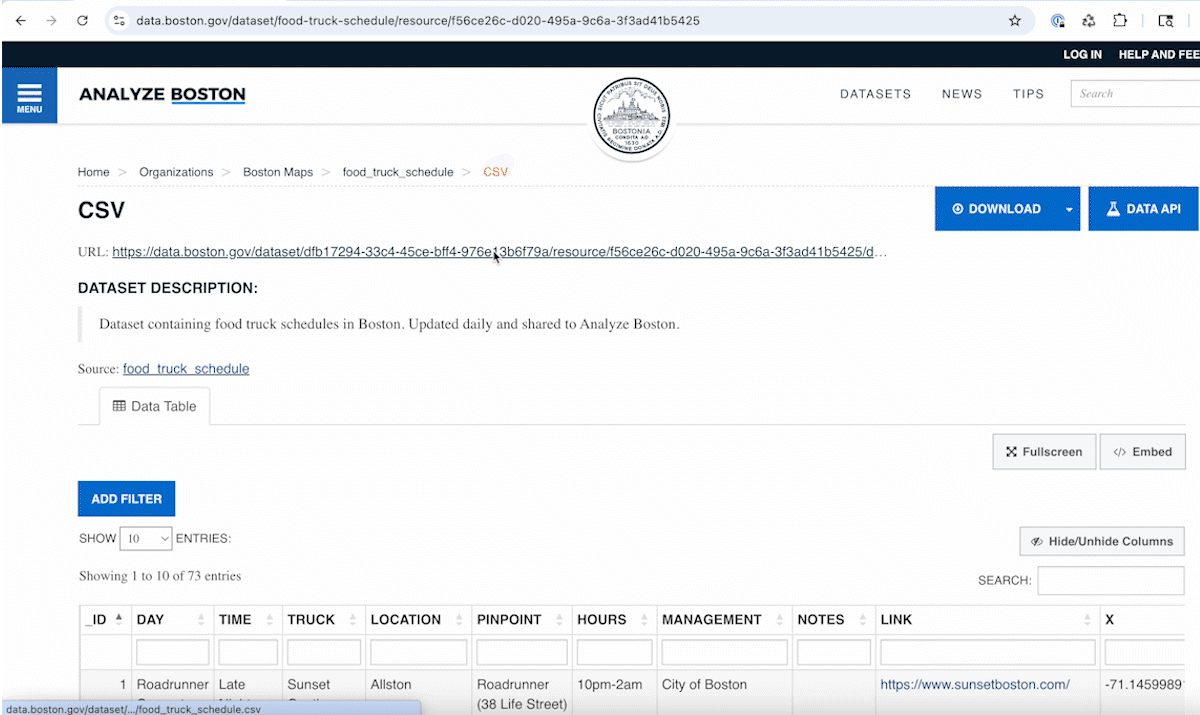
We updated our browser extension to open HTML tables and links to spreadsheets with just a right click.
We already had a browser extension that immediately loads data from Google Sheets into Rowboat. But now we’ve expanded it so that any link to a .csv, .tsv, or .xls dataset can be opened instantly.
Next, we went another step further and made it possible to load any HTML table from any site. HTML tables — such as those found on Wikipedia — may include basic features like sorting, but are not designed for deeper investigation.
With the Open in Rowboat browser extension, just locate the table you want to examine, right click, and select “Open Table in Rowboat” to start exploring.
And here’s what right-clicking a link to a dataset looks like:
You can install the Chrome browser extension here. For those who don’t use Chrome — Firefox and Safari extensions should be arriving in the coming weeks!
Some new ways to filter.
A big part of data exploration in Rowboat comes from applying (and removing) filters to see what different subsets of your data look like.
One of my all-time favorite datasets looks at the profiles of around 60k OkCupid users in the Bay Area in the early 2010’s — it’s extremely fun to filter down on the collection of profiles column by column to find your soulmate (or anti-soulmate) in the dataset. You can clear any filter at any time, and use the undo and redo buttons to quickly toggle between recent filter states.
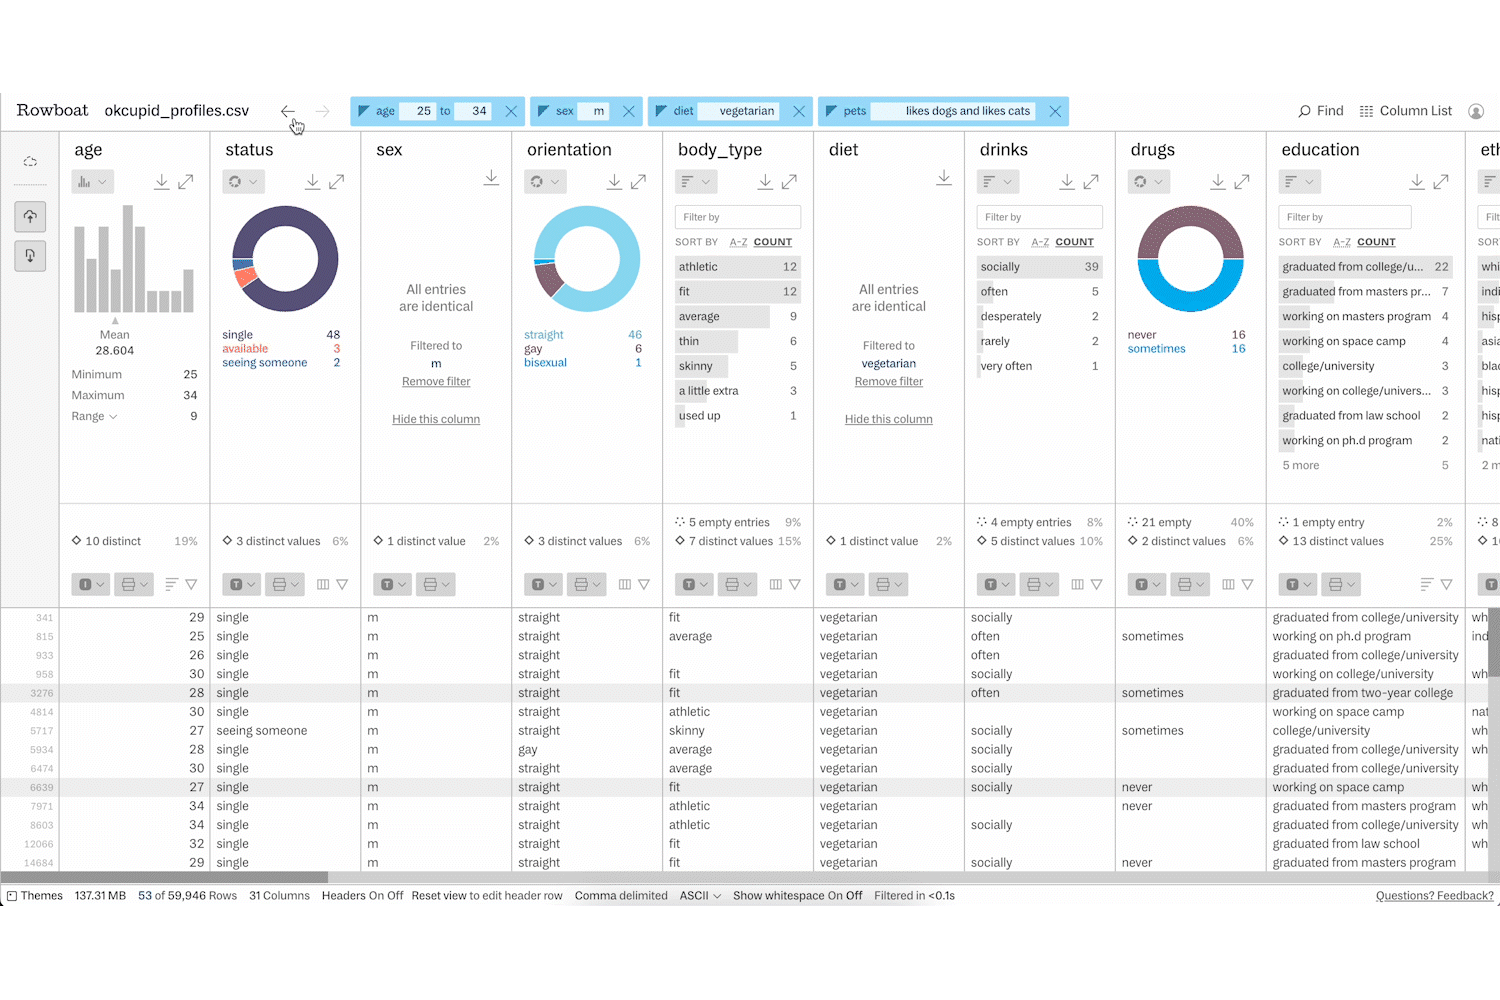
We also made it simple to find and filter within a single column when a global search doesn’t narrow things down enough.
Looking at this collection of UFO sighting reports from around the globe, we might want to see how many of these sightings took place on the Fourth of July — particularly those sightings that were shaped like "fireballs."
To filter down to July 4th across all years, you can go to the Find tool in the upper right and apply a "7/4" filter to just the “datetime_time” column, which contains the date each sighting took place.
 Immediately after applying these filters, it’s clear that all these sightings took place in the United States and southern Canada — shocking!
Year two!
We have a lot planned for Year Two of Rowboat, and we hope you’re as excited as we are to see what’s next. We’ll keep you posted on any new features, refinements, and announcements in this newsletter, but you can also follow us on Bluesky, Mastodon, and Instagram for more frequent updates.
We always love hearing from you about the types of datasets you’re most interested in unpacking with Rowboat and any new features that would help you achieve your data dreams! Have you tried Rowboat? Was it helpful? Did you have trouble? Are there things you would like to see in the tool? We hope you reach out to us at hello@rowboat.xyz and let us know what you think!