preview 648: quantum of sollazzo
Hello, reader!
Quantum #647 had an open rate of 41% and a click rate of 6%. The most clicked link was the CIA Factbook Archive.
A job for you?
The FAIR Station project at the University of California Digital Library are hiring a Product Manager. Salary in the range $120,000 - $140,000, Remote anywhere, providing they can work in alignment with the US Pacific timezone.
'till next week,
Giuseppe @puntofisso.bsky.social
Topical
AI eats the world
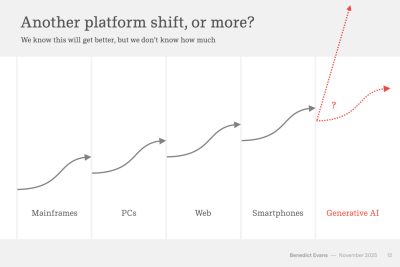
I attended Benedict Evans' keynote at the NashTech Connect conference, which was a 25min version of his biannual "AI eats the world" presentation, which analyzes macro and strategic trends in the technology industry. He's a great speaker, and some of the trends are remarkable – I recommend one of the videos here.
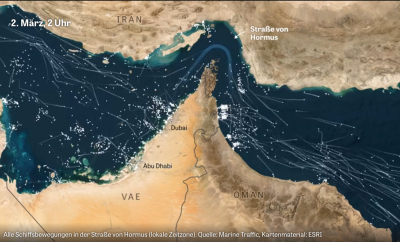
Thus, the war paralyzes the Strait of Hormuz
Original German article ("Straße von Hormus: So legt der Krieg die Straße von Hormus lahm") from Die Zeit, here translated into English. It looks at the closure of the Strait of Hormuz following the US-Israel/Iran war.
The Strait of Hormuz is famous for the energy trade (approximately 20 million barrels of crude oil pass through it daily, which is about 20% of world demand).
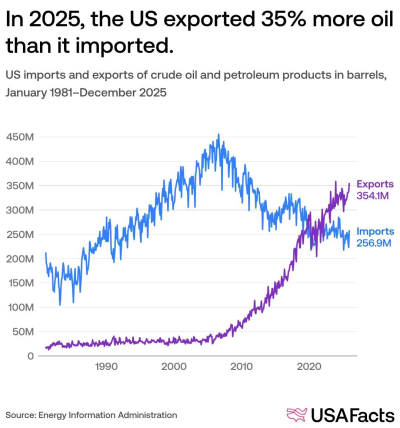
Is the US a bigger oil importer or exporter?
USAFacts: "The US has been exporting more oil and petroleum products than it imports since August 2021."
Petroleum products comprised 63% of exports, while crude oil imports are dominated by Canada (at 57% of all petroleum imports).
Jane Street depends on all sorts of messy, real-world data to understand financial markets and the global economy: think world news, decades of weather patterns, deidentified credit card spending, or packet captures of stock exchange market data feeds.
We're hiring Data Engineers to turn datasets like these into reliable inputs for trading. Working closely with our researchers, you'll evaluate unfamiliar datasets, build robust ELT pipelines, develop deep domain expertise, and decide what's worth exploring next.
The job requires a mix of engineering, data analysis, and product sense. If you love the detective work of investigating a weird dataset and figuring out what it actually means, we want to hear from you. No financial background is necessary.
We have openings in New York, London, and Hong Kong.

Tools & Tutorials
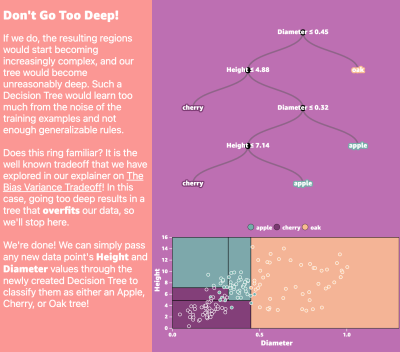
Decision Trees
"Decision Trees are supervised machine learning algorithms used for classification and regression problems. " Explained in a brilliant scrollytelling.
Go is the Best Language for AI Agents
Bruin's founder Burak Karakan argues Go is ideal for AI agents. Among several reasons, he's right that there's a lot of training and docs out there, which have made LLMs particularly good at it.
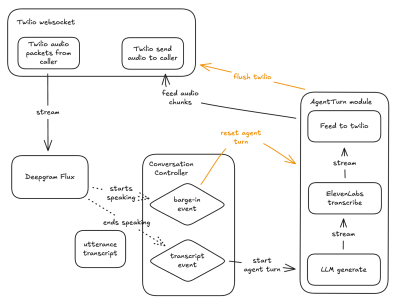
How I built a sub-500ms latency voice agent from scratch
Nick Tikhonov built a custom voice agent orchestration layer from scratch that achieved ~400ms end-to-end latency, outperforming Vapi's equivalent setup by 2× (~840ms). The project took approximately one day and $100 in API credits.
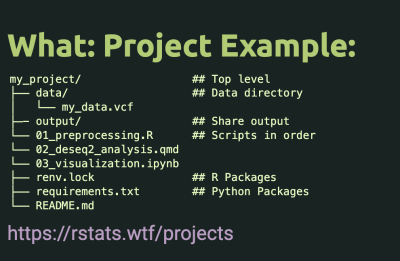
Making Code Ready for Publication
A workshop teaching researchers how to prepare their code and analyses for publication. The slide deck is available.
It also highlights that reproducibility exists on a spectrum and perfect reproducibility shouldn't prevent sharing good work.
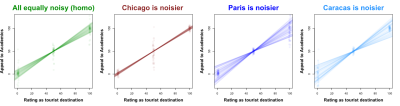
Heterofriendly: The Intuition for Why You Always Need Robust Standard Errors
"Psychologists basically never use robust standard errors.
But they always should.
Economists basically always use robust standard errors.
But I suspect intuitive understanding lags behind adoption."
Robust standard errors address heteroskedasticity (uneven noise), where some data points are noisier than others.
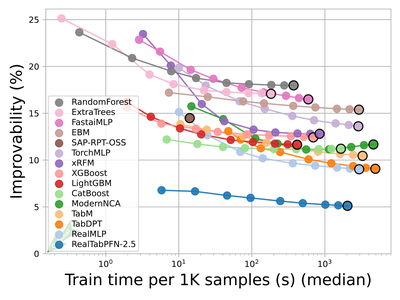
Is Boosting Still All You Need for Tabular Data?
Michael Clark: "An update on the state of deep learning for tabular data, featuring practical model implementation." Modern deep learning models now compete with gradient boosting methods like XGBoost, LightGBM, and CatBoost, and new benchmarking frameworks like TabArena provide standardized evaluation.
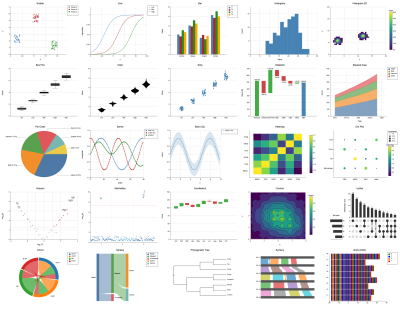
kuva
Kuva is a scientific plotting library written in Rust that supports 25 plot types with SVG output and optional PNG/PDF backends.
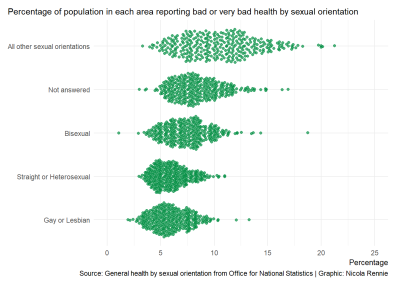
Interactive beeswarm charts in R
Nicola Rennie explores beeswarm charts. This tutorial demonstrates creating interactive beeswarm charts in R using UK census data on general health by sexual orientation.
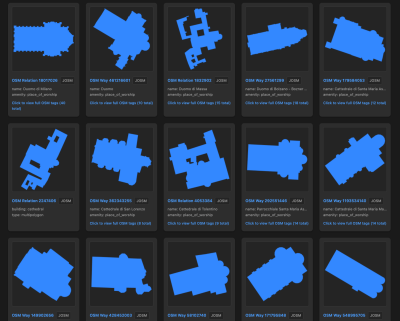
XofY OSM Geometry Viewer
This is brilliant: a web-based tool for viewing and analysing OpenStreetMap (OSM) geometries with multiple data input options including curated features, custom Overpass queries, and GeoJSON file imports. The picture below are cathedrals in Italy.
(via Geomob)
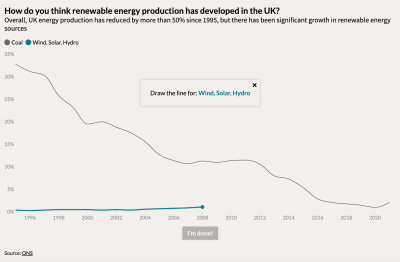
Draw The Line: introducing a chart type that invites you to participate
Flourish has launched a new "Draw The Line" template for interactive, guessable line charts. It was inspired by the New York Times' "You Draw It".
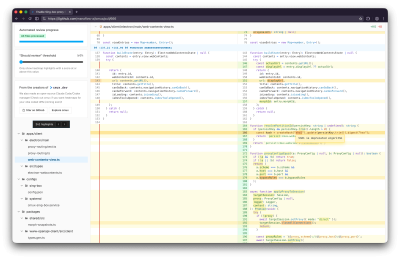
A heatmap diff viewer for code reviews
"Heatmap color-codes every diff line/token by how much human attention it probably needs. Unlike PR-review bots, we try to flag not just by “is it a bug?” but by “is it worth a second look?” (examples: hard-coded secret, weird crypto mode, gnarly logic)."
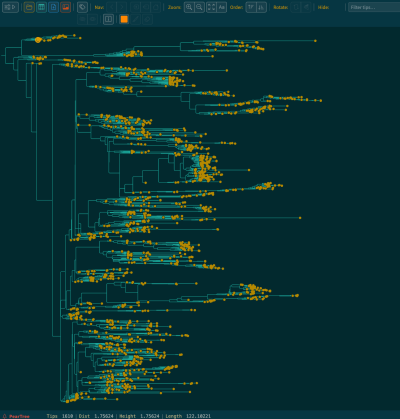
PearTree: A Phylogenetic Tree Viewer
PearTree is a specialized software tool designed for viewing and analyzing phylogenetic trees, diagrams that represent evolutionary relationships between different biological species or other entities (someone asked in the AMA section about genealogy a few weeks back, maybe this could hep).
A Few Claude Skills for R Users
R Works: "The community has come together to create some great Claude Skills that you can try out today."

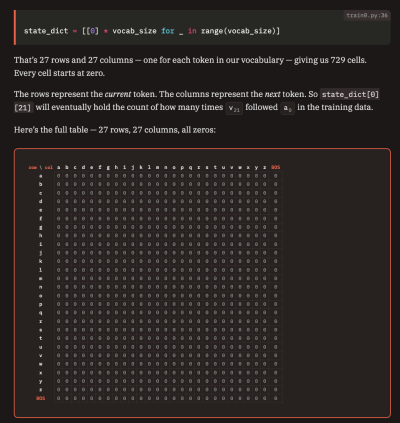
MicroGPT Visualized — Building a GPT from scratch — an interactive visual guide
Andrej Karpathy's MicroGPT is a single Python file implementation that builds a GPT transformer from scratch using only pure Python and basic mathematics, without external libraries or frameworks. "This tutorial goes one step further: we break each of Karpathy’s steps into substeps, and explain each one with diagrams, animations, and interactive visualizations. By the end, you’ll understand every line — not just what it does, but why."
Data Thinking
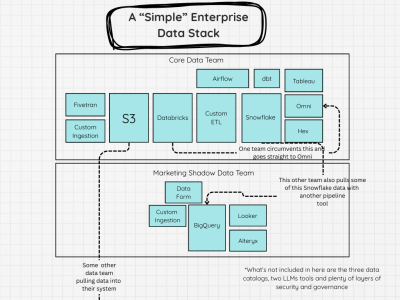
Layer by Layer, We Built Data Systems No One Understands
Modern data systems have become too complex through endless layering of tools, platforms, technologies, etc.
Dataviz, Data Analysis, & Interactive
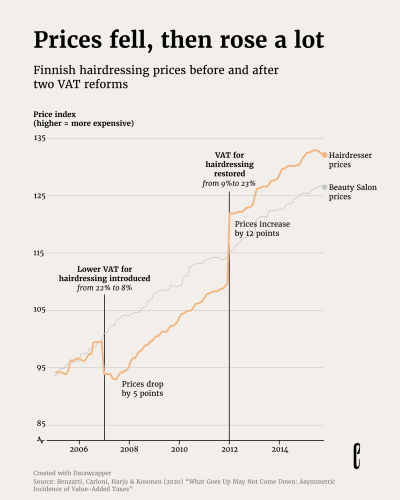
What the price of your haircut says about your economic power
The story about Finland first reducing, then increasing VAT on barbering services created a remarkable situation. Just look at the chart below!
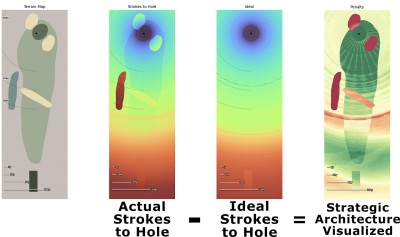
I Spent the Last Month and a Half Building a Model that Visualizes Strategic Golf
"A way to actually see the ideas hidden in golf course architecture", using heatmaps.
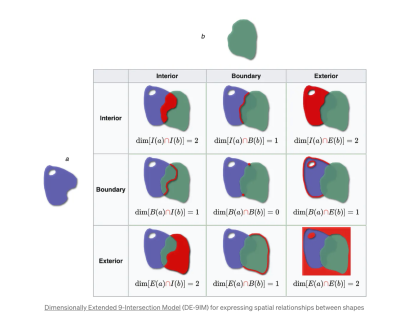
Weeknotes, 2026W04: Boundary Issues
"Boundary disputes are a major but little-known challenge in mapping".
Indeed, and one of the staples of my public speaking points is the little known 200+ years (and counting) border dispute between Italy and France on the top of the Mont Blanc, and how it affects authoritative data.
(via Geomob)
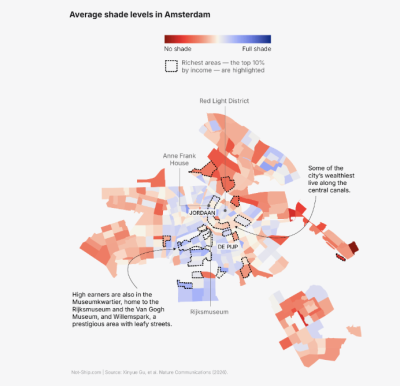
Looking for the rich? Check in the shadows.
A study from MIT's Senseable City Lab analyzed shade coverage and income levels across nine global cities (Amsterdam, Barcelona, Belém, Boston, Hong Kong, Milan, Rio de Janeiro, Stockholm, and Sydney). "In nearly all nine cities, shade was a privilege of the wealthy."
(via Not-Ship)
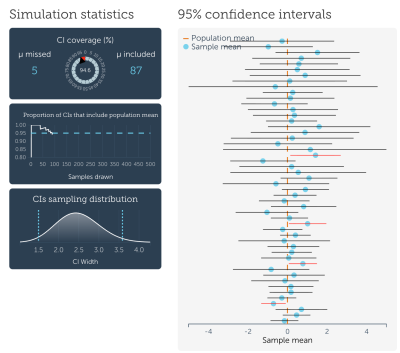
Interpreting Confidence Intervals
An interactive visualization demonstrating how confidence intervals work in statistical analysis.
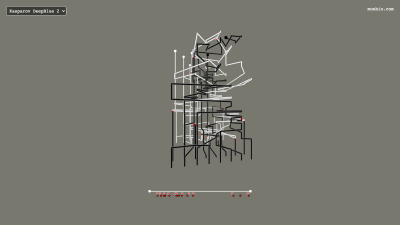
chess
Visualizing chess games as interactive 3D paths.
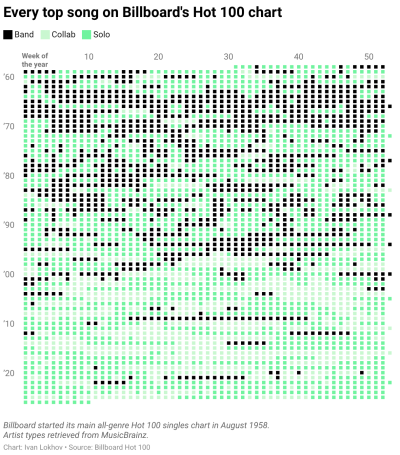
Where have all the bands gone?
Ivan Lokhov (Datawrapper) looks a the apparent disappearance of bands from the music charts.
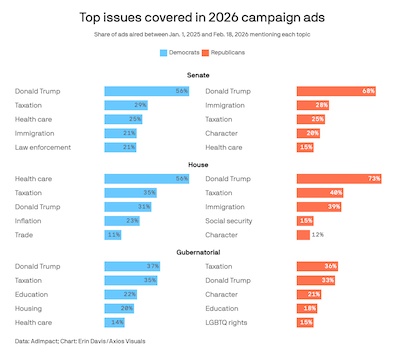
Trump dominates midterm messaging
Interesting analysis and dataviz by Axios and the outstanding Erin Davis.
AI
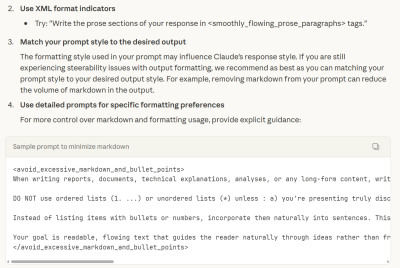
Why XML Tags Are so Fundamental to Claude
"Users report that structuring prompts with XML can be a transformative experience" in Claude.
Codified Context: Infrastructure for AI Agents in a Complex Codebase
As summarised on this Linkedin post, this paper suggests that a "single CLAUDE.md files fail to scale beyond modest codebases."
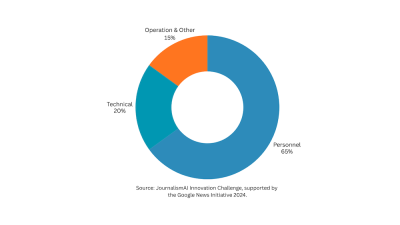
When newsrooms build AI tools, where does the money actually go?
The LSE's JournalismAI programme "analysed financial reports of 32 publishers to understand how they spend funding when building AI tools"
When AI Writes the World's Software, Who Verifies It?
AWS' Leonardo de Moura laments that "no one is formally verifying the result" of LLM-produced code.
Interactive explanations
Simon Willison: "How do we pay down cognitive debt? By improving our understanding of how the code works. One my favorite ways to do that is by building interactive explanations."
It's part of Simon's series on better use of coding LLM.