623: quantum of sollazzo
#623: quantum of sollazzo – 9 September 2025
The data newsletter by @puntofisso.

Hello, regular readers and welcome new ones :) This is Quantum of Sollazzo, the newsletter about all things data. I am Giuseppe Sollazzo, or @puntofisso. I've been sending this newsletter since 2012 to be a summary of all the articles with or about data that captured my attention over the previous week. The newsletter is and will always (well, for as long as I can keep going!) be free, but you're welcome to become a friend via the links below.
AMA – Ask Me Anything!
Talvin asks: "What's your opinion on the cursorification of design. With AI vibe coding tools being used more and more the design of products has converged to all be 'modern', 'clean' and 'light'. Does this convergent evolution of software design harm or improve the user experience as they try new products?"
I had a conversation about something related a few years back at the Goldsmiths University MA Computational Arts Degree Show: the need for good UX professionals in business.
I think there are two points to consider: the first is that LLMs have likely been trained on both good and bad designs, at least as far as web designs are concerned. But they are a tool that must be uses the right way. I can definitely imagine UX professional using vibe coding to create great user experiences and user journeys.
Designs all looking the same is not a consequence of the tool used: it's a consequence of the laziness in using things as they are out-of-the-box. About 10 years ago, all websites started to look the same thanks to the release of Bootstrap, which really made designing decent-looking website out-of-the-box easy. Similarly, everyone started to complain that websites all looked the same. Tools do what tools do: give standards and defaults. While there's always a risk of flattening experiences, I think it's unavoidable that in the first wave of any tool the use is going to be the "default".
The second point I'd make applies to any product: real products take a lot of effort in launching, marketing, and managing lifecycle. LLMs and vibe coding are a new tool in the arsenal to do this. But products are successful when they stand out. And I'm sure we'll start seeing UX folks experiment with these new tools and evolve styles. Let's wait and see.
An anonymous asked: "Why is there something rather than nothing?".
I have thought a long time about this question. The answer is: "42".
Submit a question for the next AMA – Ask Me Anything! via this anonymous Google form. I'll select a few every 4-5 weeks and answer them on here :-) Don't be shy!

The Quantum of Sollazzo grove now has 35 trees. It helps managing this newsletter's carbon footprint. Check it out at Trees for Life.
I'm at csv,conf,v9 as I write this issue. Expect a special edition next week, with my special best of the conference.
'till next week,
Giuseppe @puntofisso.bsky.social
🛎️ Things that caught my attention
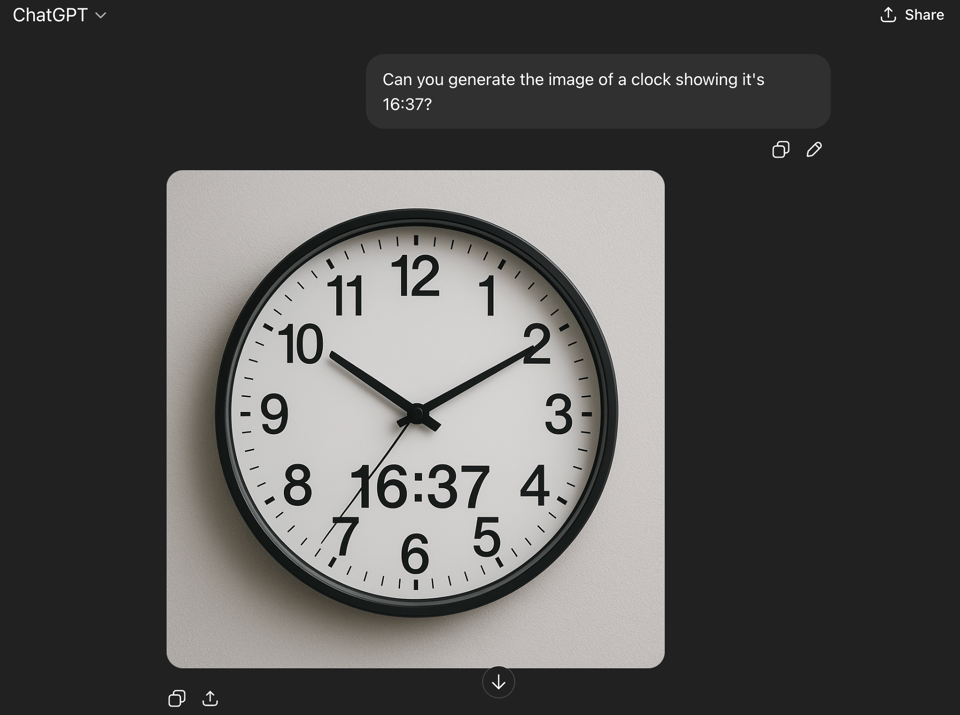
Wow to this LinkedIn status update. "I’m offering 10 Nathan points (highly coveted, totally real) to anyone who can get ChatGPT to generate a watch showing any time other than 10:10."
This, mind-bogglingly, is true – the one below is my own test!
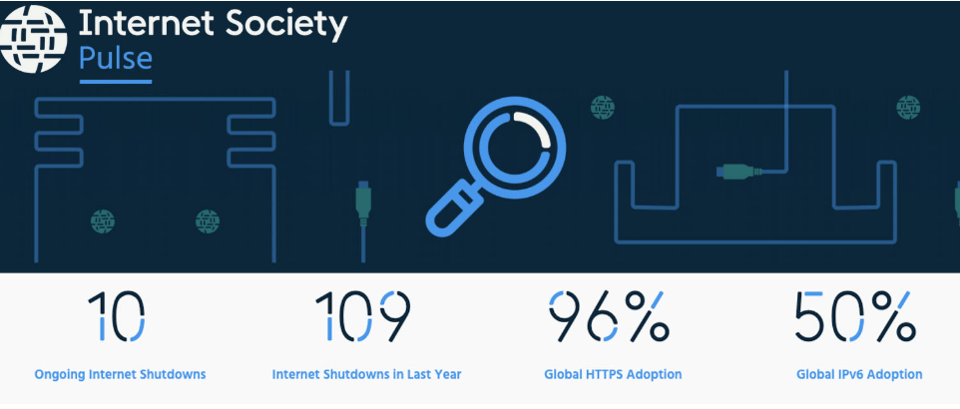
Internet Society Pulse
We curate data from trusted sources to help everyone understand the availability, evolution, and resilience of the global Internet. Subscribe.
✨ Topical
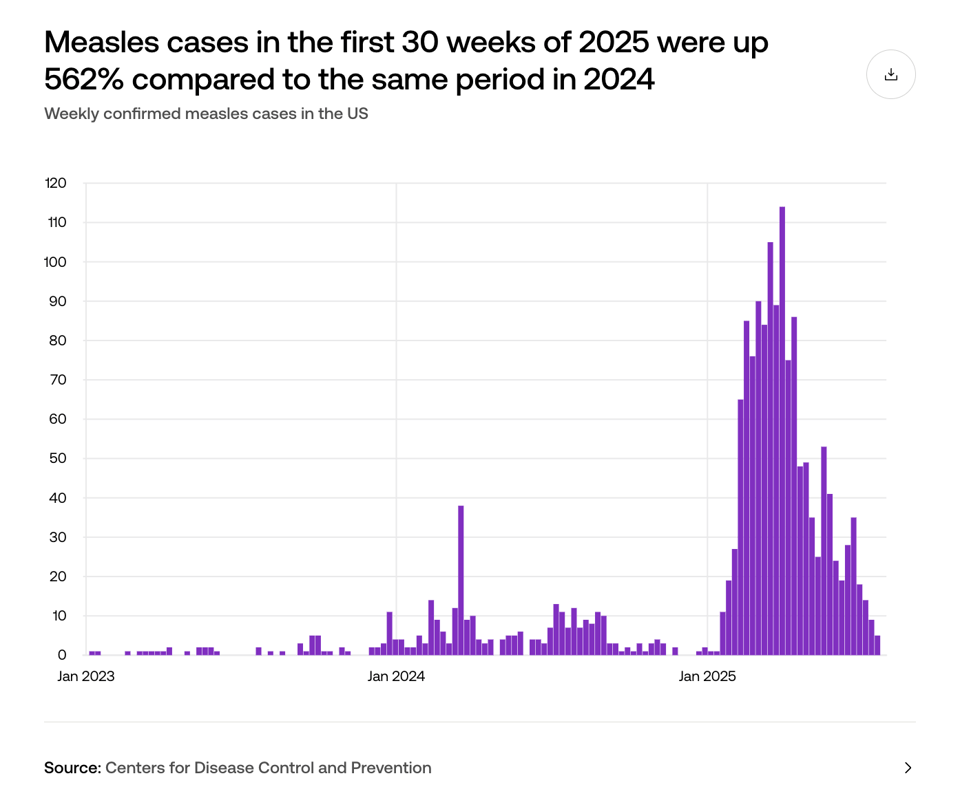
How many measles cases are there in the US?
USAFacts: "As of July 29, 2025, 1,333 cases have been confirmed in 2025, 13% of which required hospitalization. There’s been 3 confirmed deaths. This is the highest annual case count since the US declared measles eliminated in 2000.
For context, there were 285 confirmed measles cases in all of 2024, with a 40% hospitalization rate. There were no reported deaths."
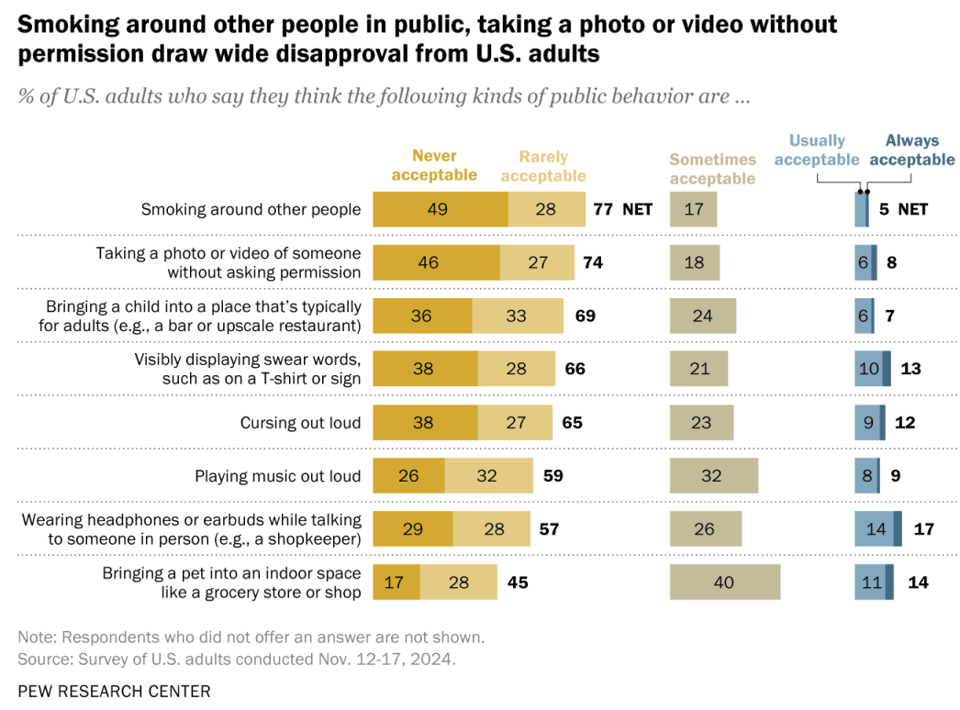
Almost half of Americans say people have gotten ruder since the COVID-19 pandemic
"Five years after the coronavirus outbreak, many Americans say public behavior in the United States has changed for the worse, according to a recent Pew Research Center survey."
It's also notable to see what counts as "rude" (chart below).
🛠️📖 Tools & Tutorials
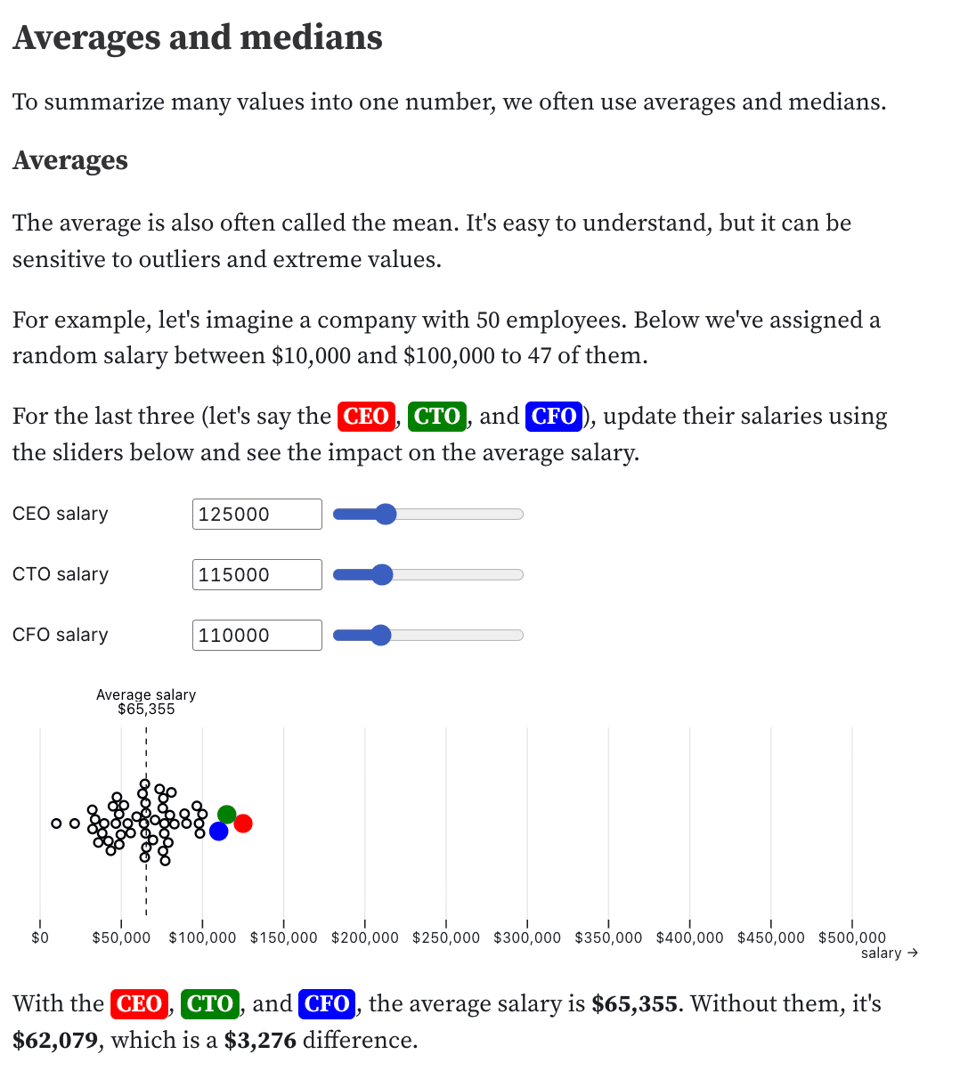
Math for journalists
"This interactive notebook aims to help journalists understand math concepts often used in news stories."
Naël Shiab, Senior Data Producer for CBC/Radio-Canada, has released this well-structured Observable notebook.
CSV Everything
"A Chrome Extension that converts images of tables or charts into downloadable CSV files using the OpenRouter API."
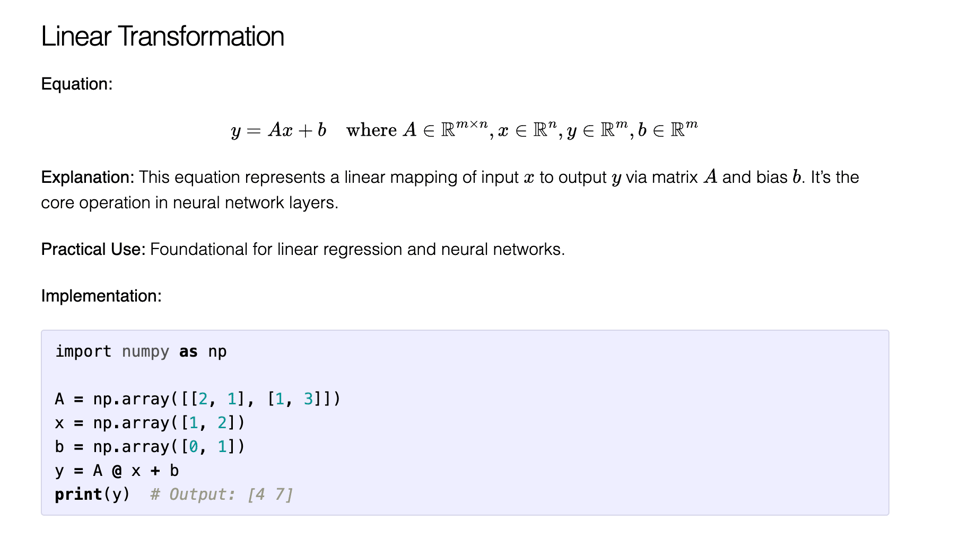
The Most Important Machine Learning Equations: A Comprehensive Guide
"This guide is for anyone with a basic background in math and programming who wants to deepen their understanding of ML"
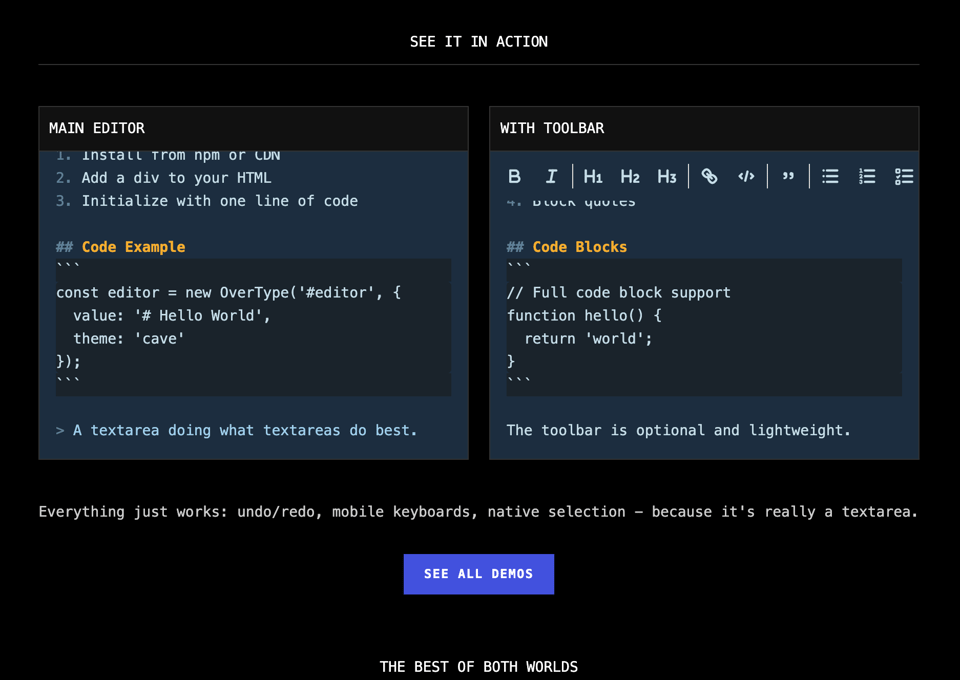
Overtype
"OverType is a transparent textarea over rendered markdown.
Plain text simplicity, WYSIWYG beauty, zero complexity. 82KB TOTAL• ONE SCRIPT TAG."
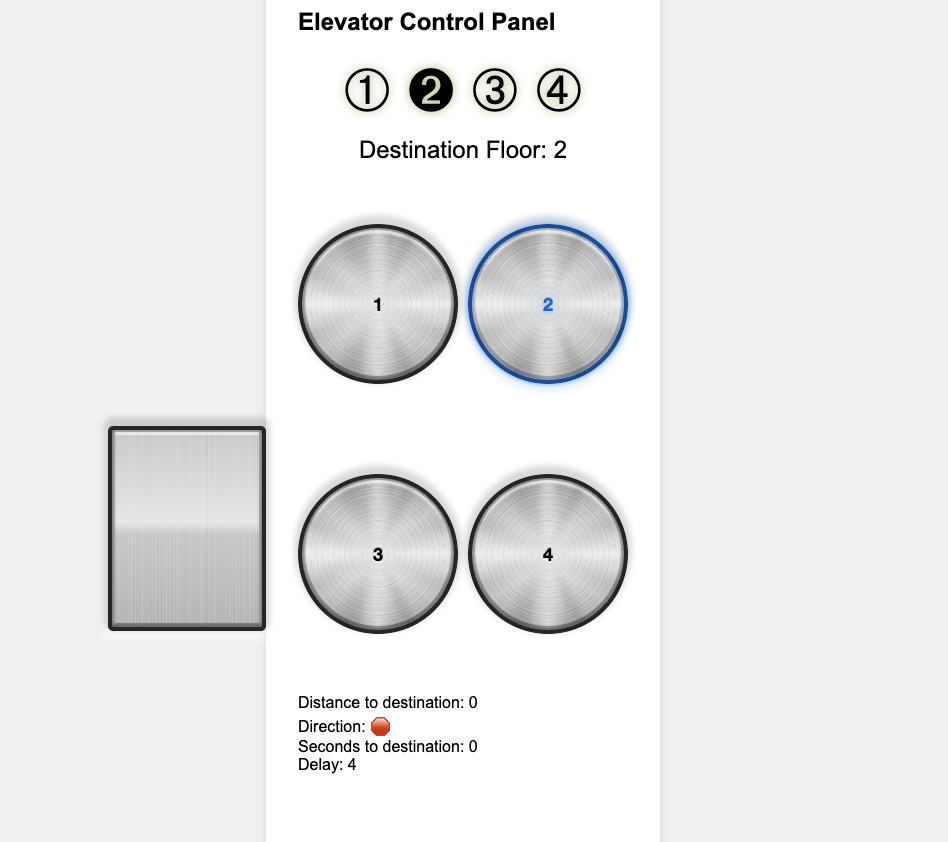
CSS Elevator: A Pure CSS State Machine With Floor Navigation
"As a developer with a passion for state machines, I’ve often found myself inspired by articles like “A Complete State Machine Made with HTML Checkboxes and CSS.” The power of pure CSS-driven state machines intrigued me, and I began to wonder: could I create something simpler, more interactive, and without the use of macros?"
Not quite data per se, but useful thinking for aspiring coders.
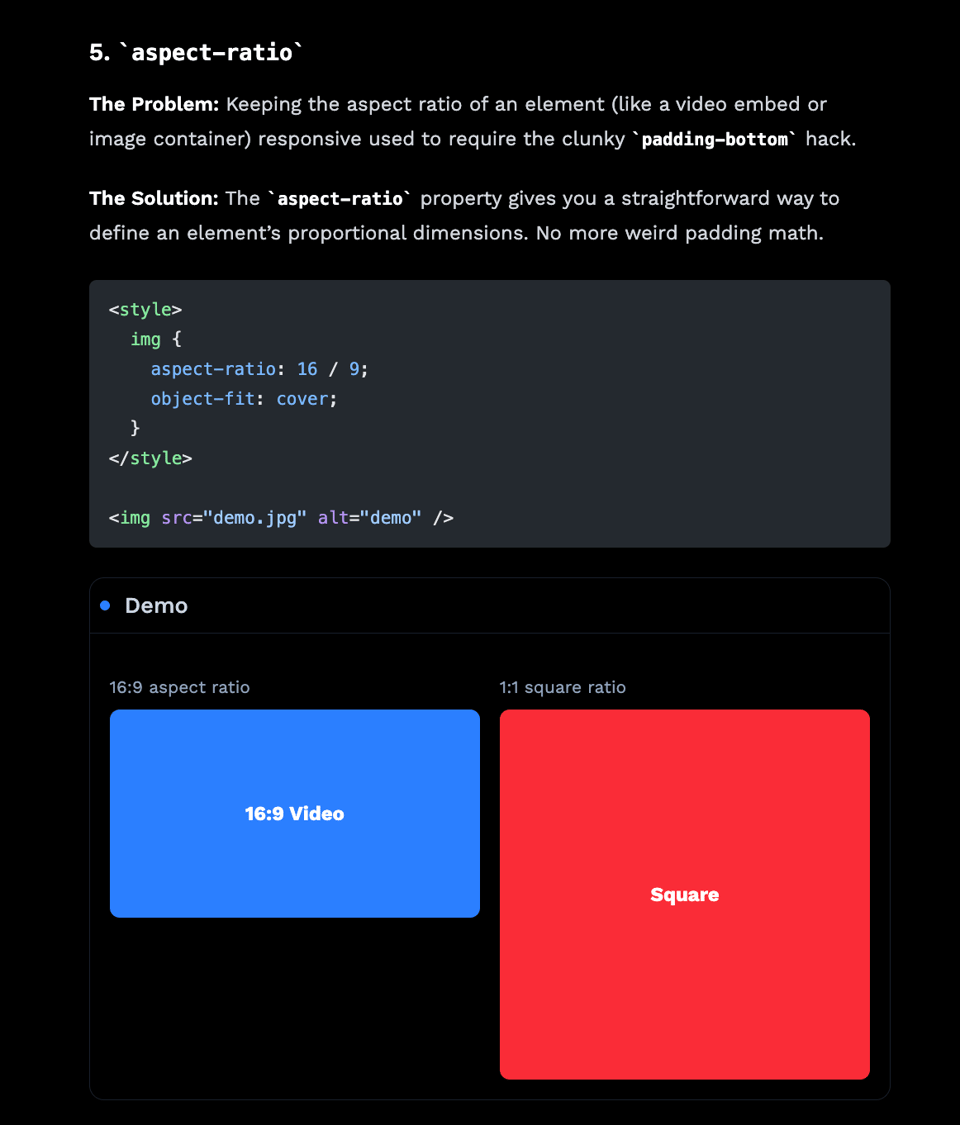
10 CSS Features I've Found Really Useful
"Some lesser known CSS properties that solve common problems elegantly."
Yes, folks, make your data viz prettier :)
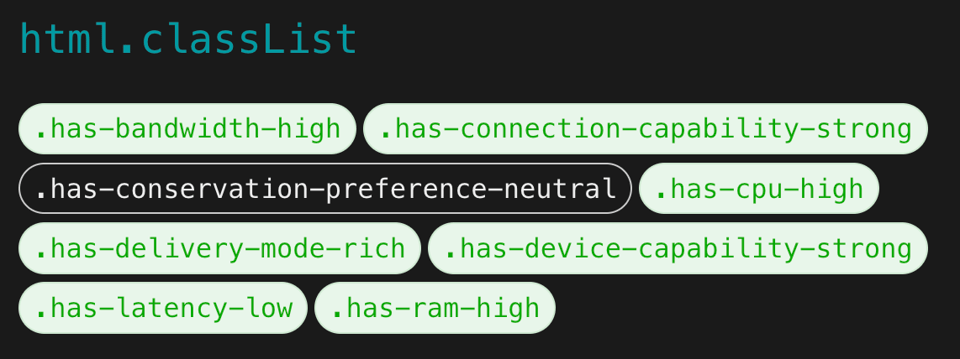
Obs.js: context-aware web performance for everyone
"Obs.js reads a handful of browser signals (Navigator and Battery APIs) to infer connection strength, battery status, and device capability. It exposes those signals as CSS classes on the \<html> element, and as properties on window.obs, so you can adapt delivery accordingly: serve lower-resolution media, forgo web fonts, disable auto-playing video… you name it."
A good way to optimise your websites for a variety of performance scenarios.
🤯 Data thinking
What I've learned designing data systems
Ergest Xheblati: "Notes on data system design, IFTT data architectures and functional data engineering".
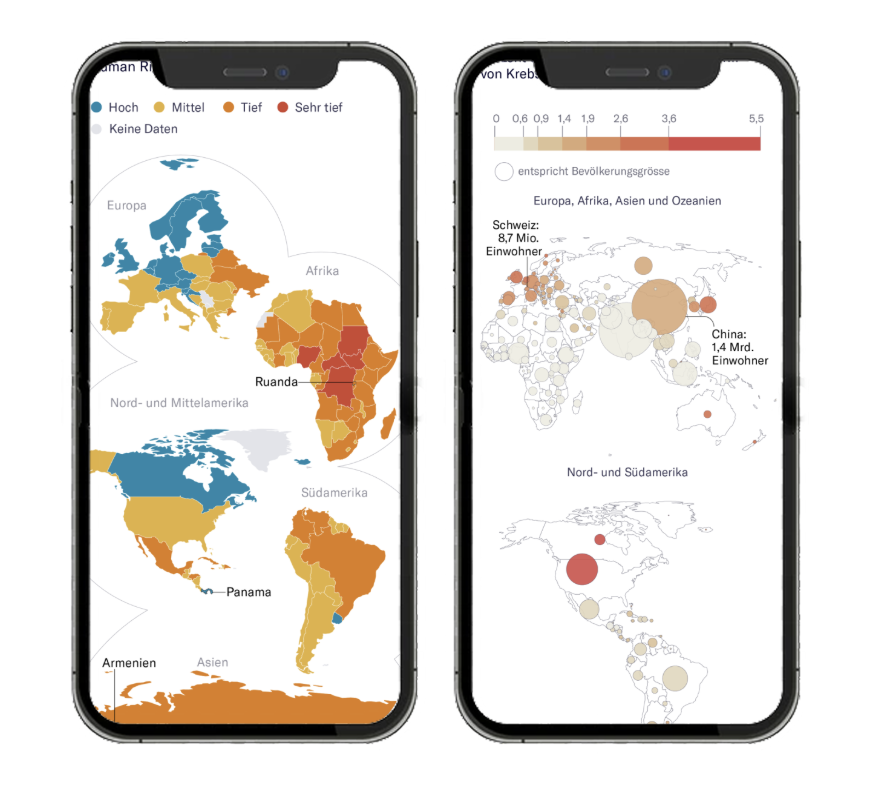
Thematic World Maps for Mobile
"Why are we still designing maps for the wrong screen? ... In other words, the bubble map delivers a truer impression straight to the reader’s visual system."
(via Geomob)
📈Dataviz, Data Analysis, & Interactive
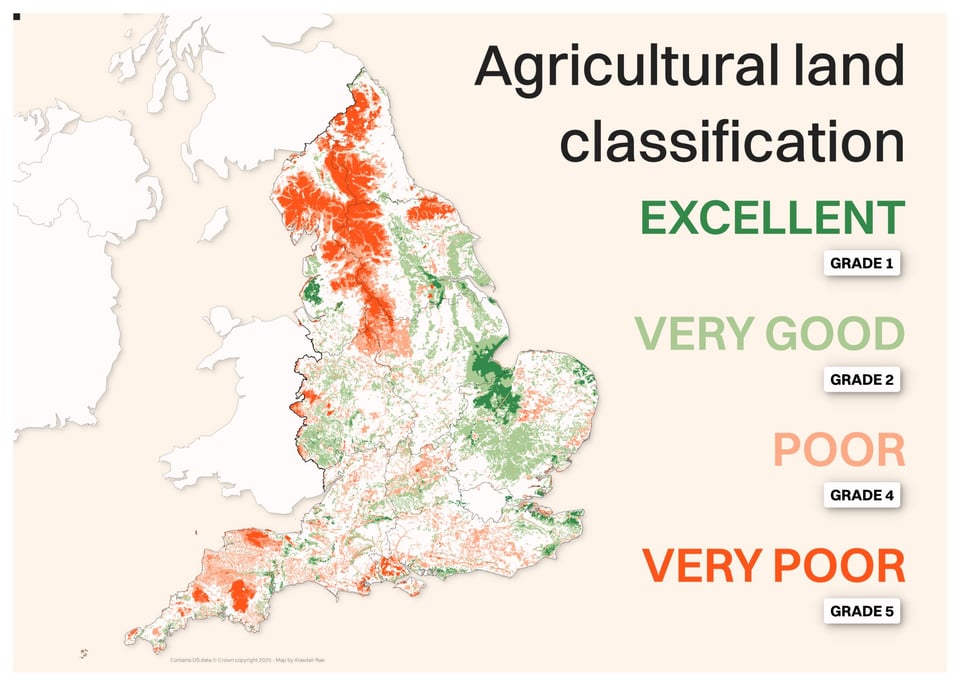
Agricultural Land Classification
Alasdair Rae: "I've always found the agricultural land classification (ALC) data very interesting, even though I don't use it very often - so here's the very best and the very worst agricultural land in England according to the ALC - note the small chunk of Grade 1 agricultural land inside Greater London."
Come see my allotment...
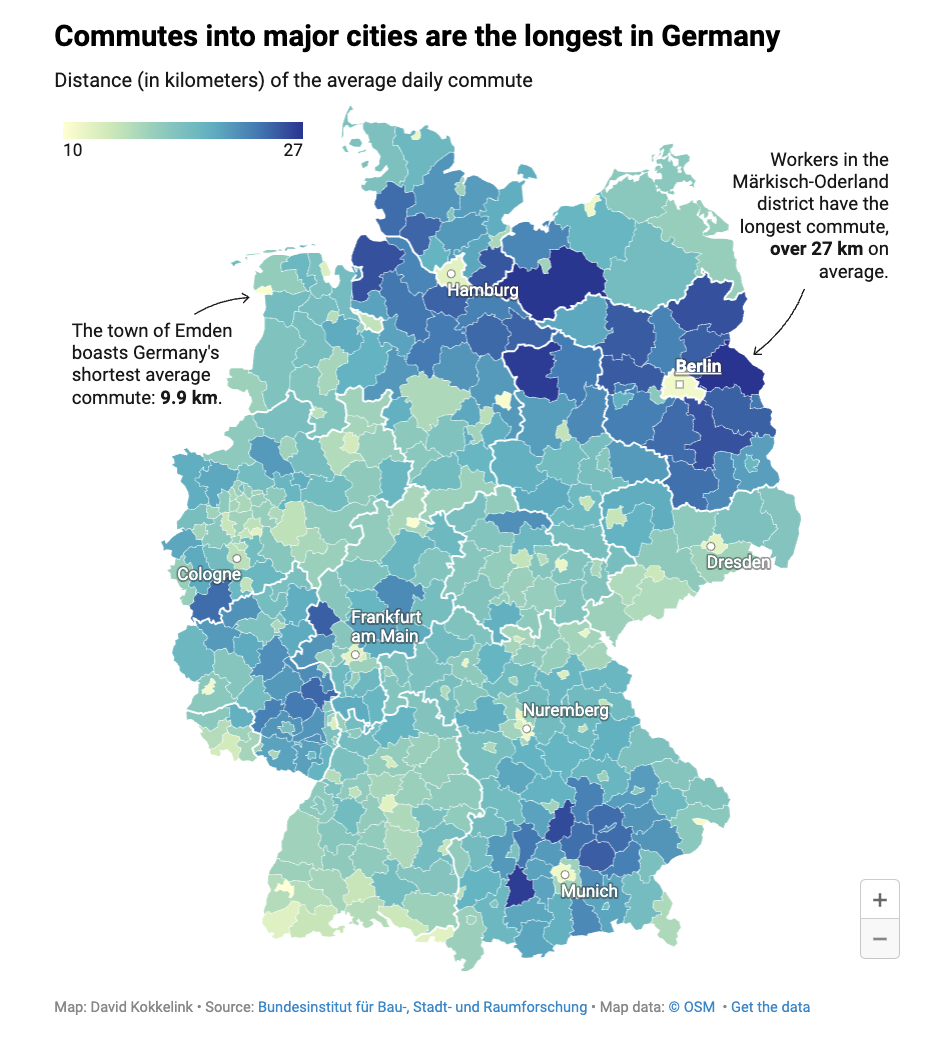
How far — and how long — Germans travel to work
Good analysis by Datawrapper's David Kokkelink on commuting length. I wonder – and, who knows, you might find this next week – if Britain follows the same patterns of shorter commutes in the capital and major cities.
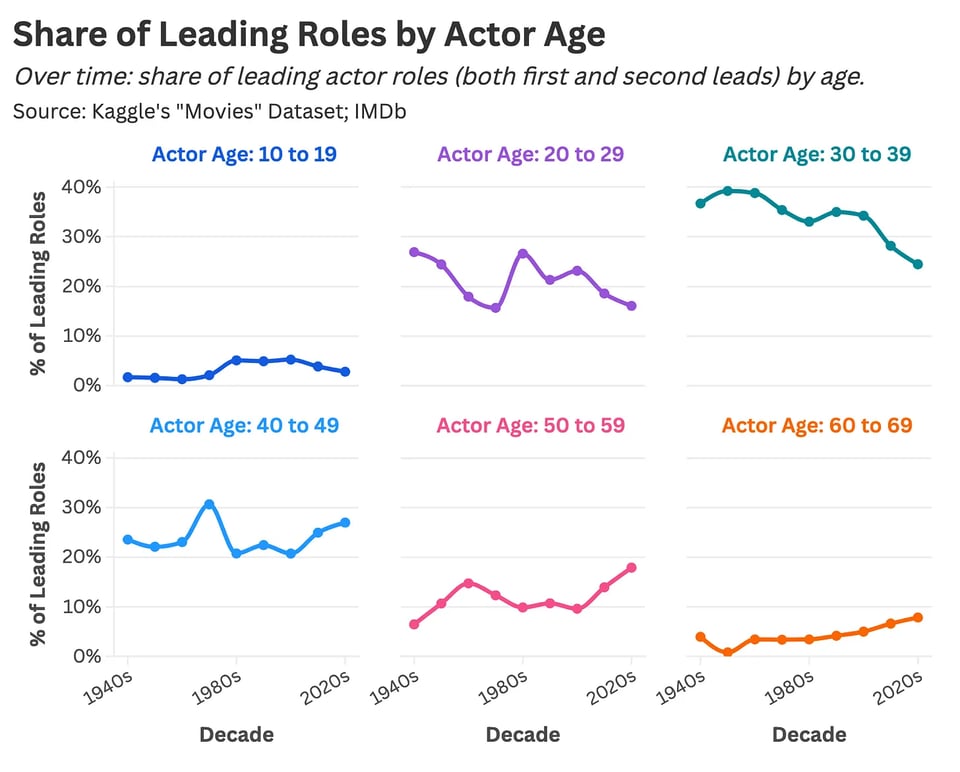
Do Actors Get Better With Age? A Statistical Analysis
Daniel Parris (StatSignificant): "How does an actor's age influence critical acclaim, commercial success, and casting opportunity?"
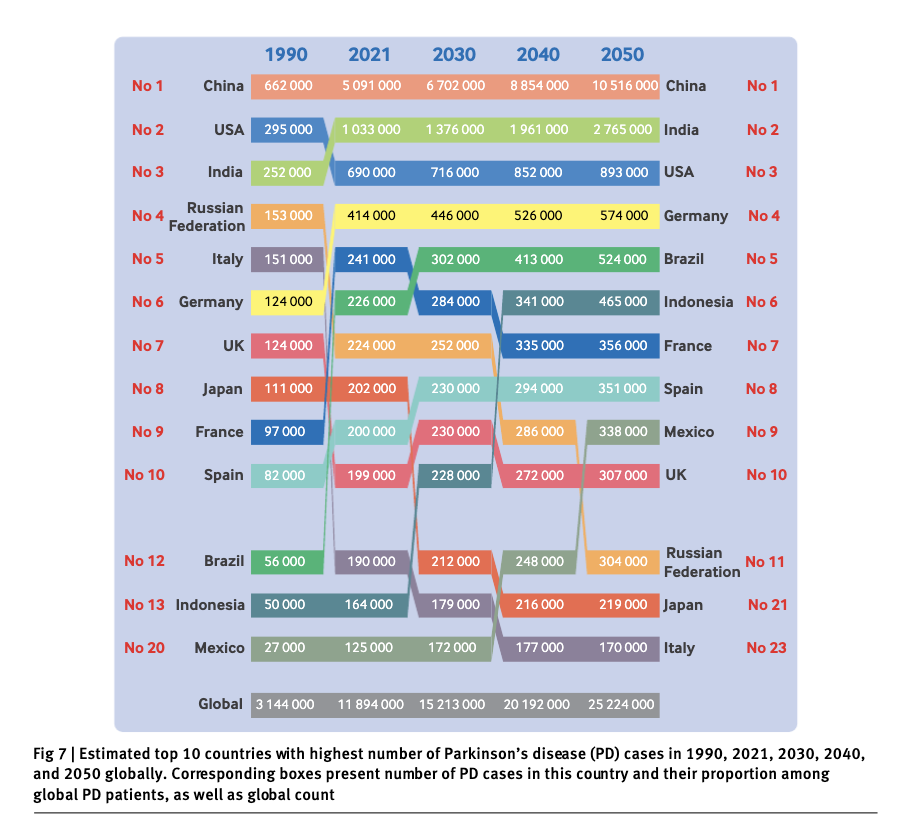
Top 10 countries with Parkinson's Disease
This chart of "estimated top 10 countries with highest number of Parkinson’s disease (PD) cases" is from this paper on the British Medical Journal, linked by Rory Cellan-Jones latest newsletter.
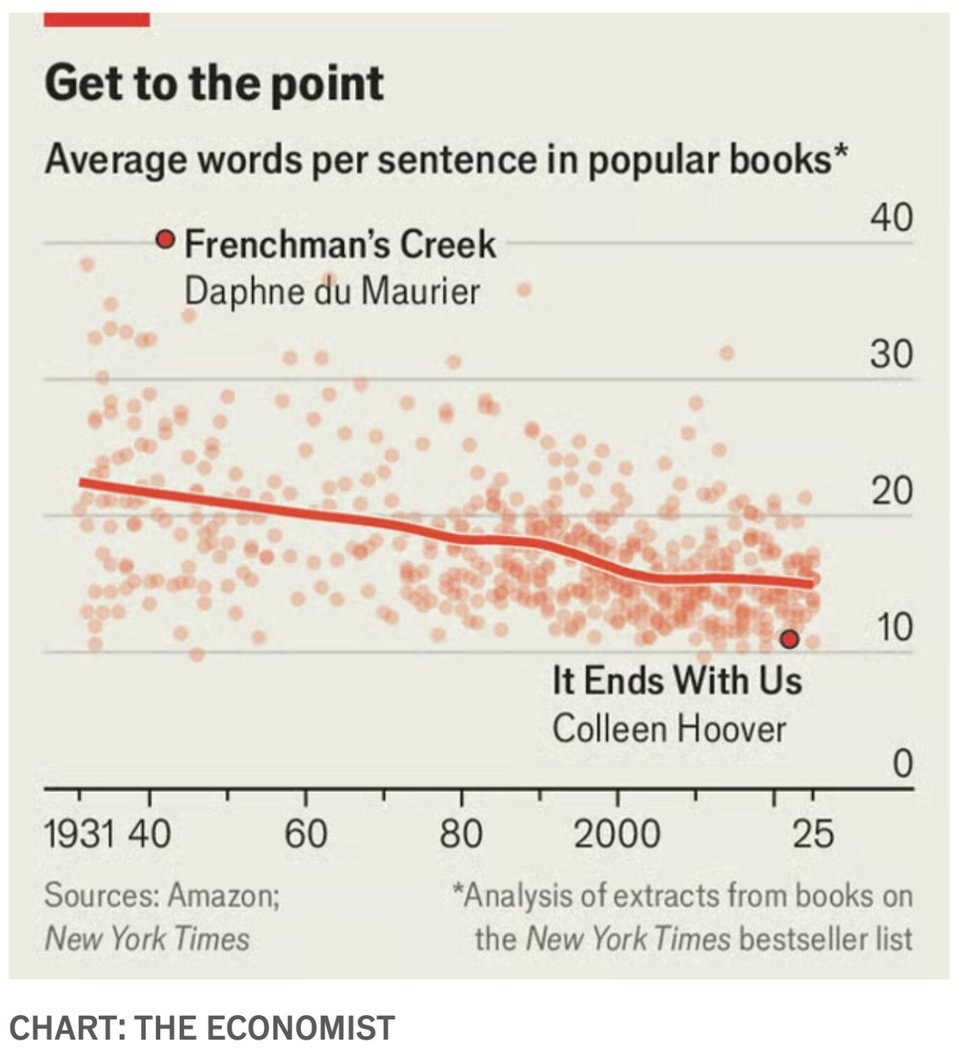
Sentences are getting shorter
The Economist's data guru Alex Selby-Boothroyd: "I made this chart using Sondre Ulvund Solstad's excellent analysis of the NYT bestseller list for a piece in the Culture section on the decline of reading. In short, reading is in trouble. But people have been complaining about dwindling literacy for thousands of years...".
Your Name In Landsat
Yes, NASA has this web app that allows you to display any string using satellite imagery from Landsat. Here's "Quantum" below.
(via Geomob)

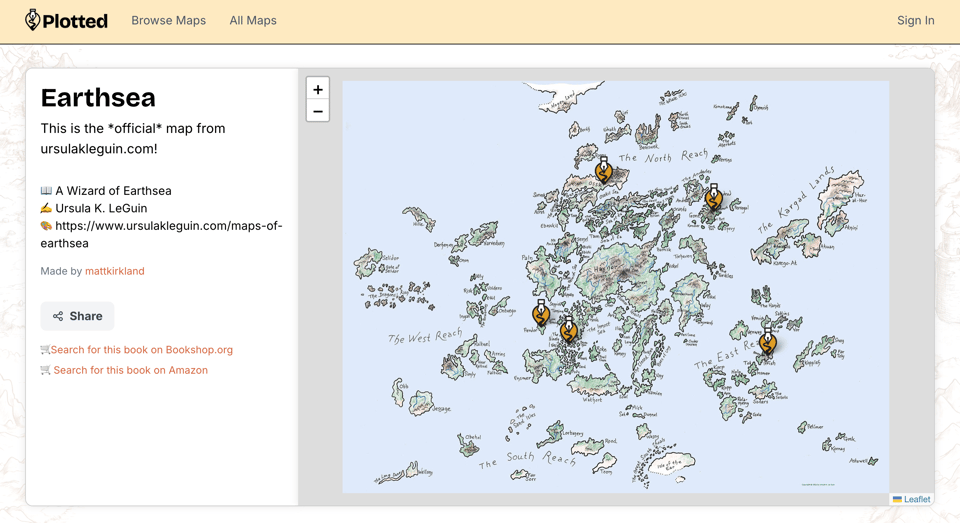
Your favorite book has a map.
"Create and explore interactive maps of worlds from books. Upload a map, or use the real world to create a map. Track character journeys, discover new places, and share your literary adventures."
(via Geomob)
🤖 AI
Lessons on building an AI data analyst
Pedro Nascimento: "We started with a toy problem — text-to-SQL — and then let users pull us forward. The product evolved into a generative BI platform: it generates SQL, draws charts, writes Python for complex calculations, grounds itself in enterprise context, and pulls in external sources (web, PDFs) when the data story demands it.".
How AI Is Changing Search Behaviors
"Our study shows that generative AI is reshaping search, but long-standing habits persist. Many users still default to Google, giving Gemini a fighting chance."
I’m a High Schooler. AI Is Demolishing My Education.
Ashanty Rosario for The Atlantic: "The end of critical thinking in the classroom".
(via Ian Watt)
|
DID YOU LIKE THIS ISSUE>? → BUY ME A COFFEE! 
You're receiving this email because you subscribed to Quantum of Sollazzo, a weekly newsletter covering all things data, written by Giuseppe Sollazzo (@puntofisso). If you have a product or service to promote and want to support this newsletter, you can sponsor an issue. |
quantum of sollazzo is also supported by Andy Redwood’s proofreading – if you need high-quality copy editing or proofreading, check out Proof Red. Oh, and he also makes motion graphics animations about climate change.
