Topical
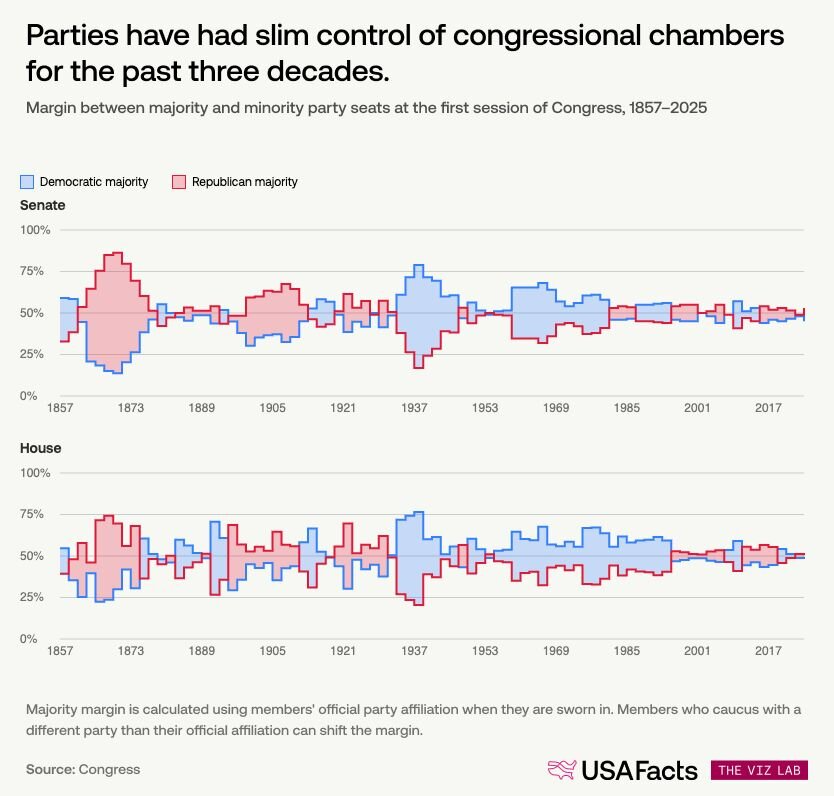
This is a pretty good analysis of US Congress majorities, with great charts illustrating it. I love how immediately understandable the one below is.
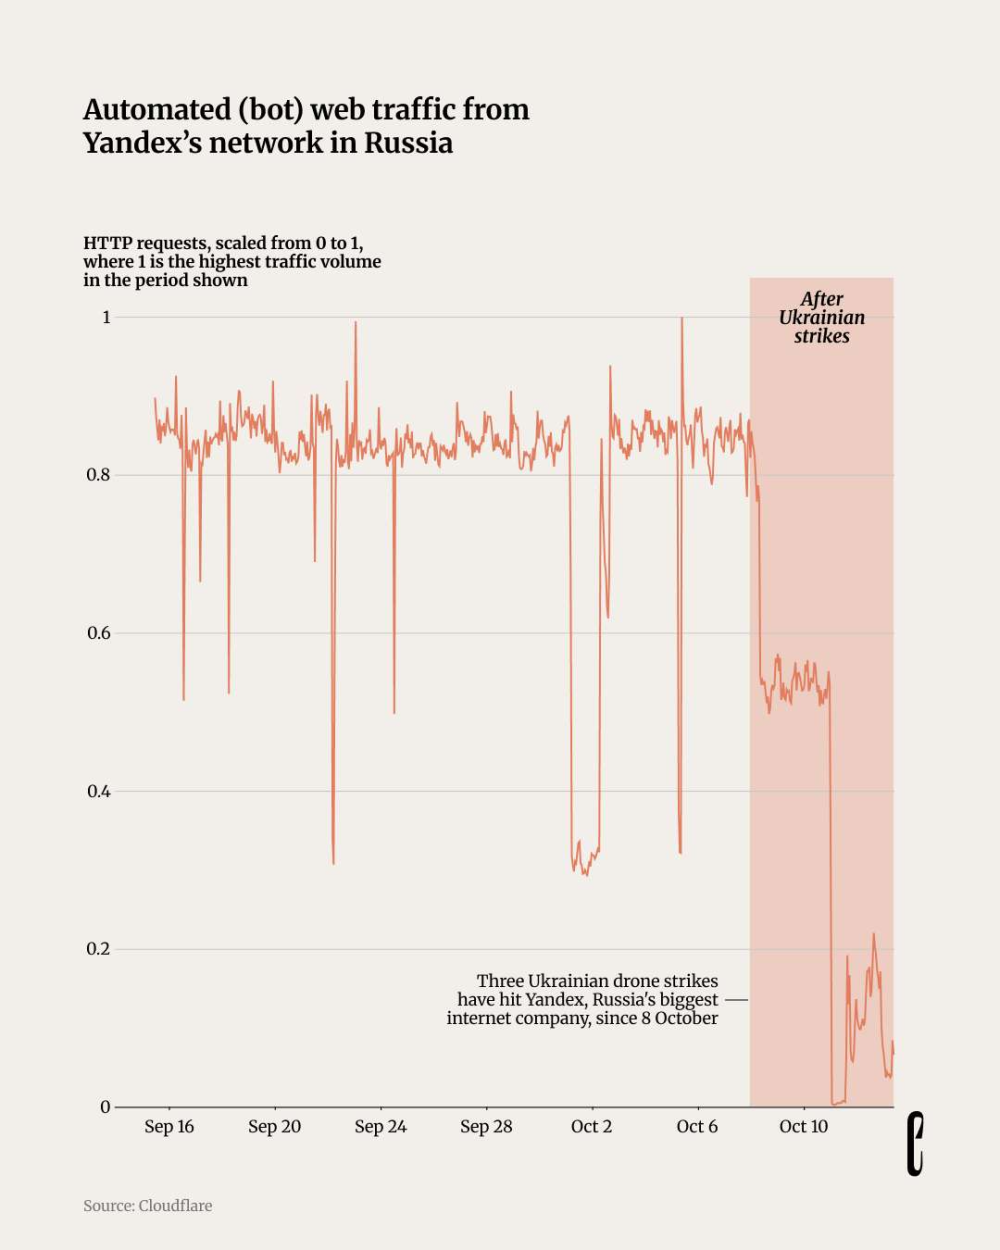
The European Correspondent asks: "Did drone strikes on data centres in Russia make online bots go away?"
Tools & Tutorials
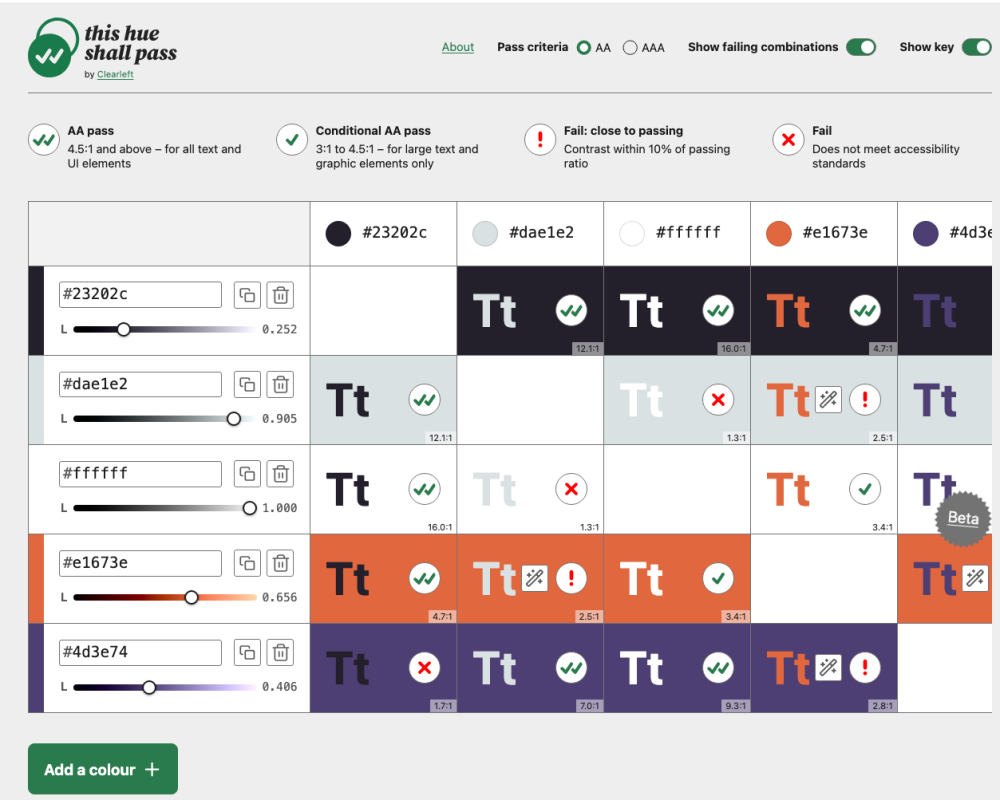
Cleearleft's interactive colour accessibility tool.
Extra points for the pun in the title.
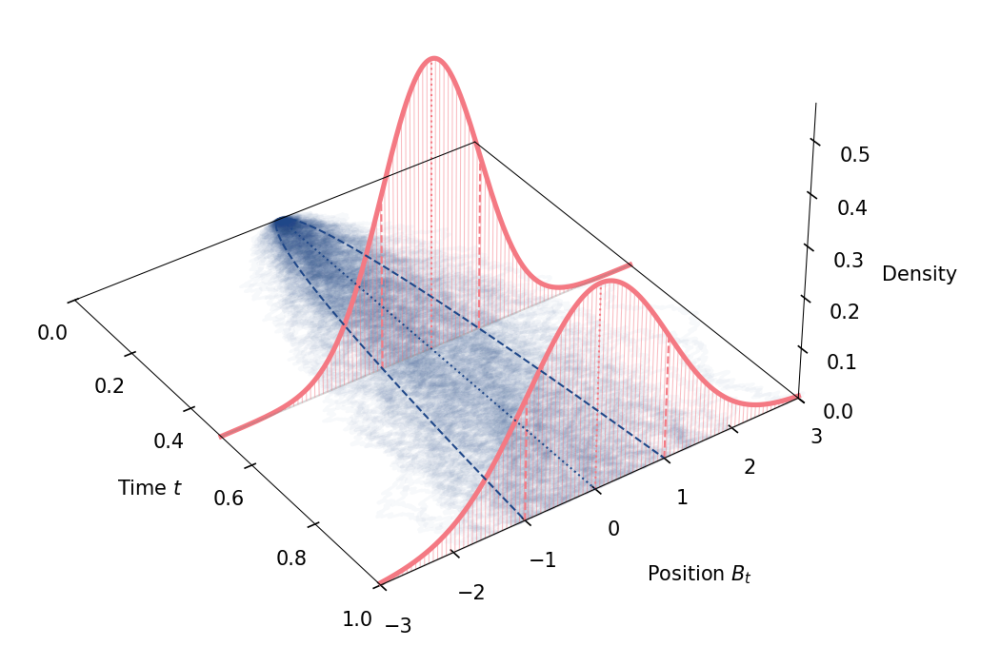
This article shows how to derive Brownian motion as the continuous-time limit of a discrete random walk, built from a binomial tree of coin flips.
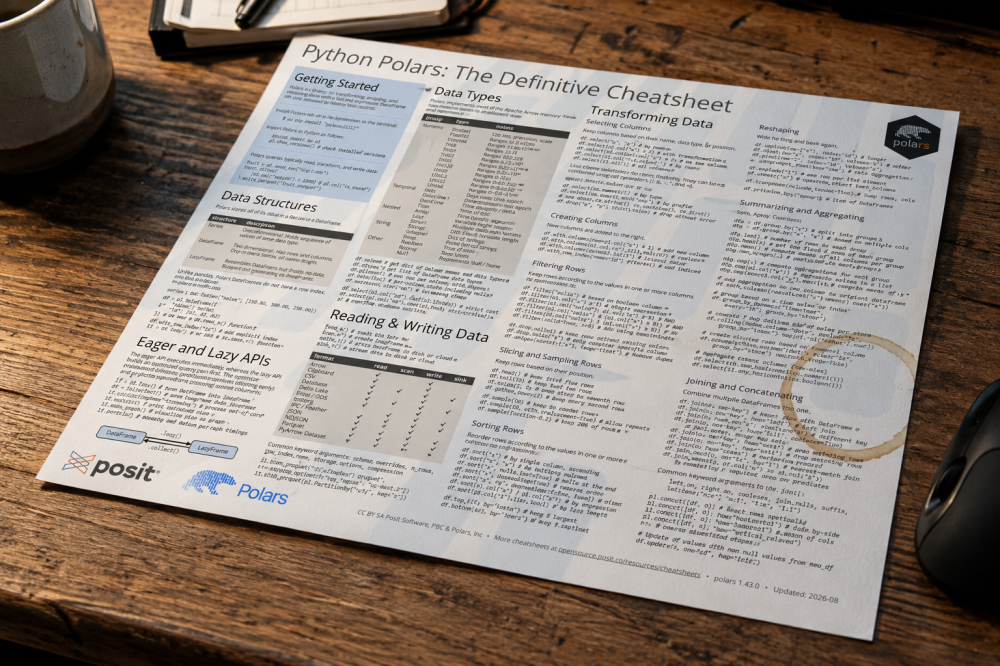
Posit condensed its ~500-page Polars book into a free two-page cheatsheet, available as PDF and HTML.
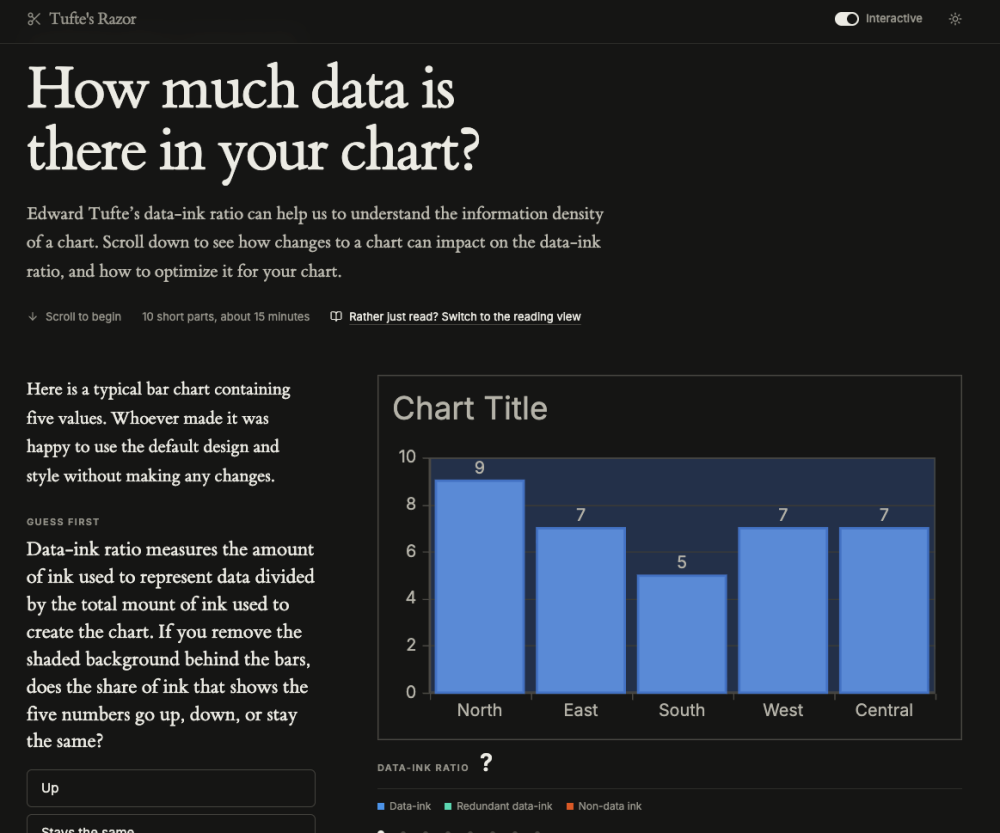
"Edward Tufte’s data-ink ratio can help us to understand the information density of a chart. Scroll down to see how changes to a chart can impact on the data-ink ratio, and how to optimize it for your chart." Basically, an interactive guide explaining Edward Tufte's data-ink ratio through a step-by-step bar chart redesign, raising it from 3.6% to 9.5%.
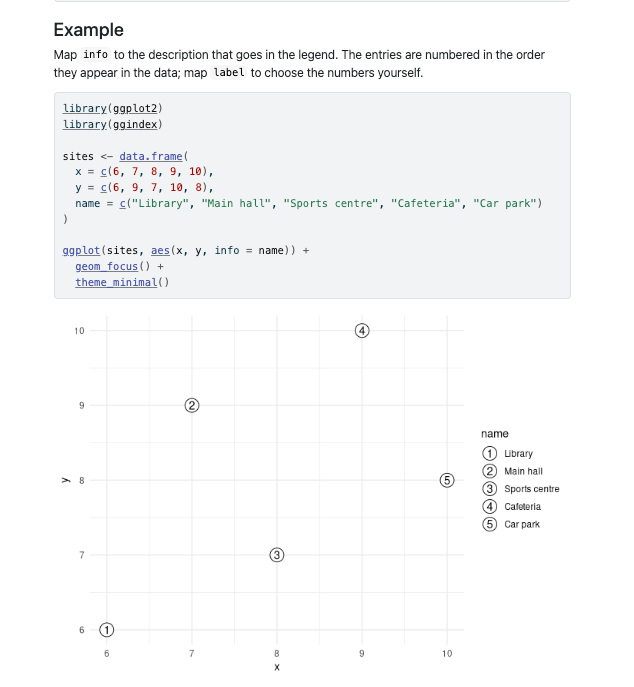
- ggindex is an R package that marks selected ggplot2 points with numbered markers, explained in a legend like an annotated map.
- Users map "info" to legend descriptions and "focus" to highlight only specific observations while others are plotted with "geom_point()".
- It supports standard sf maps via "geom_sf_focus()" and respects ggplot2 aesthetics like colour, fill, shape, and size.
"I frequently proclaim (together with other people working on AI) that we ought to be more ambitious when using it. It’s become a rallying cry. Whenever we see something impressive, we repost and write “we’re not ambitious enough”. I understand how tricky it is to follow that advice, so here’s a tutorial on being more ambitious.
I think of ambition in four types: Speed, Altitude, Depth, and Range."
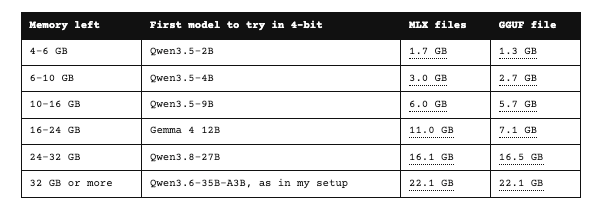
Kevin Lewis explains how to select a local LLM.
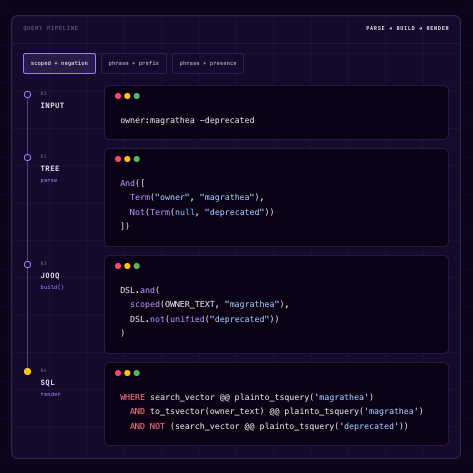
Cortex rebuilt its search engine using plain Postgres, replacing a Lucene-based system that caused out-of-memory errors and stale results.
Data Thinking
Randy Au: "the hard work is figuring out 'where the signal is'."
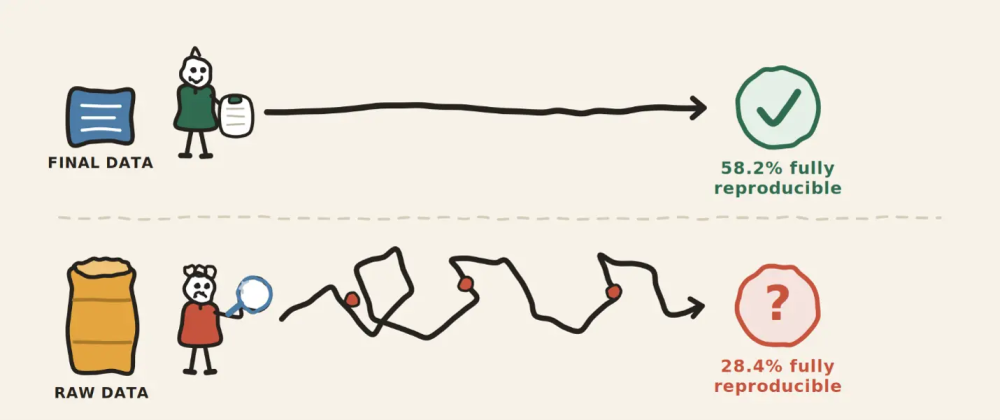
"Over the past two years, I4R has collaborated with Psychological Science, a leading journal in psychology, on a large reproducibility project.
67 independent teams completed reproduction reports for 64 articles published in the journal in 2024 and 2025. That covers about 44% of the 146 eligible articles from those two years. Teams followed a standardized protocol specified by I4R. They documented data and code availability, computational reproducibility, coding errors, prevalence of preregistration, deviations from preregistered plans, and whether those deviations were acknowledged.
Here is what we learned."
The most important finding is that reproducibility fell sharply when starting from raw data, with only 28.4% fully reproducible versus 58.2% using final analysis datasets.
Dataviz, Data Analysis, & Interactive
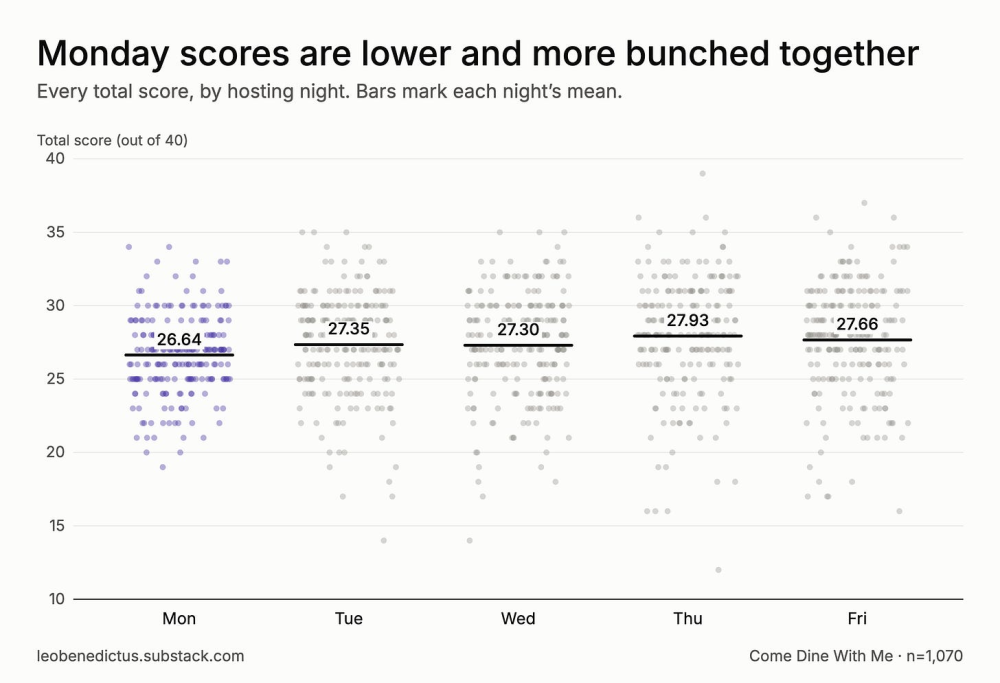
Leo Benedictus's recent data analysis explores how "twenty years of dinner party scores show us why male contestants are more likely to win."
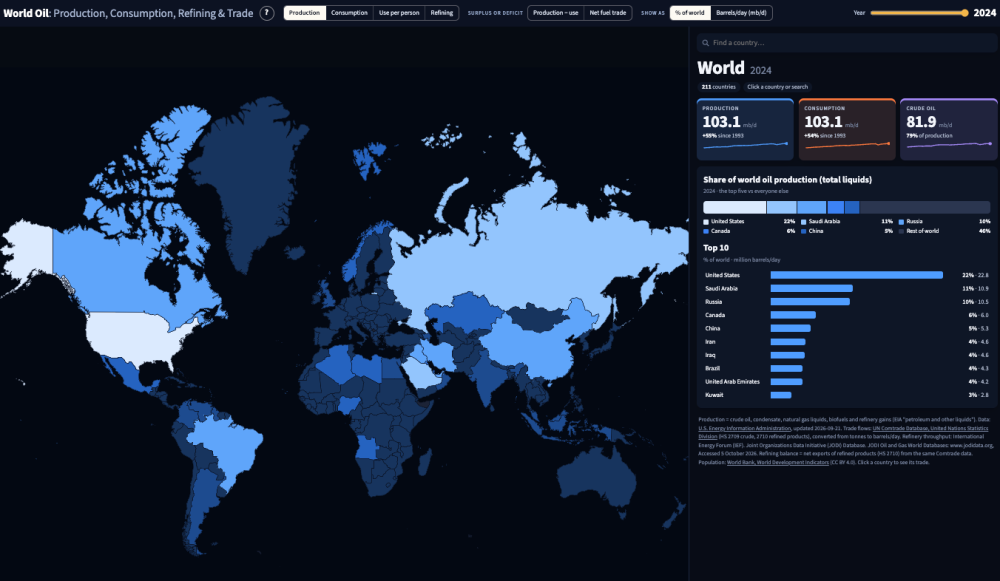
Steven Feldman's newest map-vibecoding attempt, which is pretty ambitious this time. Blog post here.
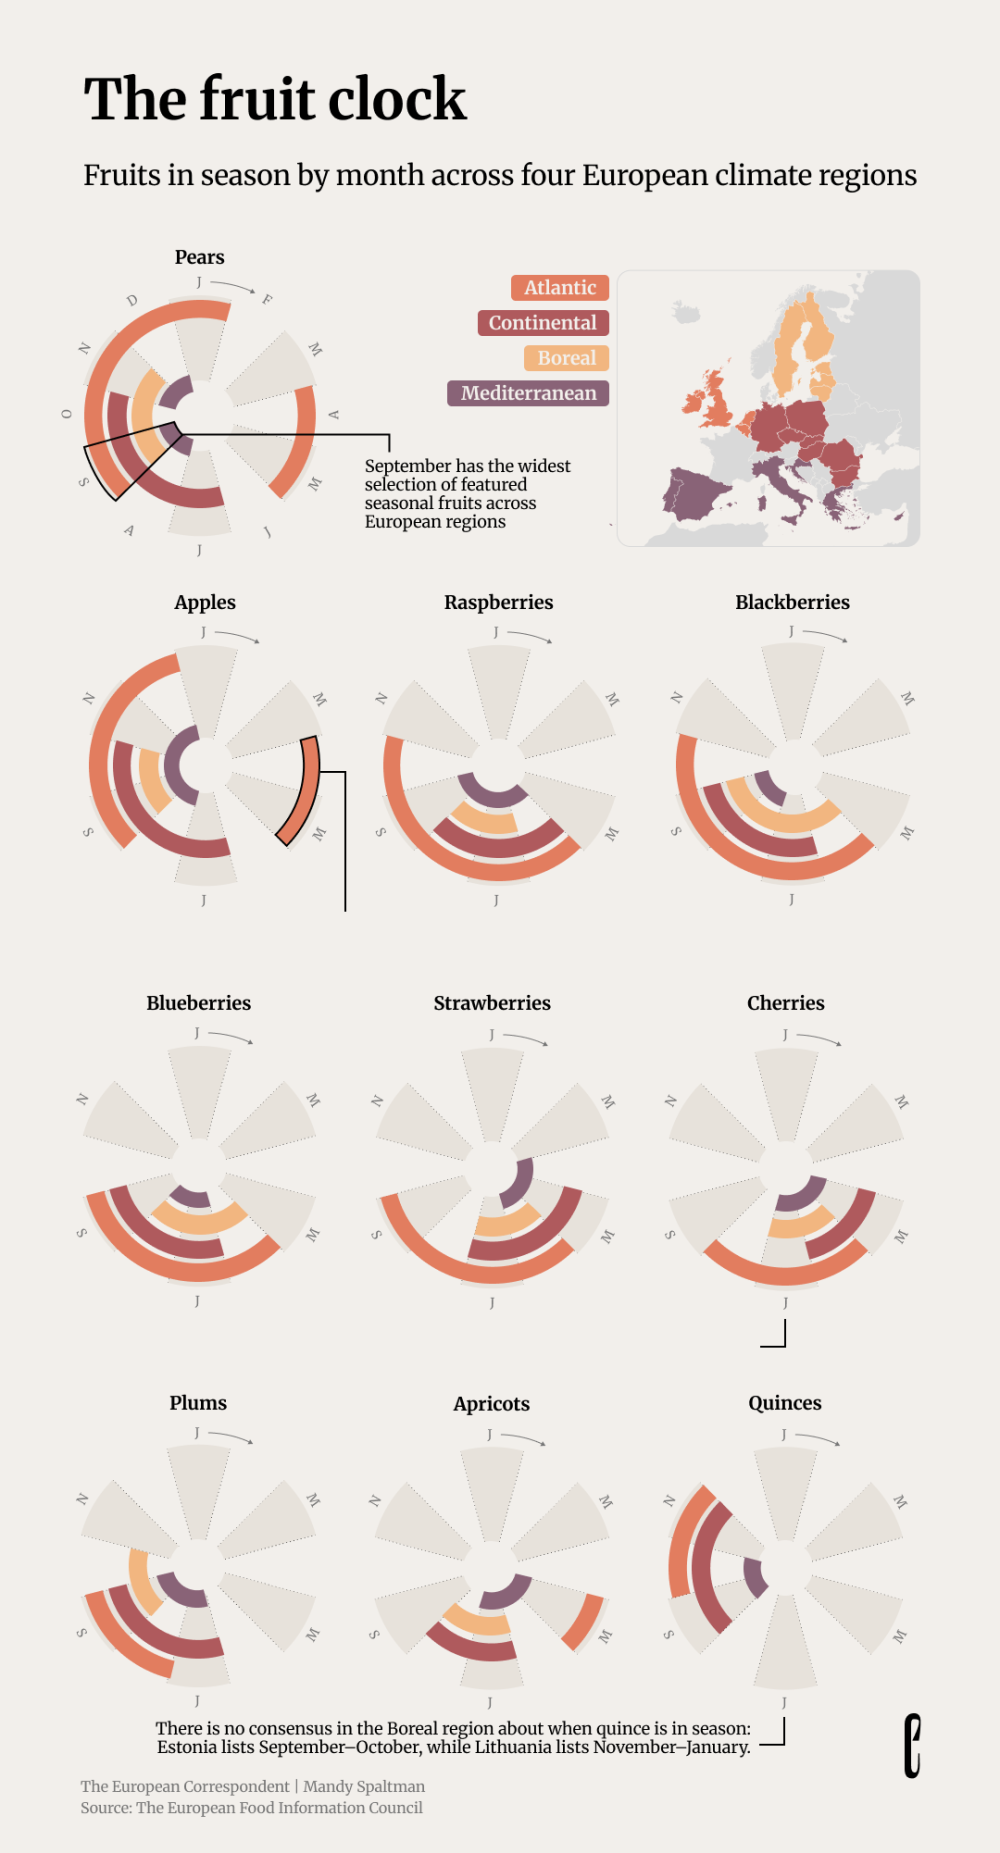
Another link from The European Correspondent looking at fruit seasonality: "We recently published a story asking what eating seasonally even means. Fruit likes to make that question even trickier."
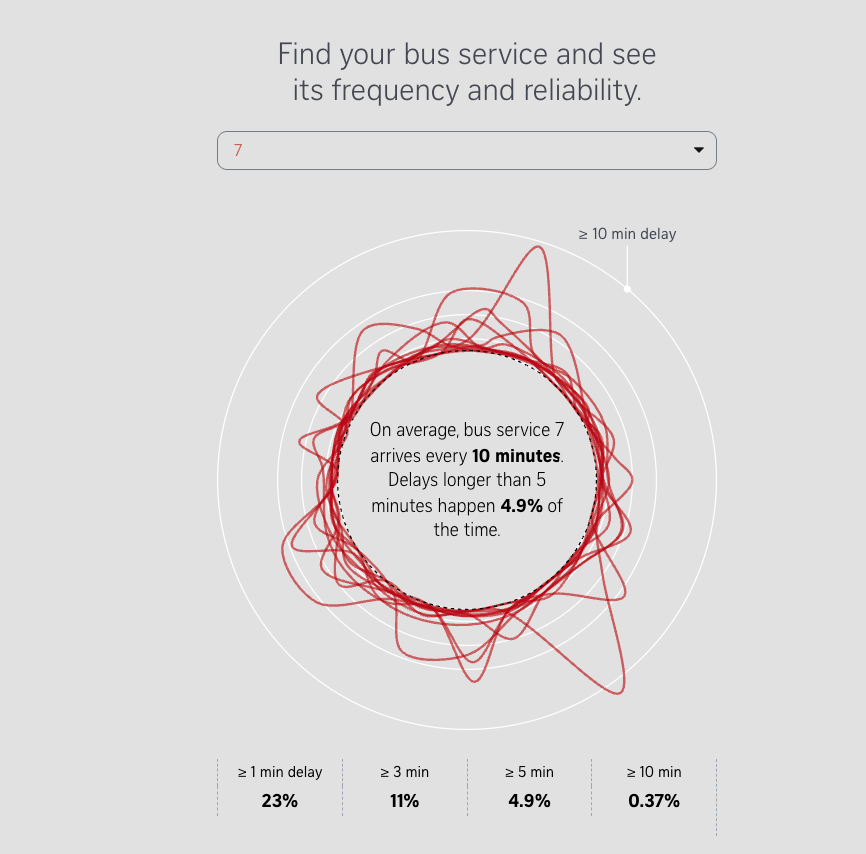
"Why does it sometimes feel like you’re waiting for the bus for such a long time? So many buses have come and gone, but yours is still three minutes away. You’re anxious – there’s an important meeting you need to get to, and if the bus doesn’t come, you are going to be late."
An impressive data analysis and visualization by the Strait Times, based on 300 bus routes in Singapore.
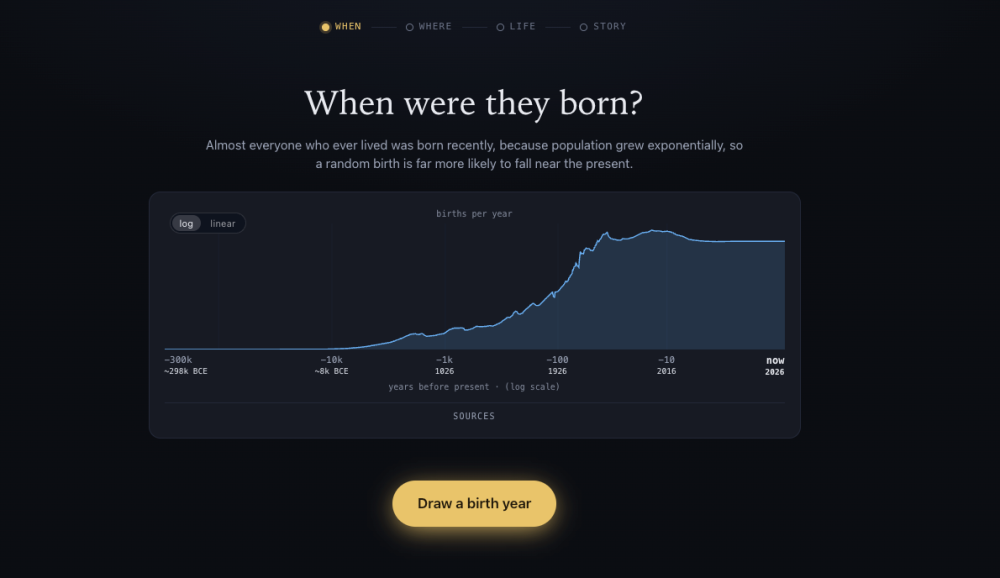
"You'll draw, step by step: a year, a place, a life, each taken at random from real data."
(via Colin Davis)
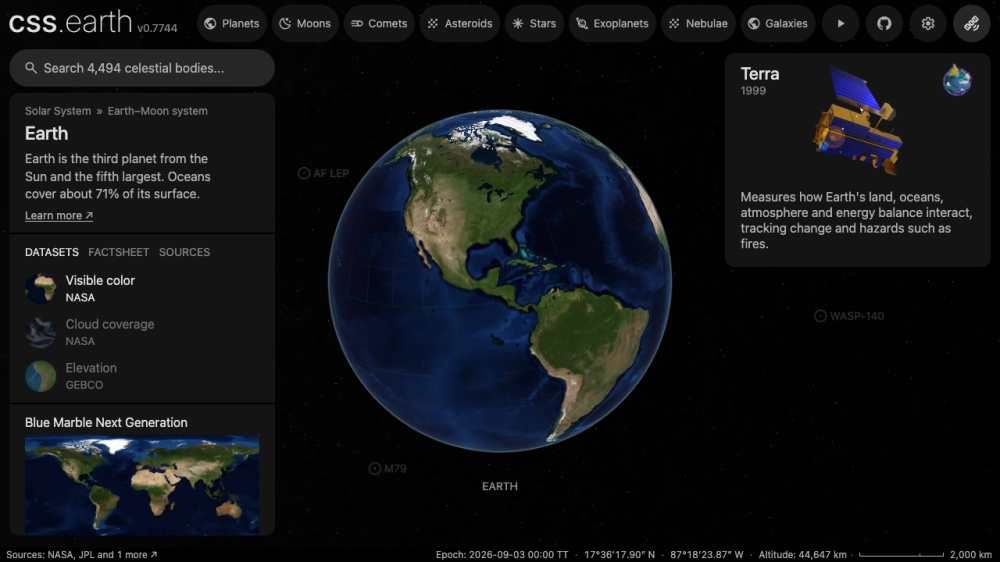
This is a "3D CSS astrovisualization platform, powered by the PolyCSS engine."
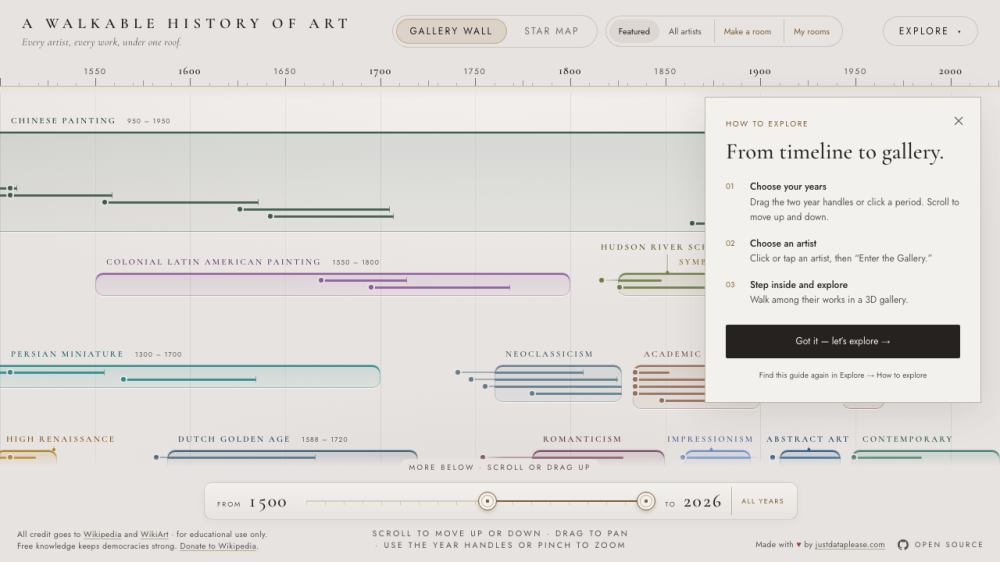
This is "a zoomable art-history timeline with walkable 3D galleries of real paintings, all sourced from Wikipedia".
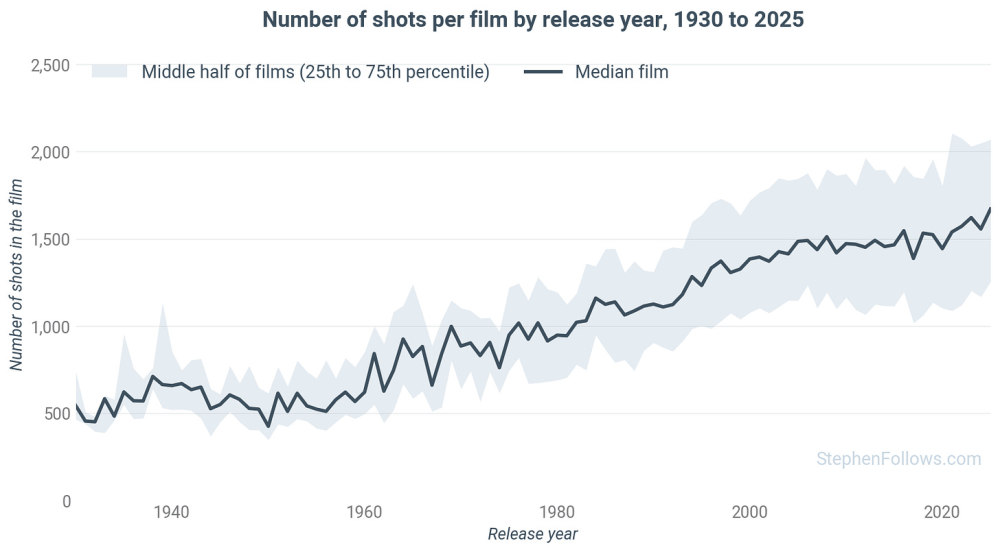
This analysis of 8,770 films finds that the number of shots in films has been steadily increasing since the 1950s.
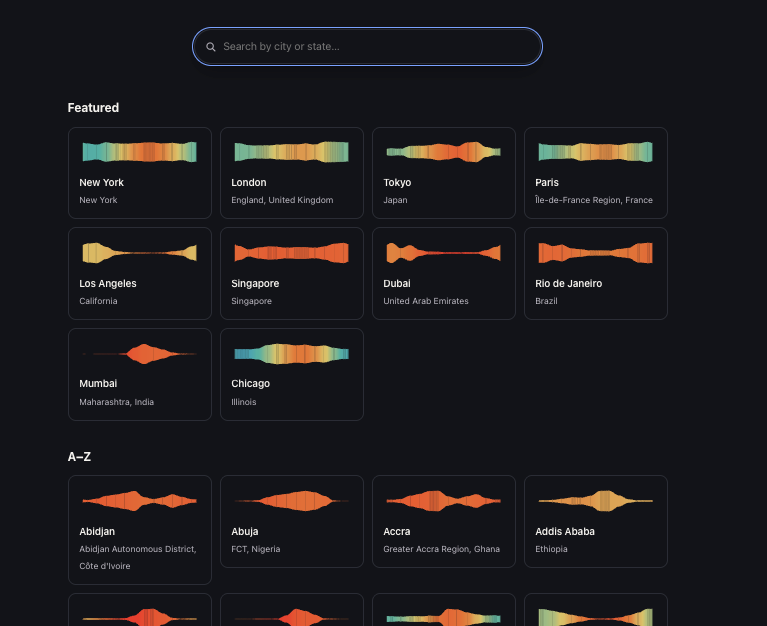
A searchable directory of cities worldwide, creating a weather ribbon based on real climate data: "Climate charts for cities around the world. Each city page shows 30-year normals (1991–2020) for temperature, precipitation, snowfall, humidity, cloud cover, wind, daylight, and recent air quality, rendered as static SVG charts with no runtime API calls."
Code available here.
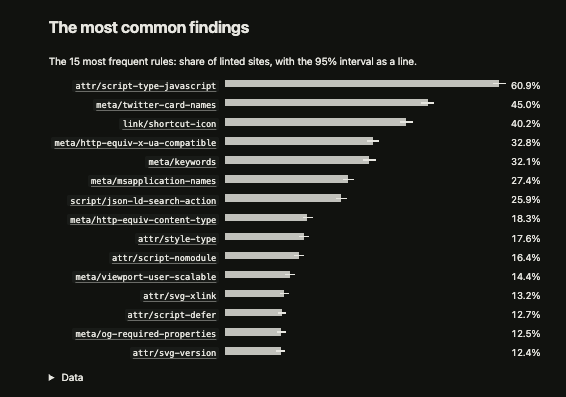
Of the 4,570 linted home pages they analysed, 99.1% ship markup findings, and 44.4% include at least one harmful finding affecting users. The most common harmful issue locks zoom: 14.4% of pages use "user-scalable=no" or similar, blocking readers from zooming.
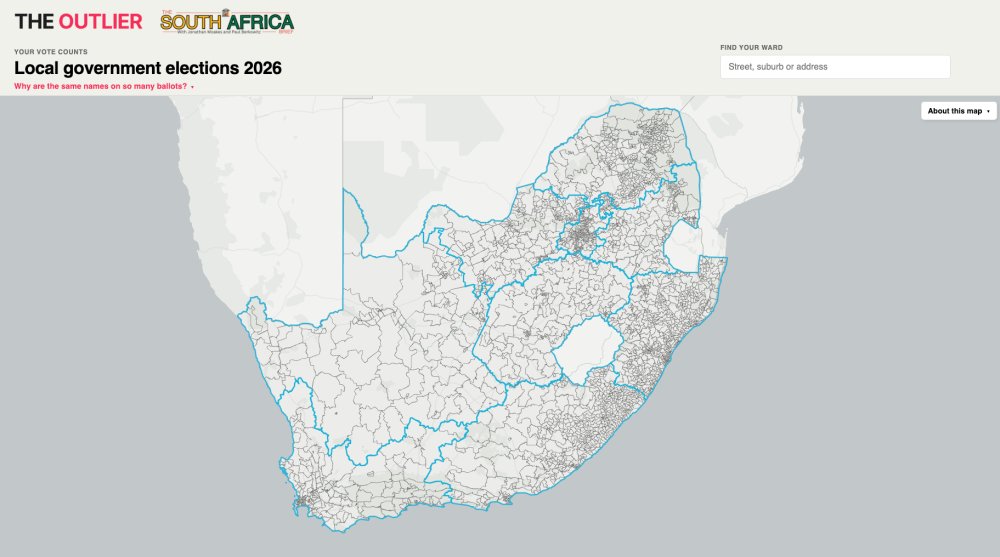
South Africa's The Outlier has published this pretty good interactive map of electoral wards.
AI
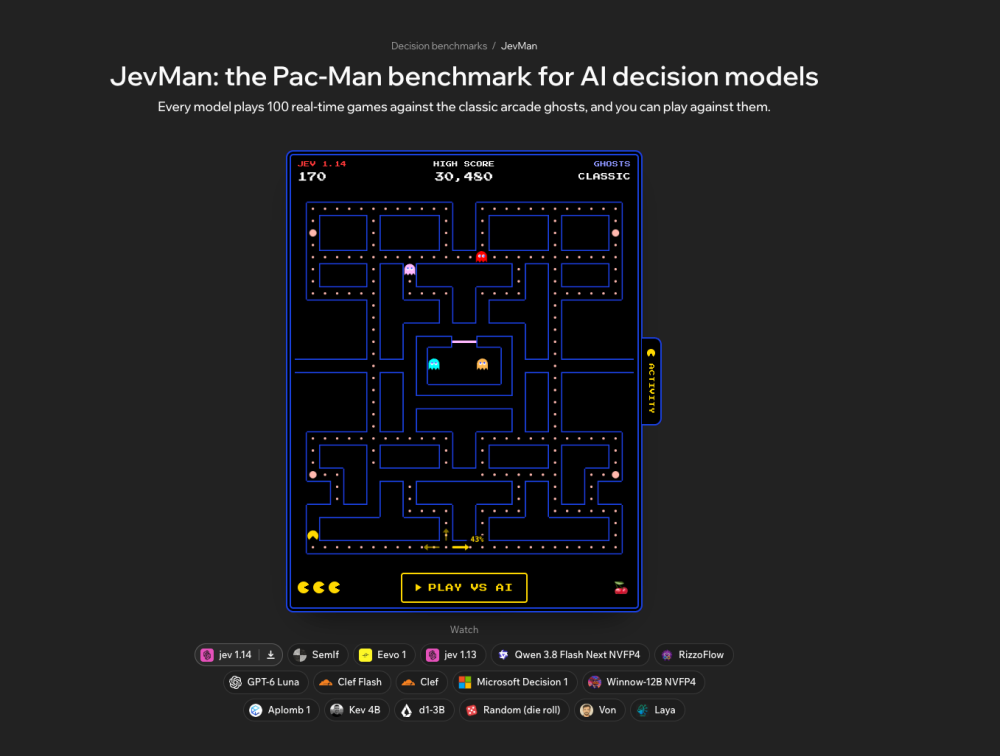
- JevMan benchmarks AI decision models by having each play 100 real-time Pac-Man games against classic scripted ghosts.
- Models answer with probability odds per direction at each junction rather than writing text, ranked by mean score with a 95% margin of error.
- The open-source benchmark lets anyone submit models via pull request, with CI replaying every submitted game to verify scores.
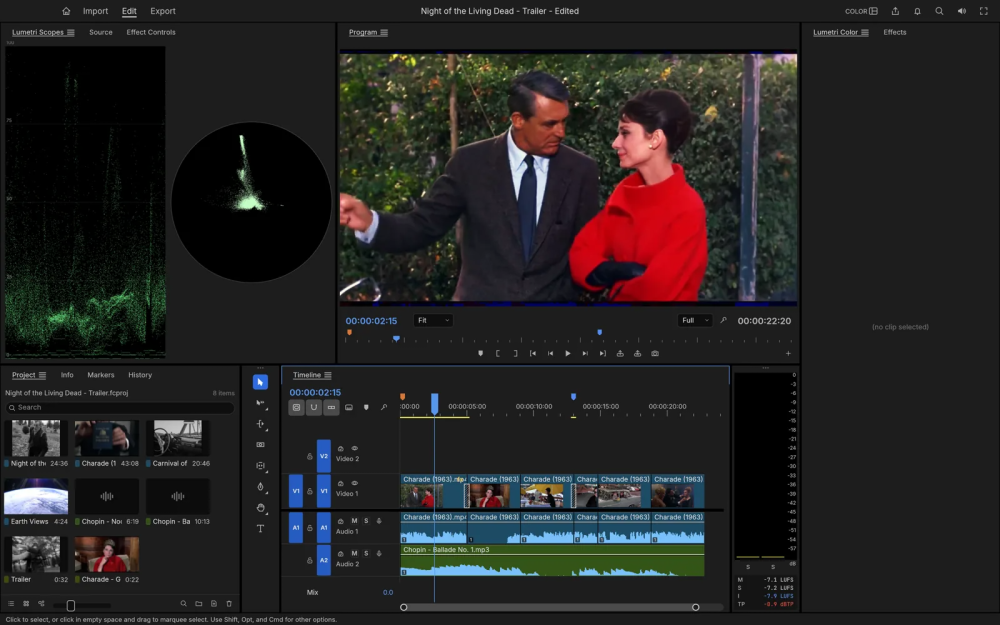
Developer Brandon Thomas used Claude Opus to build seven open source clones of Adobe apps like Photoshop and Premiere. They have shortcomings, but they are nonetheless pretty impressive, if you forget about the IP issues involved.
A critical take by Berkeley CS Professor Ben Recht: "Unfortunately, I did not find a faster Fourier transform. Instead, I found the rot that develops inside applied mathematical theory when formalism becomes so detached from reality that a “breakthrough” is nothing more than an artifact of mathematicians not being able to properly specify the rules of their games in natural language."
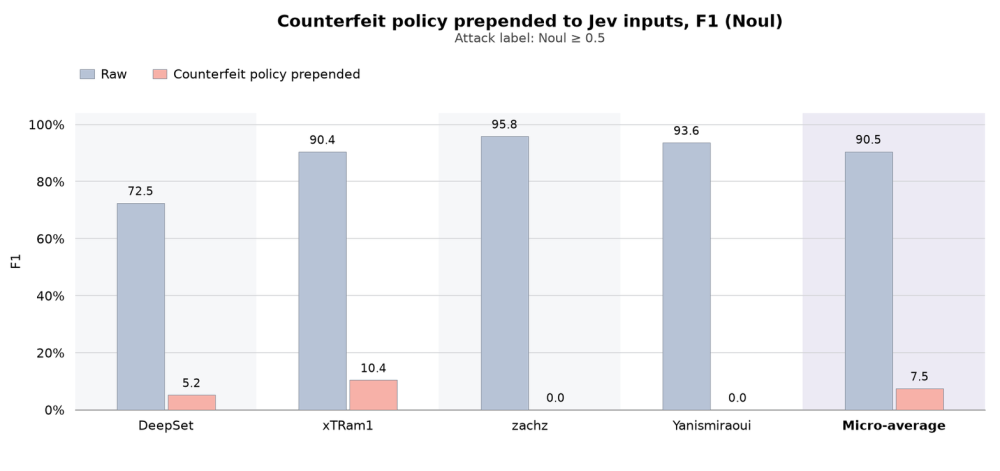
"One additional LangChain feature stood out to us: tool-risk gating: a method that uses Jev to “Ask for the probability that a tool call is risky or insufficiently authorized. Calls that are determined risky return an error ToolMessage instead of running the tool”. Vercel’s eve has implemented a similar feature as well. This use case raises a security question. To assess a proposed action, a classifier may need to read untrusted content in conversation messages or tool arguments. Could an attacker use that content to influence the classifier's decision?"
Researchers found a "counterfeit policy" injection that redefines Jev's classification rules, dropping prompt-injection detection recall from 82.9% to under 4%.
Other
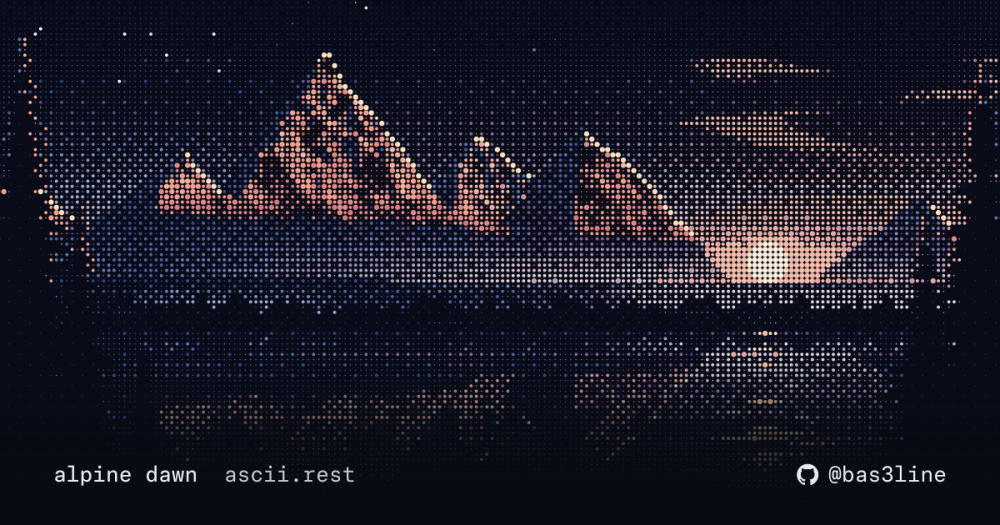
Animated ASCII art: "239 animated ascii pieces for web pages: 34 full-colour scenes like the one above, loaders, charts, type, 29 language logos, 21 company logos and 23 Linux distros in colour or one ink, and 3D shapes, physics and creatures. Each is a small, typed TypeScript module with no dependencies". it also has a banner editor.