649: quantum of sollazzo
Hello, reader!
Quantum #648 had an open rate of 44% and a click rate of 5%. The most clicked link was this heatmap approach to diff in code reviews.
I must apologise for messing up the sending process last week. Most of you received the non proof-read preview on Friday, which was intended just for the proofreader and a few previewers; then I screwed up the scheduling and the non-proof-read version was, again, sent on Monday instead of Tuesday. Not my best week. Sorry.
Topical
NashTech Connect keynote session: AI eats the world, by Benedict Evans
I added this last week but there was no video available. The good folks at NashTech have now released it
We are so so so early! (But early to what, exactly?)
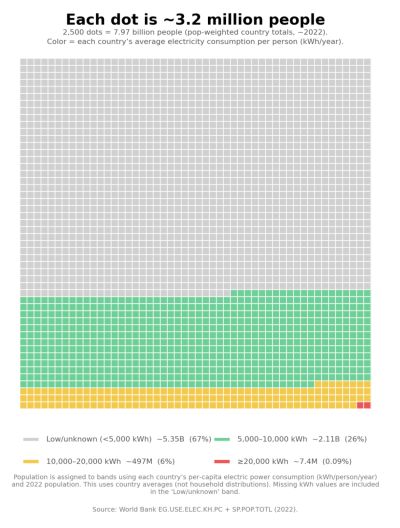
Harvey Lewis challenges the popular "we are early" AI narrative. He asks what happens if we compare access to AI with other global "access" issues: wealth, clean water, healthcare, and sanitation access. It comes with a brilliant dot chart.
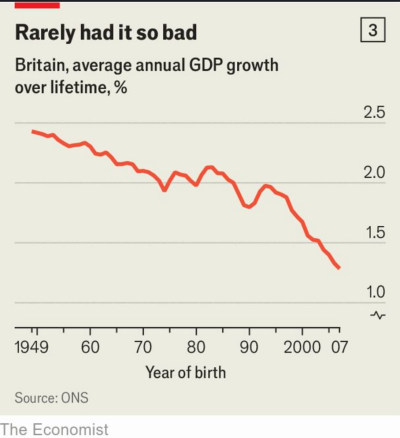
Owen Winter's LinkedIn Post on GDP Growth and Political Outlook
The Economist's Owen Winter has published this great chart showing how British people in different age brackets have lived through evolving GDP standards.
Shades of a Lunar Eclipse
On March 3, 2026, there was a total lunar eclipse visible throughout the Americas, East Asia, Australia, and the Pacific. It produced a "Blood Moon" with an orange-red shade. Scientists at the NASA Earth Observatory released satellite images about it.

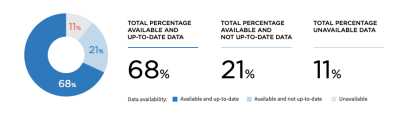
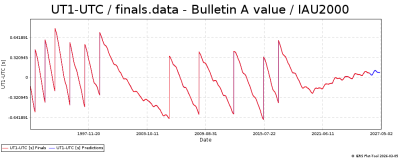
The State of Open Humanitarian Data 2026
From the United Nations OCHA (Office for the Coordination of Humanitarian Affairs ), this is this year's report about humanitarian data availability (PDF), which seems to still be going strong despite funding challenges.
Jane Street depends on all sorts of messy, real-world data to understand financial markets and the global economy: think world news, decades of weather patterns, deidentified credit card spending, or packet captures of stock exchange market data feeds.
We're hiring Data Engineers to turn datasets like these into reliable inputs for trading. Working closely with our researchers, you'll evaluate unfamiliar datasets, build robust ELT pipelines, develop deep domain expertise, and decide what's worth exploring next.
The job requires a mix of engineering, data analysis, and product sense. If you love the detective work of investigating a weird dataset and figuring out what it actually means, we want to hear from you. No financial background is necessary.
We have openings in New York, London, and Hong Kong.

Tools & Tutorials
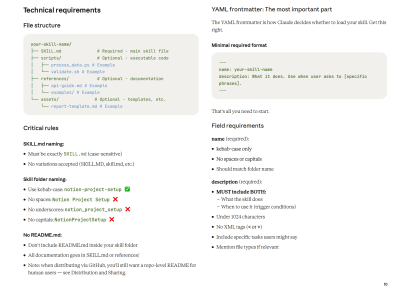
The Complete Guide to Building Skills for Claude
The Synthetic Data Playbook: Generating Trillions of the Finest Tokens
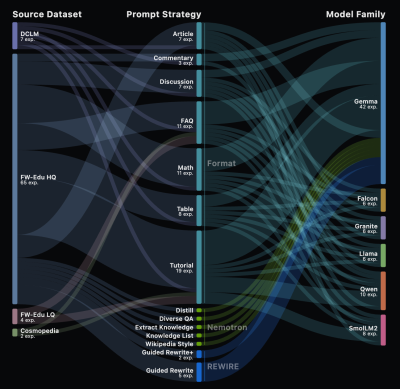
"How to turn noisy web text into state-of-the-art pretraining data with the right prompts, models, and infrastructure". Basically, a HuggingFace guide on synthetic data generation for AI training purposes. "We ran 90 experiments, generated over 1 trillion tokens, and spent 12.7 GPU years to find the best recipe for synthetic pretraining data. The result is FinePhrase, a 486B token dataset that clearly outperforms all existing synthetic data baselines. It’s available on the Hub, and this post walks you through everything we learned along the way."
Pandas vs. Polars: A Complete Comparison of Syntax, Speed, and Memory
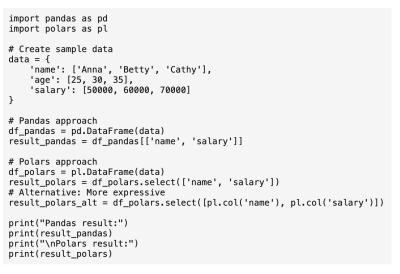
"Need help choosing the right Python dataframe library? This article compares Pandas and Polars to help you decide."
Polars seems to demonstrate significant speed advantages, reading CSV files 8.2x faster than Pandas and showing 30-70% memory improvements. You may or may not like the syntax, though, and Panda's ecosystem is definitely bigger as things stand.
Downscaling solar radiation in the Canary Islands with GAM
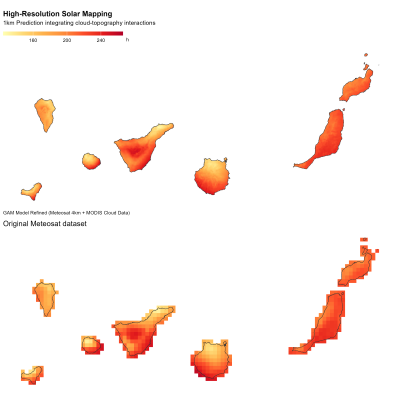
Dominic Royé shows statistical downscaling of monthly solar radiation data for the Canary Islands using Generalized Additive Models (GAM). It takes 5km Meteosat data and re-predicts it to a finer 1km resolution grid.
"The Canary Islands offer a particularly compelling test case for downscaling because of their extremely complex orography and sharp local climate gradients."
Data Visualization Comparison
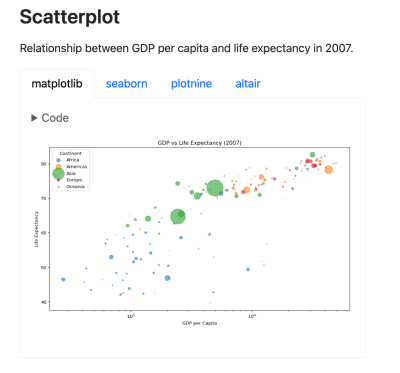
A comparison of four popular Python visualization libraries (matplotlib, seaborn, plotnine, and altair). It uses the Gapminder dataset, demonstrating various plot types: scatterplots, line plots, bar charts, histograms, and choropleth maps.
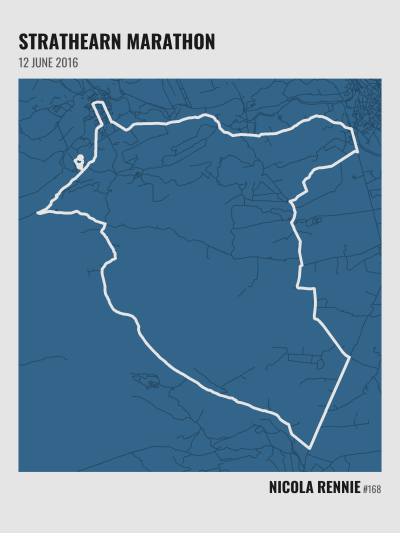
Create custom GPS route maps in R
Nicola Rennie's latest tutorial on how to create custom printable GPS route maps in R. It covers loading GPS data from .gpx files (from running watches, apps, or Strava-like websites), processing the data using the sf package, and adding contextual background maps from OpenStreetMap via the osmdata package.
Outgrowing your laptop with R and Positron
Julia Silge's talk slides about using Positron for handling data that exceeds laptop capacity, with the recorded session available on YouTube.
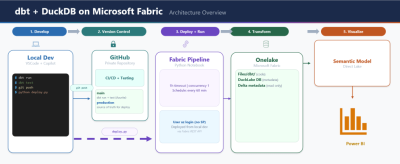
Building a Data Pipeline Using VSCode and Claude Out of Thin Air
"A complete data pipeline running on Microsoft Fabric that downloads public data, transforms it into a star schema, exports it as Delta Lake tables, and serves it through a Power BI semantic model with Direct Lake — all from a single Python notebook and using pure SQL"
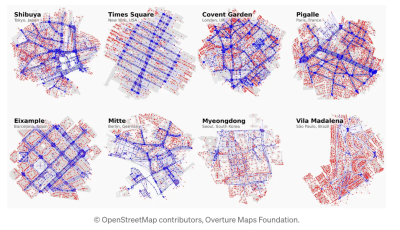
How to Use Overture Maps Like OSMnx — by City2Graph
I'm a big fan of OSMnx, so it's great to see its approach translated to other map sources. "City2Graph brings Overture Maps to spatial network analysis."
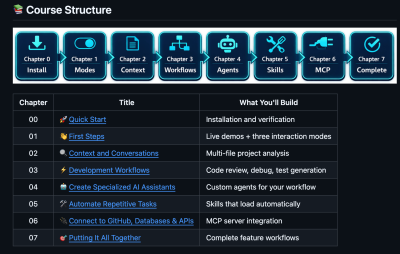
copilot-cli-for-beginners
"Learn how to get started using the GitHub Copilot CLI!". This hands-on course progresses from installation to advanced workflows using a Python book collection app as the learning project. Topics include code review, test generation, debugging, creating custom AI agents, automating tasks with skills, and connecting to databases and APIs through MCP servers.
Learning Opportunities: A Claude Code Skill for Deliberate Skill Development
This is brilliant. It's a Claude Code plugin that implements an adaptive "dynamic textbook" approach. Basically, it probes devs with learning exercises during AI-assisted coding.
Data Thinking
The Linux Kernel Will Soon Be MIT-Licensed and Copyleft Will Be Dead Within 5 Years
Coding LLM tools are enabling rapid "clean room" reimplementations of GPL software, re-licensed as MIT. A developer recreated the popular Python chardet module (170 million downloads) in just 5 days using AI, with ensuing drama. But I think this is unavoidable now.
Daylight savings broke software (again) and other Time News!
Daylight savings time in the US caused Claude AI to break when scheduled tasks set for 2AM entered an infinite loop as clocks jumped from 1:59AM to 3:00AM. This is partly caused by Earth's rotation acceleration since 2020 (which reverses the normal slowdown trend). Time is confusing.
ZIP Code First
The webpage advocates for a new way of entering addresses in web forms so that the ZIP code field comes first in US address forms. This is because a 5-digit ZIP code can automatically determine city, state, and country, eliminating the need for users to manually enter these fields. The argument would still be valid in the UK (although, as you probably know, PAF has a complicated history).
Keep your robotic hands off my shoelaces!
[Gianfranco](https://www.linkedin.com/pulse/keep-your-robotic-hands-off-my-shoelaces-gianfranco-cecconi-iowre) Cecconi: "Imagine you had a machine close to your main entrance to your apartment that could tie your shoelaces every time you’re leaving and untie them every time you came back home. Do you think you would still remember how to do it after one week? Yes. After one month? Yes. After one year?... I believe I would feel a bit uncomfortable, like someone asking me to cut my own hair (and my hair is easy!).".
Dataviz, Data Analysis, & Interactive
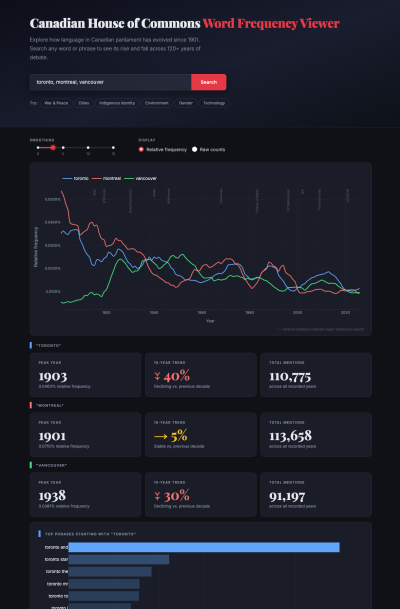
Canadian House of Commons N-gram Viewer
Adam Vert launched an N-gram viewer for the Canadian House of Commons. It's pretty outstanding, and it's giving me a lot of ideas for improving my UK one.
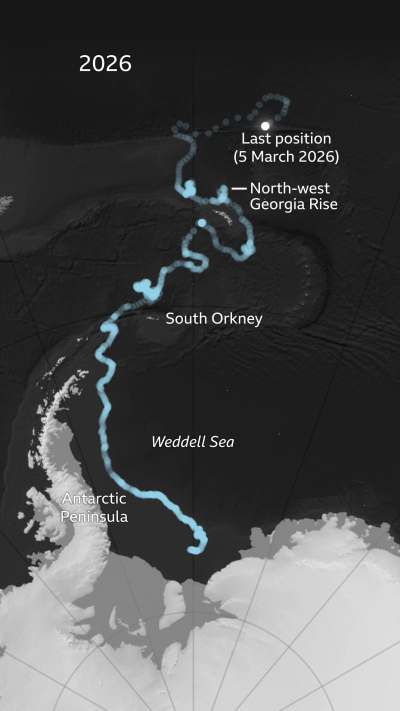
This iceberg was once the biggest in the world. Now it has just weeks left
A23a, once the world's largest iceberg covering an area twice the size of Greater London, is in its final weeks after a 40-year journey since calving from Antarctica's Filchner Ice Shelf in 1986.
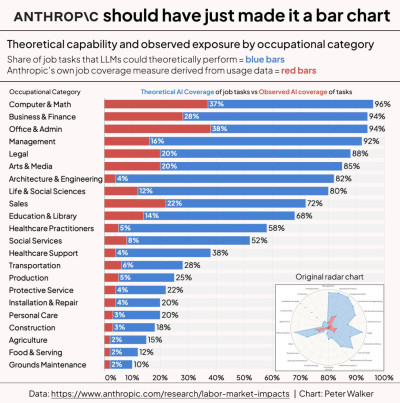
Rethinking Radar Charts: A Bar Chart Alternative
Another interesting take on "that" bar chart by Anthropic.
(via Guy Lipman)
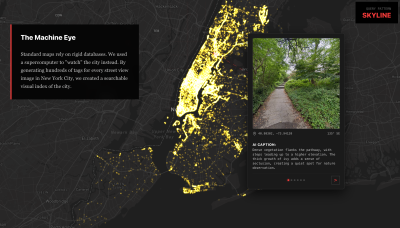
The City That AI Sees
"We ran a Vision Language Model on millions of images of New York City. This is the first open-vocabulary semantic atlas."
(via Maurizio Napolitano)
UX Mobility: Multi-User Walkability Route Planner
The UX Mobility project has developed a multi-user pedestrian route planner for Milan that prioritises walkability, trying to fit in with diverse user needs rather than shortest distance.
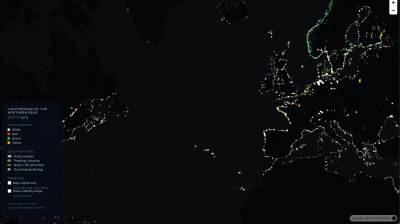
Lighthouses of the Northern Seas
An interactive [map](https://lighthouse-atlas.netlify.app/#3/48/-300 of lighthouses.
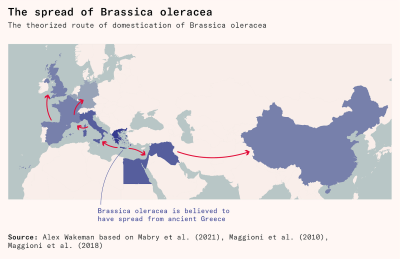
How an unappetizing shrub became dozens of different vegetables
The wild cabbage plant (scientific name Brassica oleracea) is the common ancestor of cabbage, broccoli, Brussels sprouts, cauliflower, kale, and many other vegetables, that were developed by selective breeding. Works in Progress tells its story.
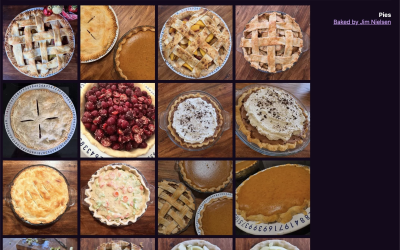
Two of My Favorite Things Together at Last: Pies and Subdomains
Jim Nielsen: "I want an archive of all the pie pics I’ve snapped.". And he's created it.
The real reason why this captured my attention is also in the description of how to download photos from Instagram after the dismissal of its API.
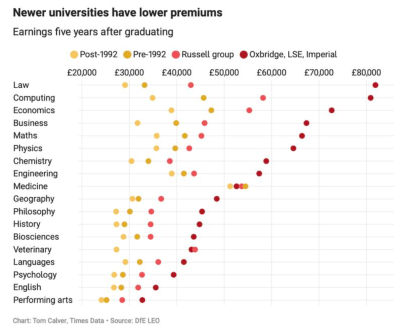
Which university course had the most full-time undergraduates last year?
The Times' Tom Calver looks at the average income of university graduates, finding that post-1992 universities graduates tend to earn less.
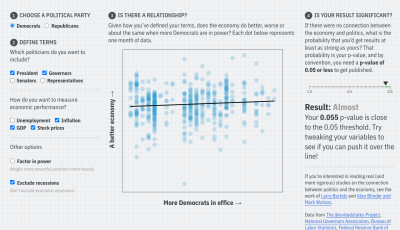
Hack Your Way To Scientific Glory (recreation)
"You’re a social scientist with a hunch: The U.S. economy is affected by whether Republicans or Democrats are in office. Try to show that a connection exists, using real data going back to 1948. For your results to be publishable in an academic journal, you’ll need to prove that they are “statistically significant” by achieving a low enough p-value."
This is an interactive recreation of FiveThirtyEight's "Hack Your Way To Scientific Glory" tool, rebuilt using Observable JS to demonstrate p-hacking in social science research.
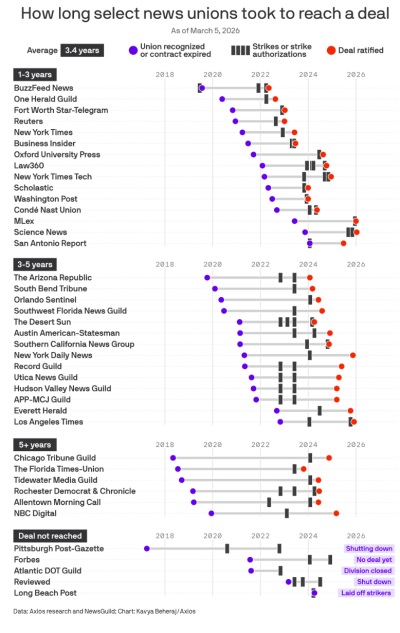
Newsroom strike surge
Axios highlights a shift towards more litigious employment relationship in the media sector.
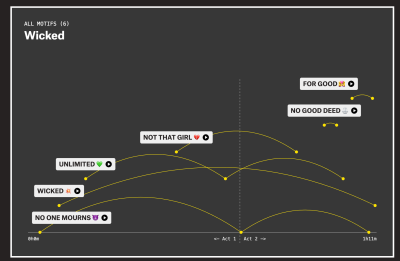
How musicals use motifs to tell stories
The Pudding analyses how musical theater uses recurring melodic motifs to convey narrative and emotional information.
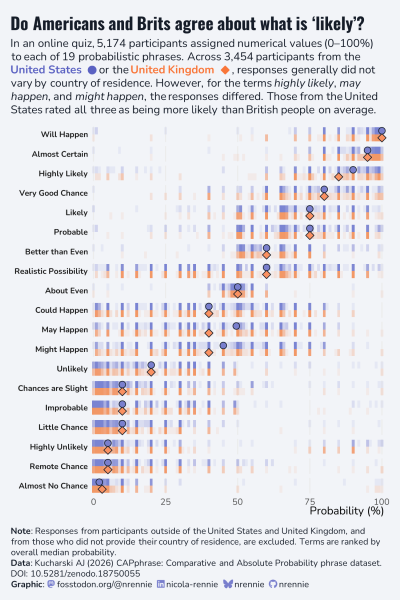
How likely is 'likely'?
Another great chart by Nicola REnnie, with source code. It analyses the famous "probability perception" dataset assembled by Adam Kucharski.
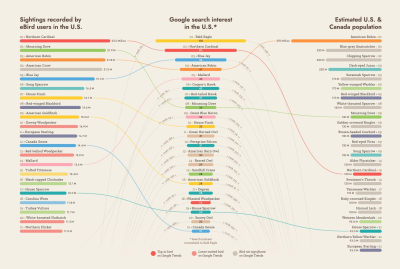
Searching for Birds
An analysis of Google search data via Google Trends interest in birds.
AI
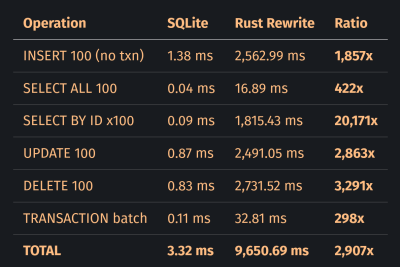
Your LLM Doesn't Write Correct Code. It Writes Plausible Code.
An LLM-generated Rust rewrite of SQLite performs 20,171 times slower than the original on basic primary key lookups (0.09ms vs 1,815.43ms), despite compiling successfully, passing tests, and appearing architecturally correct. Another example of: don't just trust AI writing code!
The era of local agents is here
10 Downing Street's Innovation Fellow Arthur Turrell explains his setup for local LLMs.
Why I'm not worried about AI causing mass unemployment
"Software didn't eat the world and AI won't either", argues Timothy B. Lee.
The Top 100 Gen AI Consumer Apps
Andressen Horowitz's Gen AI market analysis: "ChatGPT is still far and away the largest consumer AI product. On web, it is 2.7x larger than the #2, Gemini (measured by monthly traffic) — and on mobile, it is 2.5x larger (measured by monthly active users). ChatGPT has seen weekly active users grow by 500 million people over the past year to 900 million today. This is especially impressive given growth is difficult to maintain at scale — over 10% of the global population now utilizes ChatGPT every week."
AI job predictions are just hunches dressed up like facts
Amanda Shendruk, again on "that" Anthropic chart: "In actuality, these numbers are all guesses."
The spectator at the desk - On the troubling emptiness of extraordinary productivity
Harry Metcalfe: "I’m a big fan of working with AI. I use it a lot. I think we’re at the beginning of something transformative. But it’s going to throw up some difficult problems. This is a post about one of them." This post contrasts AI-assisted work with traditional "flow states" experienced in hands-on craft like wood turning or deep coding, arguing that vibe coding misses the experience where direct connection between person, tool, and material creates meaning.
Other
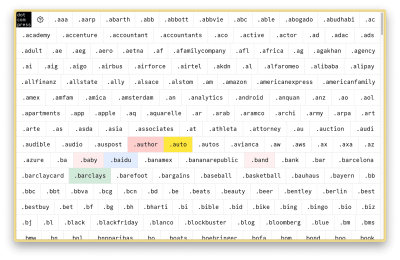
A Brief History of Domains
"This year, dot com turned 40". A nicely visualised story.
AMA – Ask Me Anything! Submit a question via this anonymous Google form. I'll select a few every 4-5 weeks and answer them on here :-) Don't be shy!

The Quantum of Sollazzo grove now has 40 trees. It helps managing this newsletter's carbon footprint. Check it out at Trees for Life.
'till next week,
Giuseppe @puntofisso.bsky.social