647: quantum of sollazzo
Hello, reader!
Quantum #646 had an open rate of 51% and a click rate of 15%.
The most clicked link was this useful collection of Modern CSS snippets.
Issue #647 comes with the announcement of a new sponsor: I'm delighted that for the next few weeks, trading firm Jane Street will be supporting Quantum. Jane Street is well known among the data crowd for using and contributing to the OCaml programming language, and various other open source initiatives.
'till next week,
Giuseppe @puntofisso.bsky.social
Topical
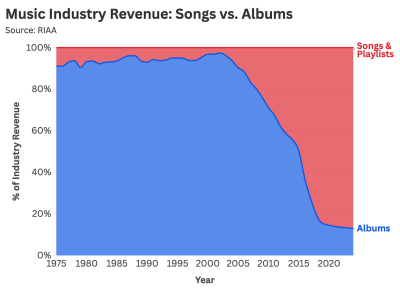
Are Albums Obsolete in the Streaming Era? A Statistical Analysis
"Do people still listen to albums? And why does this format still exist?".
Daniel Parris (StatSignificant) looks at the shifting patterns of album vs songs that have been triggered by the advent of streaming.
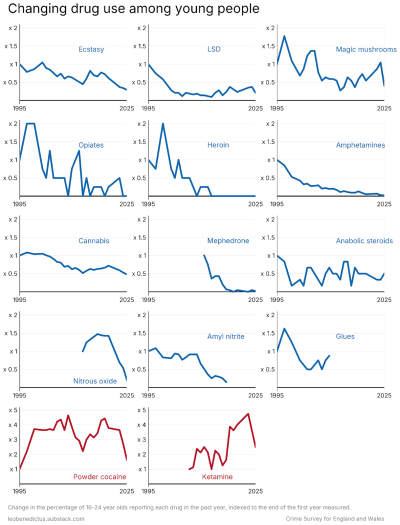
Have young people lost interest in drugs? 💊
Leo Benedictus investigates another shifting pattern of 21st century behaviours: drug use (in England and Wales).
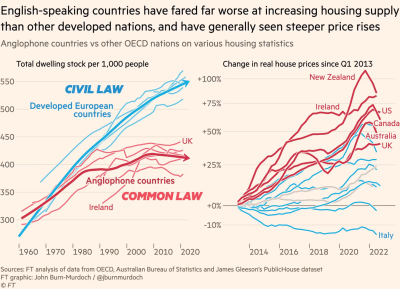
Common Law vs Civil Law in housebuilding
The Financial Times' visual guru John Burn-Murdoch offers an interesting take on why housebuilding in Common Law countries might be more difficult.
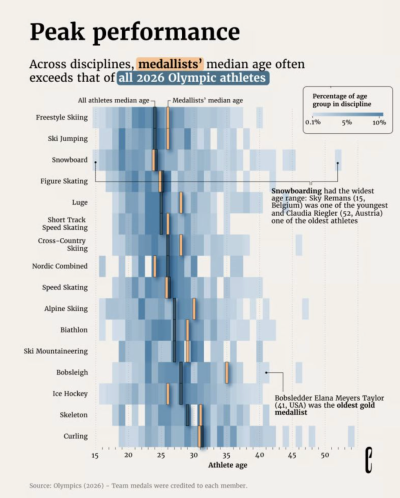
The 2026 Winter Olympics in Milano-Cortina have come to an end
Julia Knabe for The European Correspondent analyses the age of olympic athletes and their average medal-winning age across disciplines. It's notable how mean and median ages flip around.
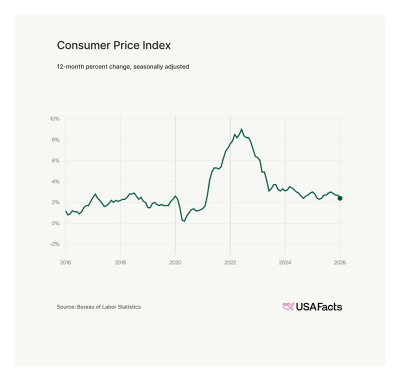
State of the Union 2026 Fact Sheet
USAFacts presents a data-driven analysis of key metrics ahead of President Trump's 2026 State of the Union address. It covers budget, the state of the economy, standards of living, education, immigration, and defense.
Jane Street depends on all sorts of messy, real-world data to understand financial markets and the global economy: think world news, decades of weather patterns, deidentified credit card spending, or packet captures of stock exchange market data feeds.
We're hiring Data Engineers to turn datasets like these into reliable inputs for trading. Working closely with our researchers, you'll evaluate unfamiliar datasets, build robust ELT pipelines, develop deep domain expertise, and decide what's worth exploring next.
The job requires a mix of engineering, data analysis, and product sense. If you love the detective work of investigating a weird dataset and figuring out what it actually means, we want to hear from you. No financial background is necessary.
We have openings in New York, London, and Hong Kong.

Tools & Tutorials
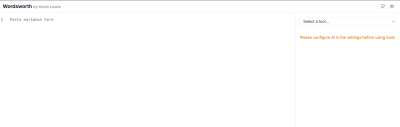
Wordsworth — Microtools for technical writers
Kevin Lewis has launched Wordsworth, a collection of microtools designed specifically for technical writers to improve their workflow and documentation quality. It uses various LLMs APIs.
How we rebuilt Next.js with AI in one week
Cloudflare rebuilt Next.js from scratch in one week using AI. The result is "vinext"m a drop-in replacement built on Vite that deploys to Cloudflare Workers. It is remarkable that they blogged about this openly, with good patterns to follow.
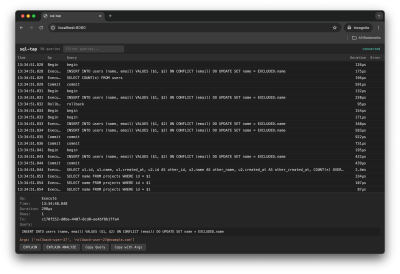
sql-tap: Watch SQL traffic in real-time with a TUI
"Watch SQL traffic in real-time with a TUI". sql-tap is a real-time SQL traffic viewer, capturing and displaying every query without requiring code changes. It supports interactive inspection, transaction viewing, and EXPLAIN commands through an intuitive terminal interface.
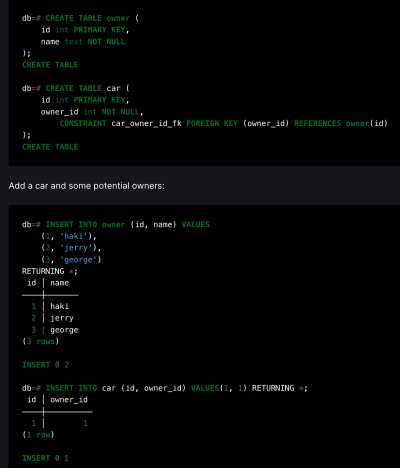
Row Locks With Joins Can Produce Surprising Results in PostgreSQL
Haki Benita: "Here's a database riddle: you have two tables with data connected by a foreign key. The foreign key field is set as not null and the constraint is valid and enforced. You execute a query that joins these two tables and you get no results! How is that possible? We thought it wasn't possible, but a recent incident revealed an edge case we never thought about."
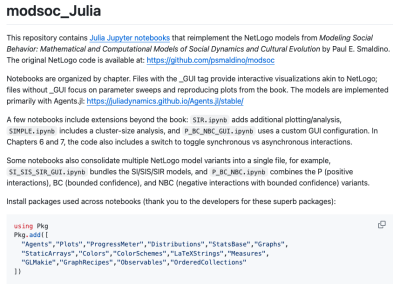
modsoc_Julia: Modeling Social Behavior in Julia
This is a GitHub repo with notebooks that reimplement NetLogo models into the Julia Programming language, from Paul E. Smaldino's book "Modeling Social Behavior: Mathematical and Computational Models of Social Dynamics and Cultural Evolution". It's MIT Licensed.
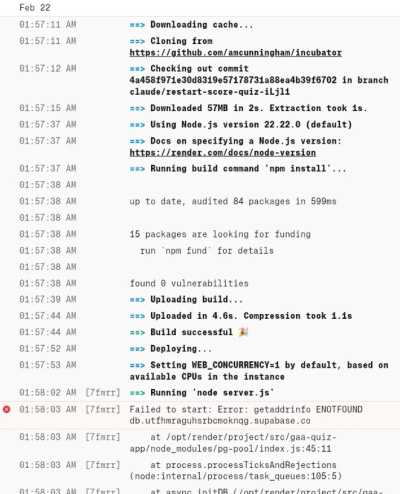
I built a full-stack web app in a weekend. I'm a GP, not a developer.
GP Anne-Marie Cunningham has built a full-stack quiz preparation web app in a weekend using Claude Code AI assistant, and tells us about her experience. She had almost no coding experience before, and has created this app using her phone.
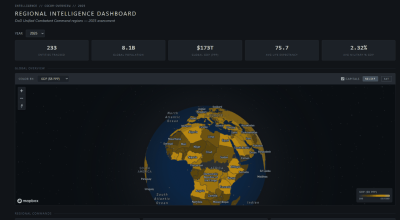
CIA World Factbook Archive
A user-generated [digital](https://cia-factbook-archive.fly.dev/) archive of the CIA World Factbook spanning 1990-2025, including analysis tools and data visualizations.
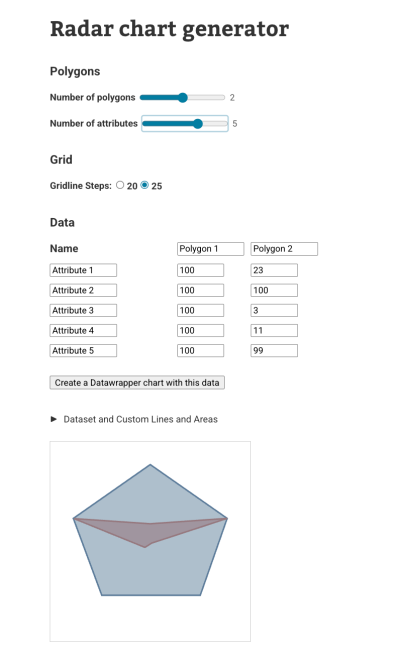
Personalities on the radar
Michi Do Thoi from Datawrapper created a radar chart generator tool that works within Datawrapper's scatter plots.
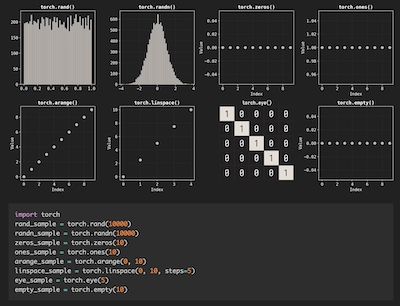
Introduction to PyTorch
A simple, visual introduction PyTorch, the popular open-source deep learning framework developed by Meta and now part of the Linux Foundation. It demonstrates building a simple neural network for London house price prediction using tabular data.
LadybugDB - Embedded Columnar Graph Database for Highly Regulated Industries
LadybugDB is an "embedded columnar graph database" and promises to be much faster than the alternatives. It's also open source.

OpenSeaDragon
OpenSeaDragon is an "open-source, web-based viewer for high-resolution zoomable images". It's pure JavaScript and works on desktop and mobile.

Sprites on the Web
Josh Comeau explains how to implement sprite-based animations on the web using CSS, like videogames. The implementation uses the CSS steps() timing function.
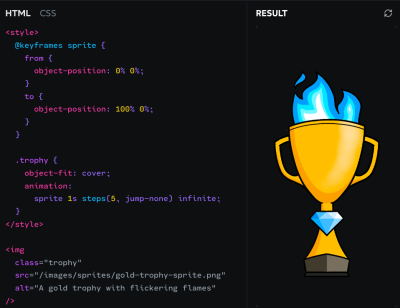
Image Compare Web Component
Image Compare is "a tiny, zero-dependency web component for comparing two images using a slider. Built with a focus on accessibility, performance, and progressive enhancement."

Data thinking
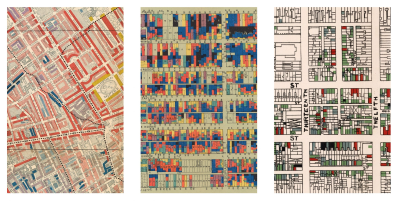
The Geometry of Inequality - by RJ Andrews - Chartography
RJ Andrews (Chartography) illustrates 200 years of visualizing economic inequality.
"This parade vision is how Dutch economist Jan Pen gave readers a visceral introduction to economic inequality data in his 1971 book Income Distribution. Pen’s parade is modern and playful. But the impulse behind it, to make inequality visible, is much older."
2028 - THE GREAT DATA RECKONING
"What if AI disruption hits the data industry hardest — and what if data professionals built the tools that made it possible?" This (speculative) scenario explores how AI disruption could devastate the data industry by 2028, with unemployment for data professionals reaching high levels.
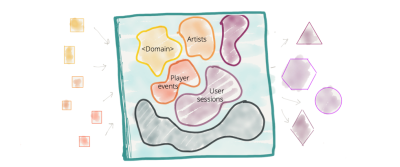
How to Move Beyond a Monolithic Data Lake to a Distributed Data Mesh
This blog post advocates for the data mesh: "Data platforms based on the data lake architecture have common failure modes that lead to unfulfilled promises at scale. To address these failure modes we need to shift from the centralized paradigm of a lake, or its predecessor data warehouse."
Dataviz, Data Analysis, & Interactive
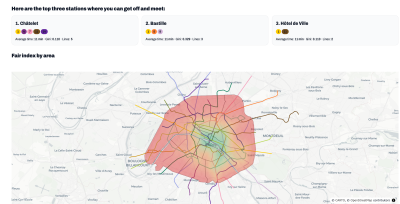
pariGINI - A Fair Meetup Location Tool for Paris
pariGINI (a brilliant) pun/portmanteau on the Italian word for "parisians" – "parigini" – and GINI as in Gini Index) is a web tool to help friends find fair meeting locations, considering where everyone lives and minimizing travel time disparities. Methodology also fully shared.
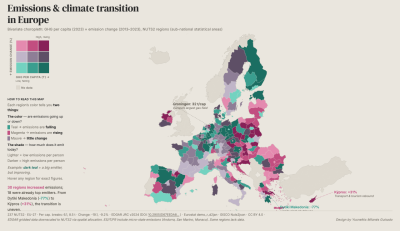
Bivariate Map: GHG Emissions & Climate Transition in the EU
An interactive bivariate map displaying greenhouse gas emissions data across EU regions using a dual-encoding color system.
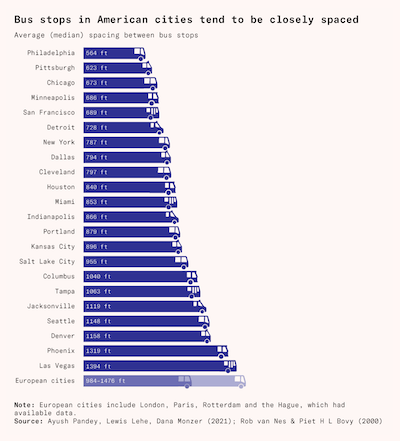
The United States needs fewer bus stops
"Bus stop balancing is fast, cheap, and effective. It can turn a service people tolerate into one they’re happy to use."
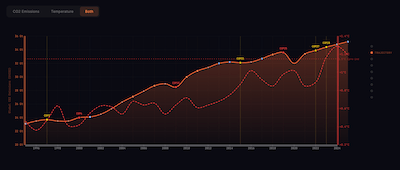
Good COP, Bad COP
"30 climate summits. $17.8 billion spent. 2.9 million tonnes of CO2 emitted.
And global emissions rose 52%."
This is obviously a critical take, but the dataviz included are an act of love.
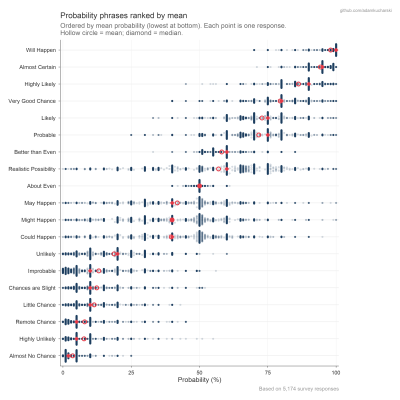
CAPphrase: Comparative and Absolute Probability phrase dataset
Academic and entrepreneur Adam Kucharski has launched an analysis of how over 5000 online quiz participants interpret common probability phrases through two-part testing. It's pretty interesting and love the sharing of all the code.
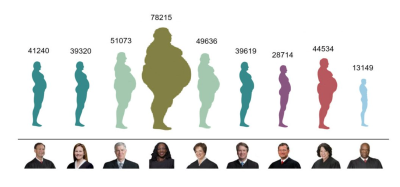
Body shaming as dataviz?
Not entirely sure this is a good idea for multiple reasons, but there's some history behind this: "the number of words spoken by each Supreme Court Justice in 2023 in the form of fat guys". Adjacent: Chernoff faces.
(via Peter Wood)
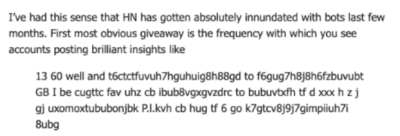
New accounts on HN 10x more likely to use EM-dashes
Analysis by Marginalia of Hacker News comments illustrates that recently registered accounts are suspiciously using revealing LLM patterns.
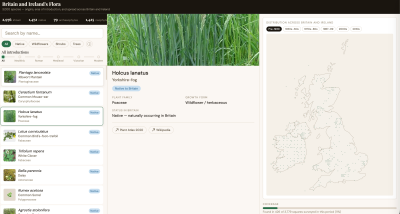
Britain and Ireland's Flora – inspired by The Rolling Stones
Steven Feldman has done another one of his LLM-driven maps and blogged about it.
The map allows users to search and filter species by Latin and common names, view images via Wikimedia, and see coverage maps across six survey periods from pre-1930 to 2010s, revealing patterns of species spread or decline across Britain and Ireland. The map-based dataviz is pretty lovely.
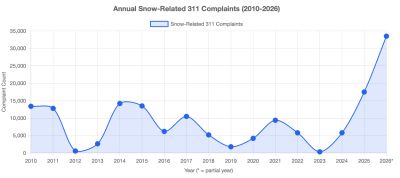
NYC Snow Analysis 2010-2026 with Claude Cowork
Data activist Joel Natividad conducted an analysis of New York City's 311 data using Claude Cowork: 24GB of data containing over 42 million rows spanning 15 years of operational history.
AI
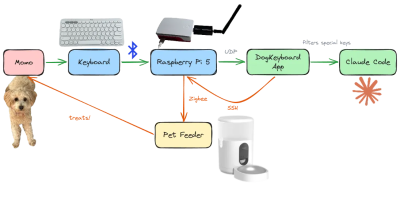
I Taught My Dog to Vibe Code Games
Hilarious. "The key to making this work is telling Claude Code that a genius game designer who only speaks in cryptic riddles is giving it instructions, add strong guardrails, and build plenty of tools for automated feedback." The project somewhat shows that AI-assisted development bottlenecks "lie in feedback loop quality rather than input quality".
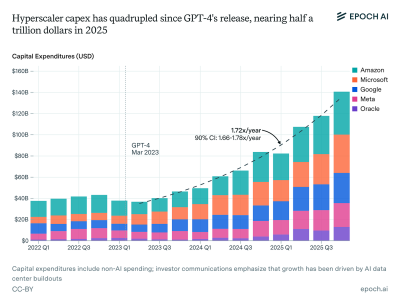
Hyperscaler capex has quadrupled since GPT-4's release, nearing half a trillion dollars in 2025
"Driven by investments in AI, hyperscaler capital expenditures have grown 70% per year since the release of GPT-4, nearing half a trillion dollars in total during 2025."
This chimes with what I've seen last week at a conference, where Ben Evans gave a keynote with his most up-to-date "AI eats the world" presentation.
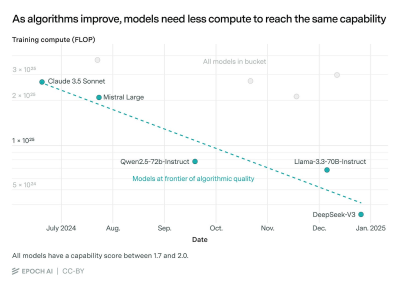
The least understood driver of AI progress - by Anson Ho
"An opinionated guide to “algorithmic progress” and why it matters"
IBM stock dives after Anthropic points out AI can rewrite COBOL fast
The Register: "IBM’s share price slumped by 13 percent on Monday, seemingly caused by investors reacting to an Anthropic blog post that points out its Claude Code tools can accelerate refactoring of apps written in the ancient COBOL language."
I've tried doing that with (an admittedly obscure) FORTRAN and it didn't work well.
A Guide to Which AI to Use in the Agentic Era
Ethan Mollick: "I have written eight of these guides since ChatGPT came out, but this version represents a very large break with the past, because what it means to “use AI” has changed dramatically. "
Interesting point: the top three frontier models are remarkably similar in capability, requiring only $20/month subscriptions for serious work, while free models are optimized for chat rather than accuracy. Mollick suggests beginners stick with one paid-for system, using the most advanced models to learn via prompting, while those more experienced should use specialised apps to manage real-world tasks.
Where does AI focus its attention in a text dataset?
Another amazing analysis by Adam Kucharski, this time about AI: "I gave the new Claude Sonnet 4.6 a set of 2000 short literary quotes and asked it to output the 10 most profound from this list. Most of the ones it returned appeared very early on in the dataset."
The Quantum of Sollazzo grove now has 40 trees. It helps managing this newsletter's carbon footprint. Check it out at Trees for Life.
AMA – Ask Me Anything! Submit a question via this anonymous Google form. I'll select a few every 4-5 weeks and answer them on here :-) Don't be shy!