641: quantum of sollazzo
#641: quantum of sollazzo – 20 January 2026
The data newsletter by @puntofisso.

Hello, regular readers and welcome new ones :) This is Quantum of Sollazzo, the newsletter about all things data. I am Giuseppe Sollazzo, or @puntofisso. I've been sending this newsletter since 2012 to be a summary of all the articles with or about data that captured my attention over the previous week. The newsletter is and will always (well, for as long as I can keep going!) be free, but you're welcome to become a friend via the links below.
641 is the 116th prime number.
Quantum #640 had an open rate of 52.46% and a click rate of 15.74%.
The most clicked link was the hilarious, AI-generated Burger King ad.
Quantum has a new sponsor for the next few issues!
Ed Freyfogle, organiser of geospatial meetup Geomob, co-host of the Geomob podcast, and co-founder of the OpenCage, has offered to introduce a set of points around the topic of geocoding.
See a few paragraphs below for an interesting look at addresses.
AMA – Ask Me Anything!
I received a few good questions through the last few weeks of my AMA form. Here's two, both from an anonymous reader.
You've worked in a range of different public sector organisations and government departments (I think). Thinking about data roles in the civil service, what criteria would you suggest using when evaluating which department to work for? And how much difference does the individual department make to the role?
I'm not sure if this is obvious to readers who have not worked in the Civil Service, but a fundamental truth is that while there are similarities across Government in terms of recurrent featured (both negative, like lamented blockers, difficulties to effect change, etc, but also positive such as very passionate colleagues), each Department will have its specific culture and, beyond that, each team will tend to be its own thing. So it's hard and it would be wrong to make sweeping statements. Two elements can be useful, both stemming from personal experience.
The first is that the theme of work of the Department may or may not an important variable to consider. At the beginning, it was for me. For example, I worked at the Department for Transport and I totally loved – I'd have loved regardless of structures or other criteria because I love transport, and I really wanted that experience. It might not be the same for everyone, and at one point of my career I've also started to appreciate that working in unfamiliar territory is useful to grow in my understanding of data issues.
The second is that evaluating how the data team came to exist is useful information to assess whether a role is a good fit. This evaluation has two dimensions. The first is to know which part of the organisation the team is in. In the Civil Service data teams start often in two places: either under the Chief Analyst, getting an analytical/data science spin, or under the Chief Digital Officer, with a more data engineering focus. Less commonly, also under the Chief Financial Officer. This is obviously a simplification, and sometimes these teams might be under the same director, but knowing where it started, how it moved, how it developed, and how the grade of the top data professional in the organisation changed over time, tells a lot about the organisation and its support for data.
One of my hobbies is doing genealogy. My family tree now spans 7 generations including 770 individuals in over 250 families. The "usual" display of this tree is huge and contains many areas of white space. I have used the "dot language to generate a more compact representation, but is is hard to follow the connections between individuals forming marriages. What is the most compact printed representation that maintains the clarity of the "standard" graph, and what is the algorithm for generating it?"
And this, dear reader, I totally fail to answer :) I have no idea because all I can think of is a tree or dynamic variations of a tree. So I'm putting this here with an open invite: can you answer this question? If so let me know, and I'll publish the best replies!

The Quantum of Sollazzo grove now has 40 trees. It helps managing this newsletter's carbon footprint. Check it out at Trees for Life.
'till next week,
Giuseppe @puntofisso.bsky.social
✨ Topical
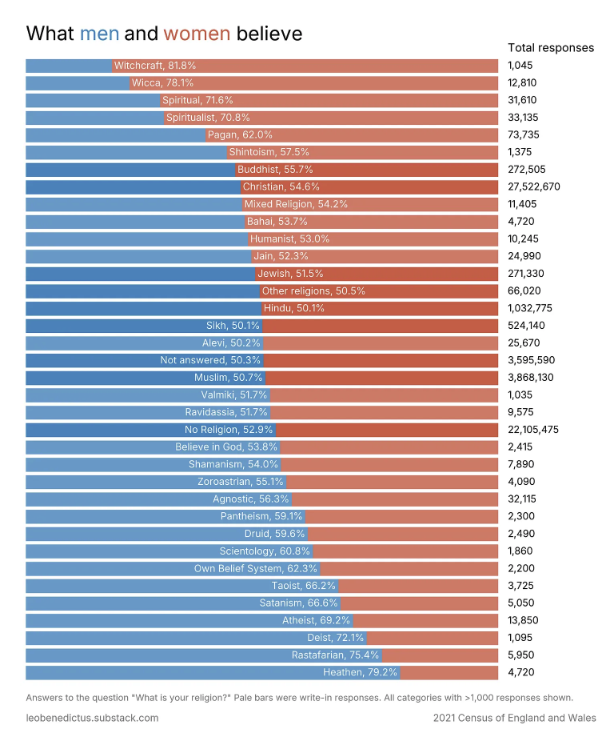
Which religions do men and women prefer? 🧙
Leo Benedictus has been looking at UK Census data again, with quite a few interesting analyses and charts.
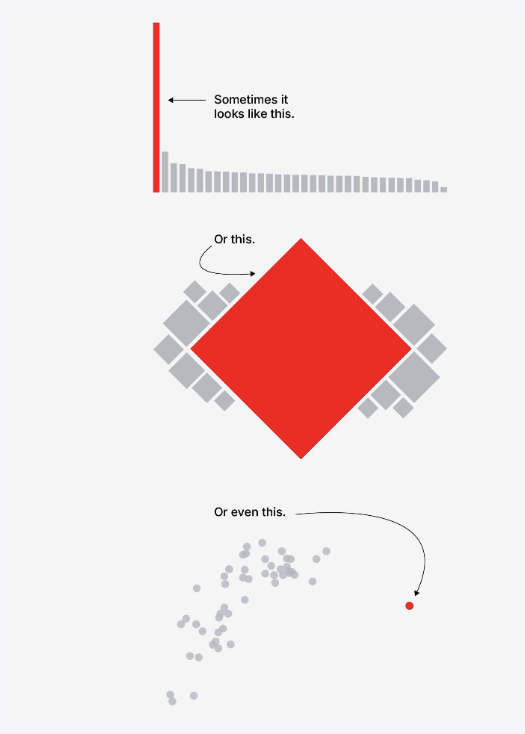
America isn't exceptional — it's the exception
American Exceptionalism visualized by Amandda Shendruk (Not-Ship).
Addresses, and why they can be a nightmare.
Good news: Open, global datasets like OpenStreetMap make getting lots geodata easier than ever.
Bad news: Now you have to sort through it, which can be an i18n nightmare.
Example: Given this geodata for a location in Spain - which address would a normal person expect?
"components": {
    "ISO_3166-1_alpha-2": "ES",
    "ISO_3166-1_alpha-3": "ESP",
    "ISO_3166-2": [
        "ES-CT",
        "ES-B"
    ],
    "_category": "building",
    "_normalized_city" : "Barcelona",
    "_type": "building",
    "city": "Barcelona",
    "continent" : "Europe",
    "country" : "Spain",
    "country_code" : "es",
    "county" : "Barcelon\u00e8s",
    "county_code" : "B",
    "house_number" : "66-68",
    "political_union" : "European Union",
    "postcode" : "08017",
    "province" : "Barcelona",
    "quarter" : "les Tres Torres",
    "road" : "Carrer de Calatrava",
    "state" : "Catalonia",
    "state_code" : "CT",
    "suburb" : "Sarri\u00e0 - Sant Gervasi"
},
At OpenCage we’ve open-sourced the templates we use to convert address data into well formatted strings for the 240+ territories around the world, so we know the correct answer is Carrer de Calatrava, 66-68, 08017 Barcelona, Spain. This is just one of many small steps we’ve taken to make developer’s lives easier.
Anyone looking for an entertaining view of the technical complexity of addresses should read “Falsehoods programmers believe about addresses”. Meanwhile, in the category of not sure whether to laugh or cry, we have last year's news of the German town that voted “no” to adopting street names.
If your project calls for well-formatted addresses, give the OpenCage geocoding API a try.
![]()
🛠️📖 Tools & Tutorials
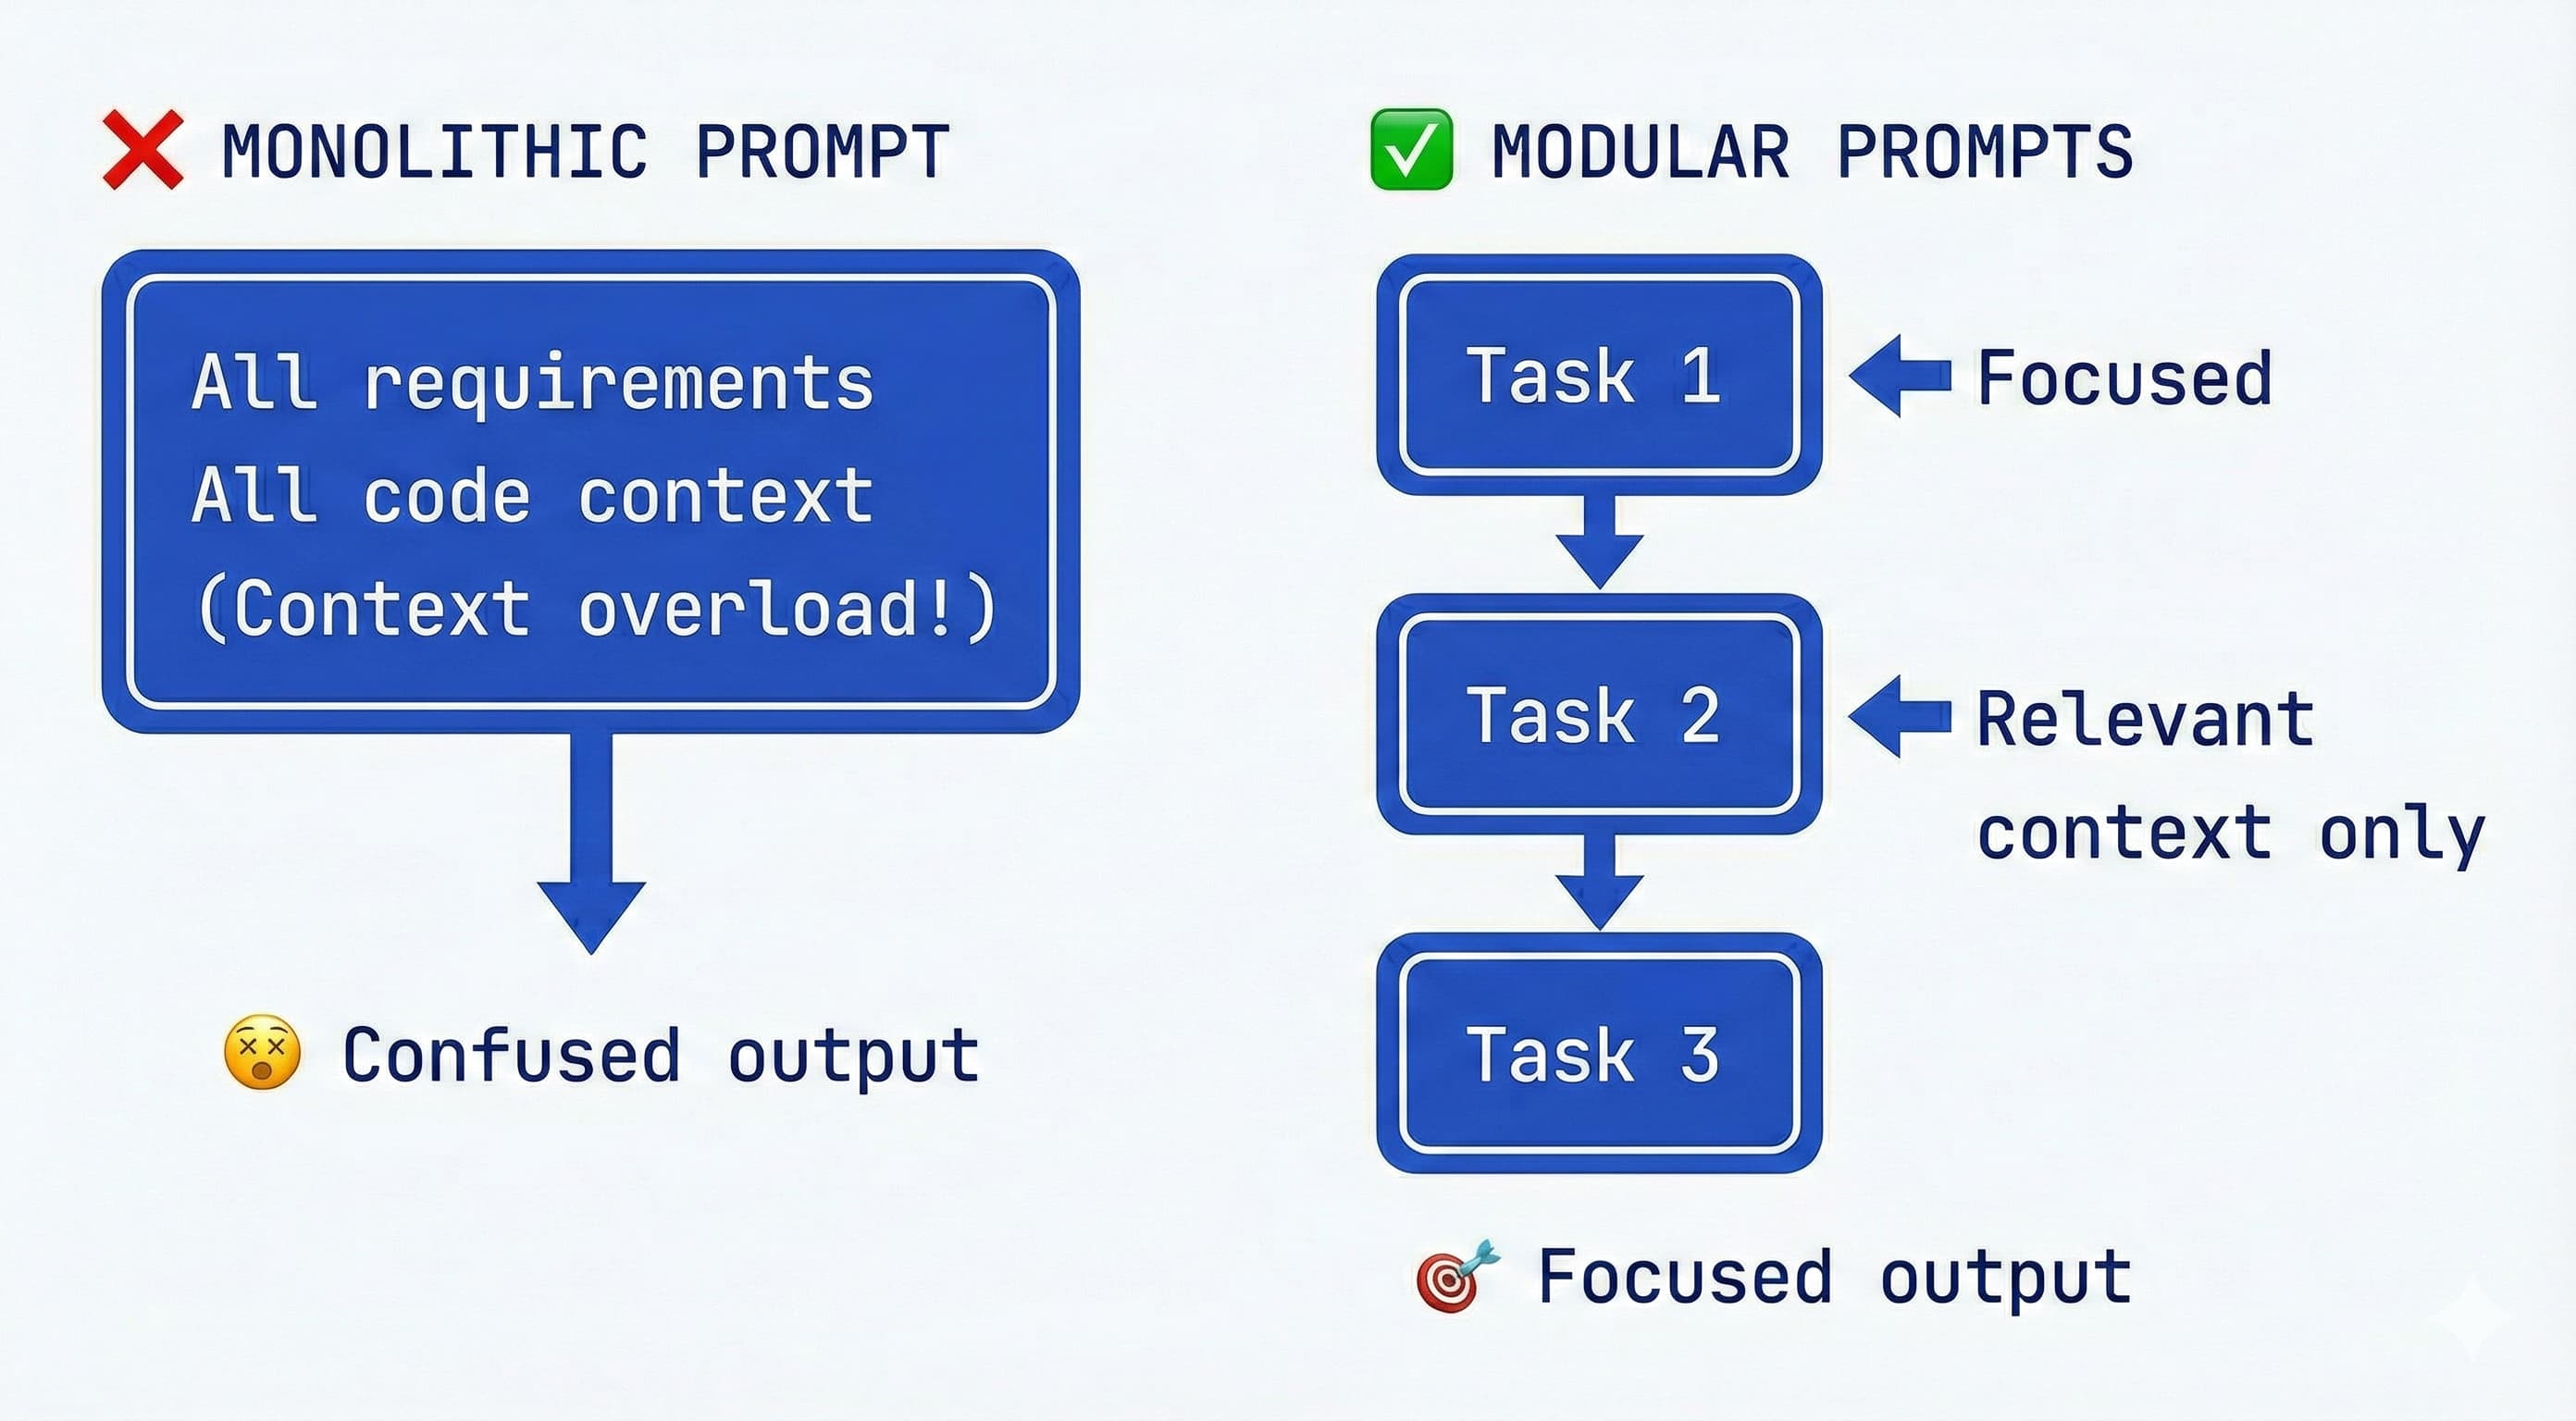
How to write a good spec for AI agents
"TL;DR: Aim for a clear spec covering just enough nuance (this may include structure, style, testing, boundaries) to guide the AI without overwhelming it. Break large tasks into smaller ones vs. keeping everything in one large prompt. Plan first in read-only mode, then execute and iterate continuously."
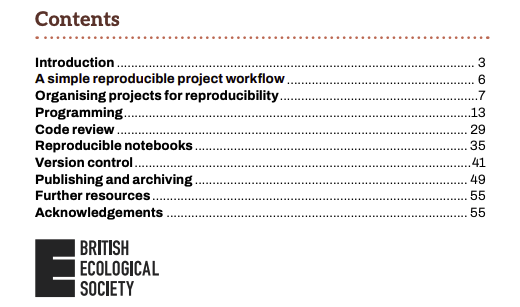
Reproducible code
A guide (PDF) by the British Ecological Society.
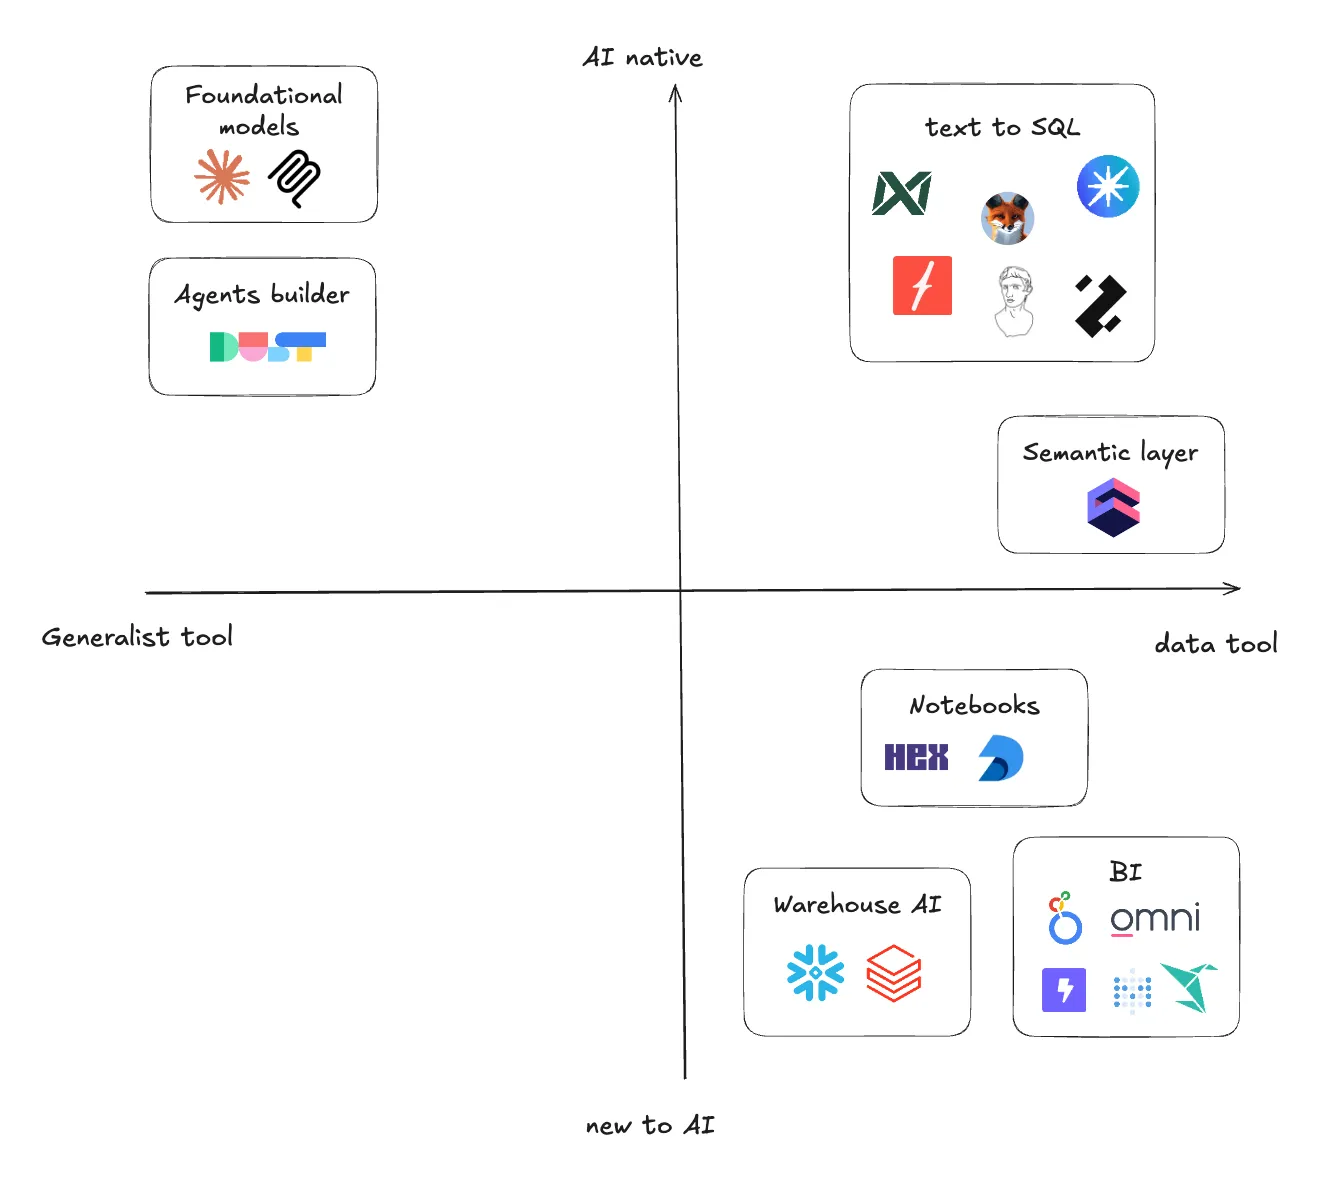
I tested 14 analytics agents - so you don’t have to
Claire Gouze: "Read my 2026 real-world benchmark for agentic analytics tools reliability, UX, cost"
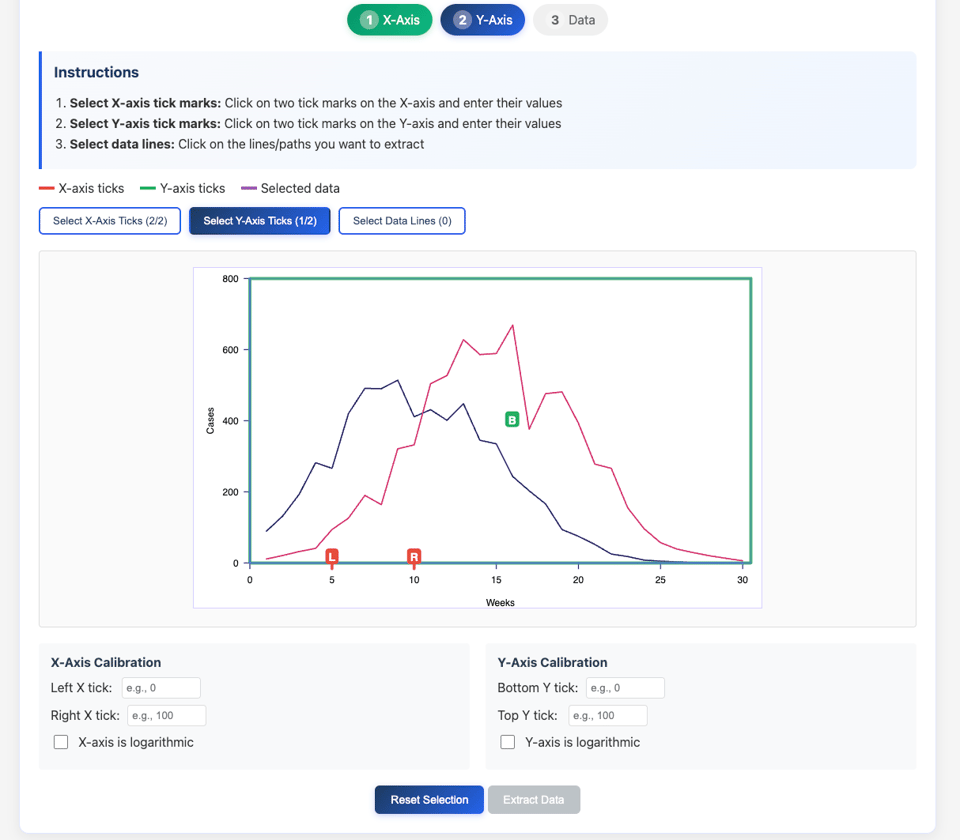
pdf2plot
"Extract data from PDF figures - all processing happens locally in your browser, no data is sent anywhere". Made by Professor Adam Kucharski.
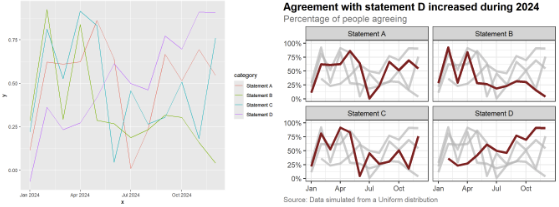
How to create a more accessible line chart
Nicola Rennie: "It’s a myth that accessibility means compromising on aesthetics."
Fabric.js
An HTML5 Canvas library with very useful features.
Advent of Claude: 31 Days of Claude Code
"A comprehensive guide to Claude Code's most powerful features, from quick shortcuts to advanced agent patterns."
Introducing the \<geolocation> HTML element
"From Chrome 144 you can use the new \<geolocation> HTML element. This element represents a major shift in how sites request user location data—moving away from script-triggered permission prompts toward a declarative, user-action-oriented experience. It reduces the boilerplate code required to handle permission states and errors, and provides a stronger signal of user intent, which helps avoid browser interventions (like quiet blocks)."
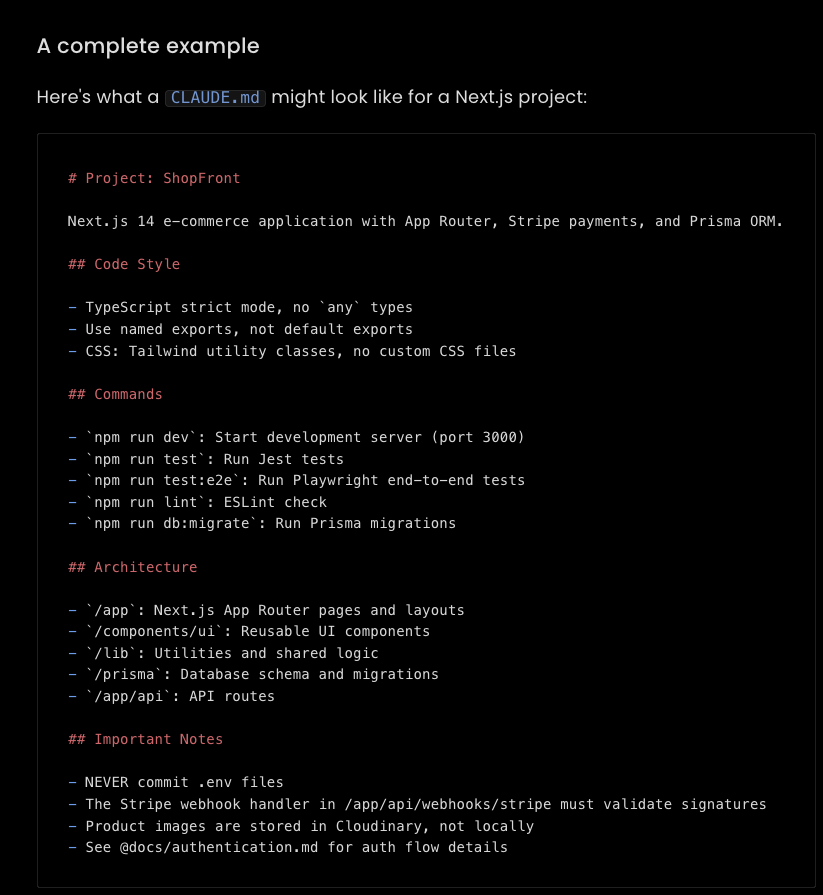
The Complete Guide to CLAUDE.md
"CLAUDE.md is a markdown file that Claude automatically reads at the start of each session. It holds project-specific instructions you'd otherwise repeat in every prompt. Structure, conventions, workflows, style. I've been iterating on my CLAUDE.md setup for a while now. This guide covers everything I've learned about creating, structuring, maintaining, and evolving these files. If you're using other AI coding tools, the same concepts apply to AGENTS.md (the equivalent file for Cursor, Zed, OpenCode, and other AI coding tools)."
🤯 Data thinking
A Diary of a Data Engineer
"You ingest data. You model it. You transform it. You serve it. Someone asks for a change. Everything breaks. You rebuild. This is the loop. It was the loop in 2005 with SSIS and star schemas. It’s the loop in 2025 with dbt and Iceberg, or 2026 with prompting AI agents. The tools change. The loop doesn’t."
Why 90% Accuracy in Text-to-SQL is 100% Useless
"If we accept that Text-to-SQL must be binary (correct or incorrect), we need evaluation strategies that reflect the messy reality of enterprise data, not the pristine environments of academic or demo datasets."
Why you shouldn’t trust data collected on MTurk
An academic preprint: "Several prior studies have used advanced methodological techniques to demonstrate that there is an issue with the quality of data on Amazon’s Mechanical Turk (MTurk).The goal of the present preregistered project wasto provide an accessible demonstration of this issue by showing that pairs of items assessing clearly contradictory content(e.g., “I talk a lot” and “I rarely talk”) are positively correlated on the platform. ... These findings provide clear evidence that data collected on MTurk cannot be trusted."
📈Dataviz, Data Analysis, & Interactive
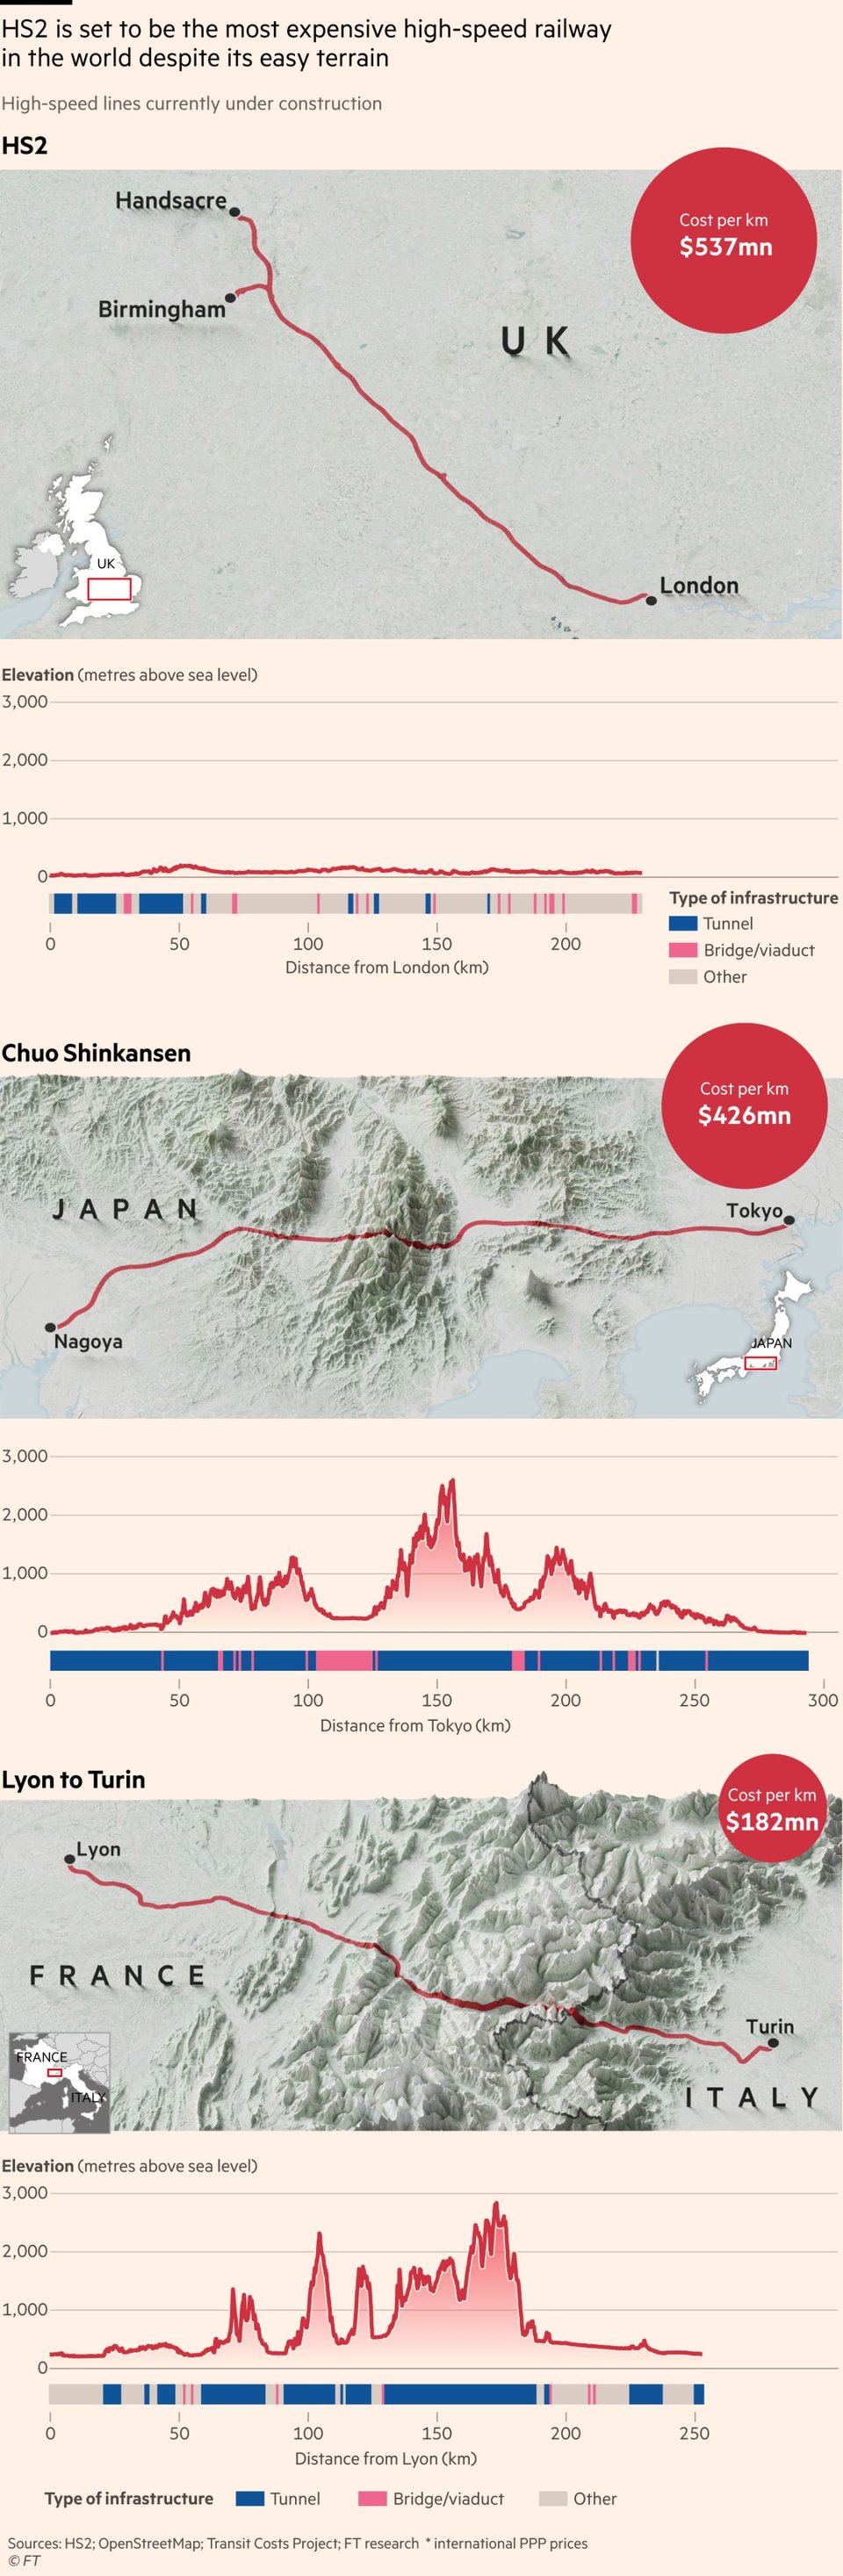
For this graphic we compare the terrain of the three most expensive rail projects in the world.
By Steven Bernard (Financial Times).
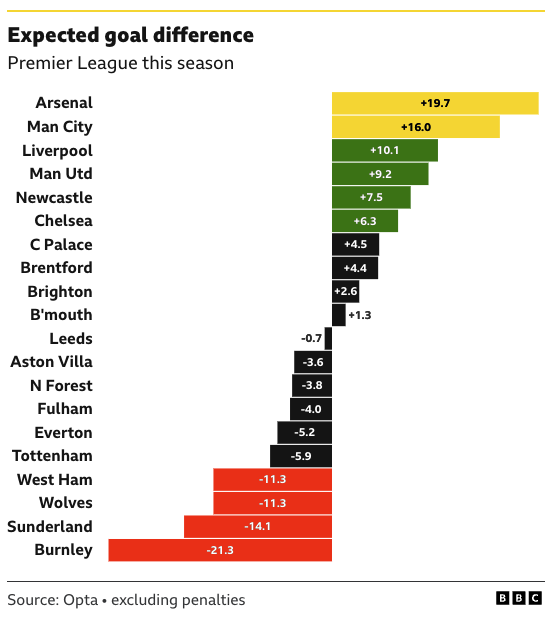
What does xG predict for the rest of the season?
"Expected goals tells us how well teams do the basics of football by creating lots of good chances up front and limiting their opponents to few, difficult ones at the back."
(via Daniele Marinazzo)
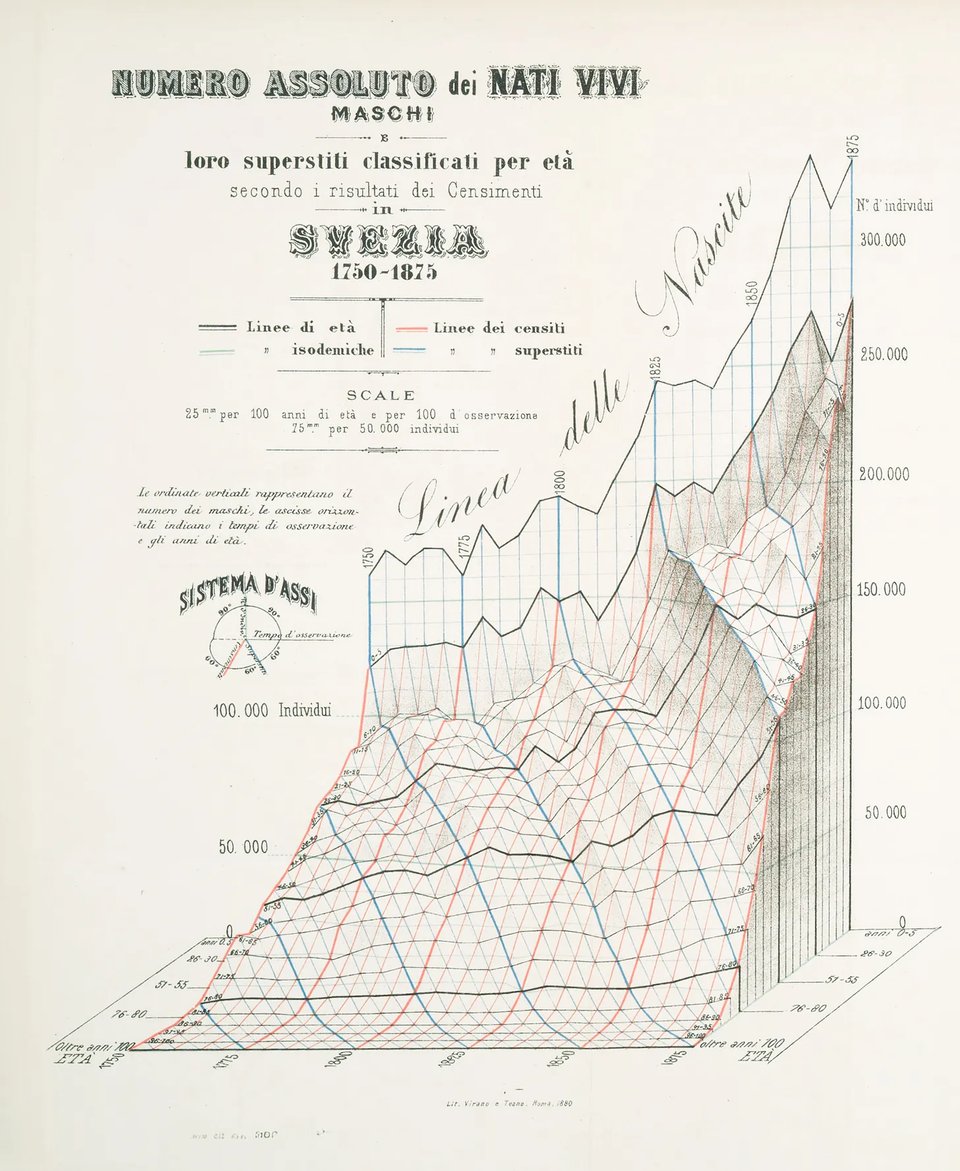
Bellissimi Data Graphics
RJ Andrews: "Luigi Perozzo's 3-D illusion, reimagined with SVG."
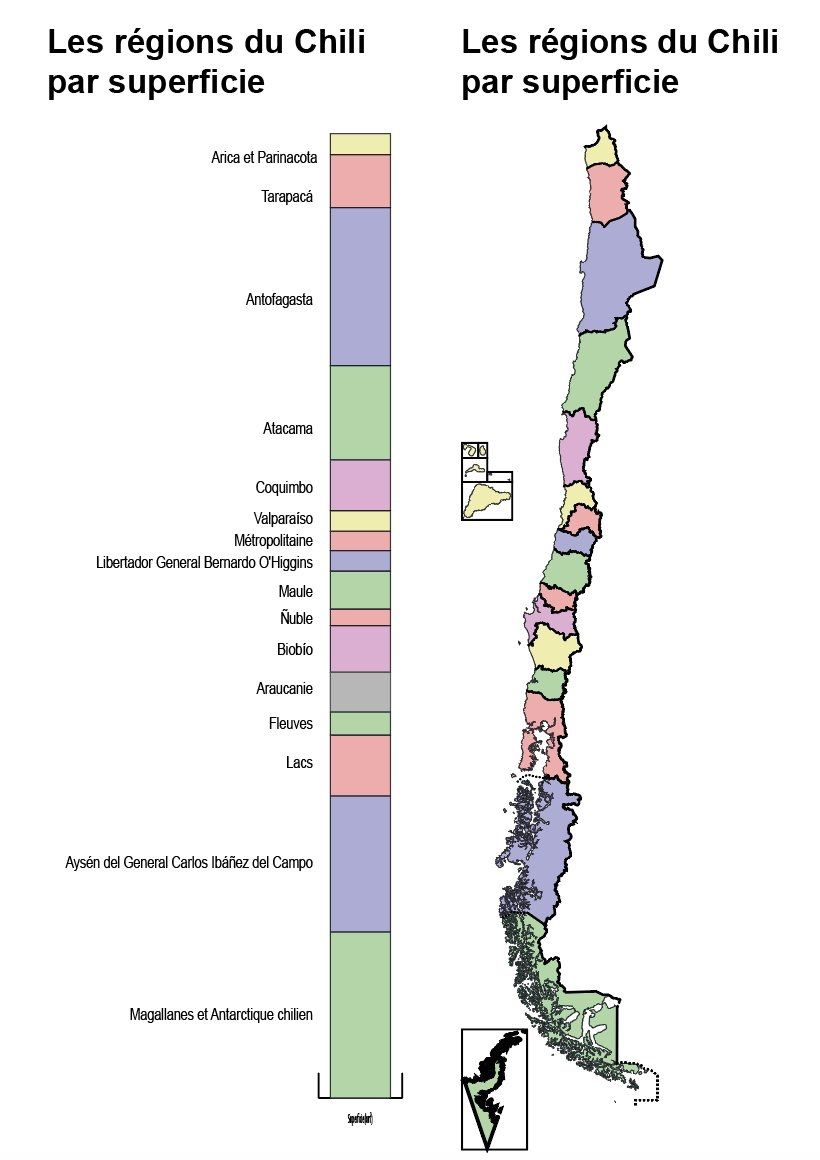
Chile visualized
Clara Dealberto suggests that Chile looks like a chart.
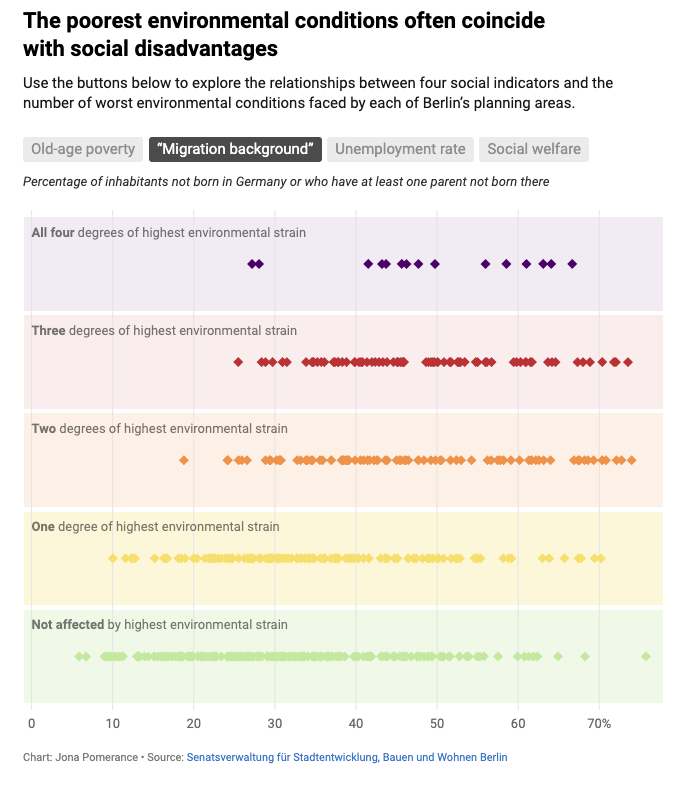
The inequality of noise, air, heat, and green spaces in Berlin
Datawrapper's Jona Pomerance visualizes environmental data about Berlin.
🤖 AI
s21e03: The Problem is Defining the Problem; The Unreasonable Effectiveness of Caring
Dan Hon's latest newsletter has a long section about coding LLMs, and comments on Simon Willison's approach.
"The point here is that the tools aren’t easy to use well, where “well” means producing software that meets certain criteria. What Simon and Jesse are also good at is deciding what those criteria are in ways that are appropriate to the task and context. This is also something that not everyone is good at."
TimeCapsuleLLM
"A LLM trained only on data from certain time periods to reduce modern bias". This is a cool idea (environmental considerations aside).
"Selective Temporal Training (STT) is a machine learning methodology where all training data is specifically curated to fall within a specific historical time period. It's done in order to model the language and knowledge of that era without influence from modern concepts. For example, the current model I have now (v0.5) is trained on data exclusively from 1800-1875, it's not fine tuned but trained from scratch resulting in output that reflects the linguistic style and historical context of that time period.".
It comes from scripts to train your own, using Karpathy's nanoGPT.
AI Psychosis, AI Apotheosis
Danny O'Brien: "I’m not sure what happens next: I know my (spits on floor) personal productivity has leapt up, but I’m aware that under any and all definitions of AI psychosis, it’s much too easy to get overexcited about the possibilities and then let down when the day-to-day reality is much more flawed."
Personal Taste Is the Moat
"AI can now tell you whether code works. It reviews patches, spots bugs, suggests fixes, and explains trade-offs. Correctness is becoming cheap. Competence is being commoditized.
But there’s something AI cannot do: tell you whether something should exist."
Vibe Coding Without System Design is a Trap
"Lowering the barrier to creation has always been a net positive. WordPress turned anyone into a publisher. YouTube turned anyone into a broadcaster. Shopify turned anyone into an e-commerce operator. AI-assisted coding is doing the same for product building.
Let a thousand flowers bloom. I’m all in!
The problem: AI is very good at helping you build something. It’s not very good at helping you build something well."
The State Of LLMs 2025: Progress, Problems, and Predictions
Sebastian Raschka's wrap-up, including some surprises from the past year, and predictions for 2026.
Epoch AI 2025 impact report
"In 2025, Epoch AI published over a hundred outputs, more than doubled its reach and raised over ten million dollars."
ICYMI, "Epoch AI is a multidisciplinary non-profit research institute investigating the future of artificial intelligence. We examine the driving forces behind AI and forecast its economic and societal impact."
|
DID YOU LIKE THIS ISSUE>? → BUY ME A COFFEE!  You're receiving this email because you subscribed to Quantum of Sollazzo, a weekly newsletter covering all things data, written by Giuseppe Sollazzo (@puntofisso). If you have a product or service to promote and want to support this newsletter, you can sponsor an issue. |
quantum of sollazzo is also supported by Andy Redwood’s proofreading – if you need high-quality copy editing or proofreading, check out Proof Red. Oh, and he also makes motion graphics animations about climate change.
