639: quantum of sollazzo
#639: quantum of sollazzo – 6 January 2026
The data newsletter by @puntofisso.

Hello, regular readers and welcome new ones :) This is Quantum of Sollazzo, the newsletter about all things data. I am Giuseppe Sollazzo, or @puntofisso. I've been sending this newsletter since 2012 to be a summary of all the articles with or about data that captured my attention over the previous week. The newsletter is and will always (well, for as long as I can keep going!) be free, but you're welcome to become a friend via the links below.
Quantum #638 had an open rate of 49.94% and a click rate of 13.81%.
The most clicked link was this intriguing sonification of solar data.
Quantum has a new sponsor for the next few issues!
Ed Freyfogle, organiser of geospatial meetup Geomob, co-host of the Geomob podcast, and co-founder of the OpenCage, has offered to introduce a set of points around the topic of geocoding. His first entry starts a few paragraphs below on the definition of geocoding.
AMA – Ask Me Anything! Submit a question via this anonymous Google form. I'll select a few every 4-5 weeks and answer them on here :-) Don't be shy!

The Quantum of Sollazzo grove now has 40 trees. It helps managing this newsletter's carbon footprint. Check it out at Trees for Life.
'till next week,
Giuseppe @puntofisso.bsky.social
🛎️ Things that caught my attention
"In the 1990s mankind discovered that we could turn the year into glasses". Have a good laugh to start 2026 :-) Happy new years, Quantum folks!
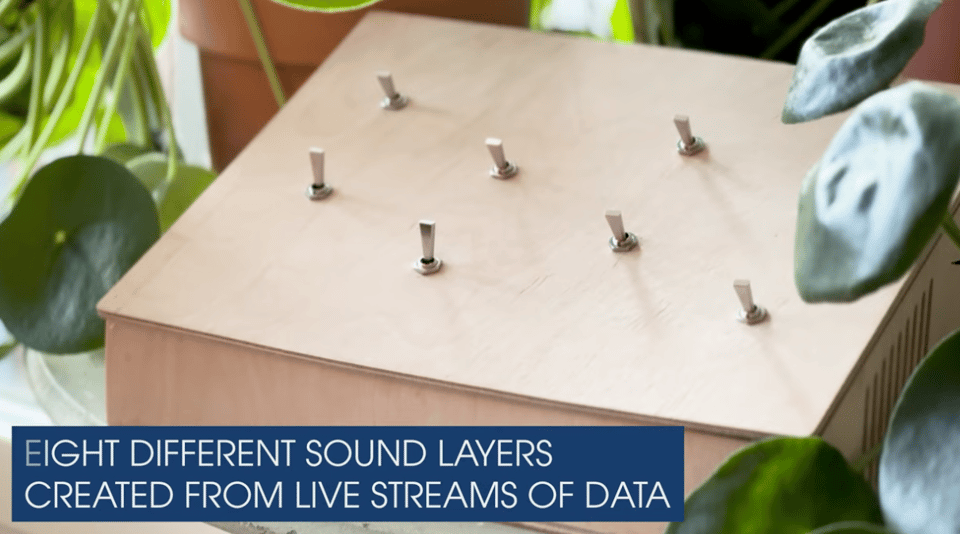
Chief Data Sonification Guru Duncan Geere just published a trailer of the sonification machine project he built with Silvia Hüttner.
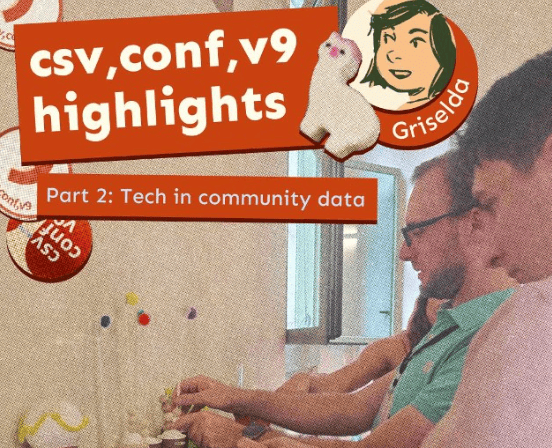
Finally, Kontinentalist's Griselda Gabriele published the second part of her write-up about csv,conf,v9.
What is geocoding?
Geocoding is translating between geo coordinates (latitude, longitude) and human place descriptions (addresses, placenames, etc). There are two kinds of geocoding:
- Forward geocoding: address to coordinates
- Reverse geocoding: coordinates to address
More smart phones and tracking devices means more geodata is being created than ever before. Geocoding is a first step in processing that data into useful information. In the coming weeks this series will look at the challenges around geocoding.
At OpenCage we run a highly available, simple to use, worldwide, geocoding API based on open datasets like OpenStreetMap. Have a project that will need geocoding? See our geocoding buyer's guide for an overview of all the factors to consider when choosing between geocoding services.
![]()
✨ Topical
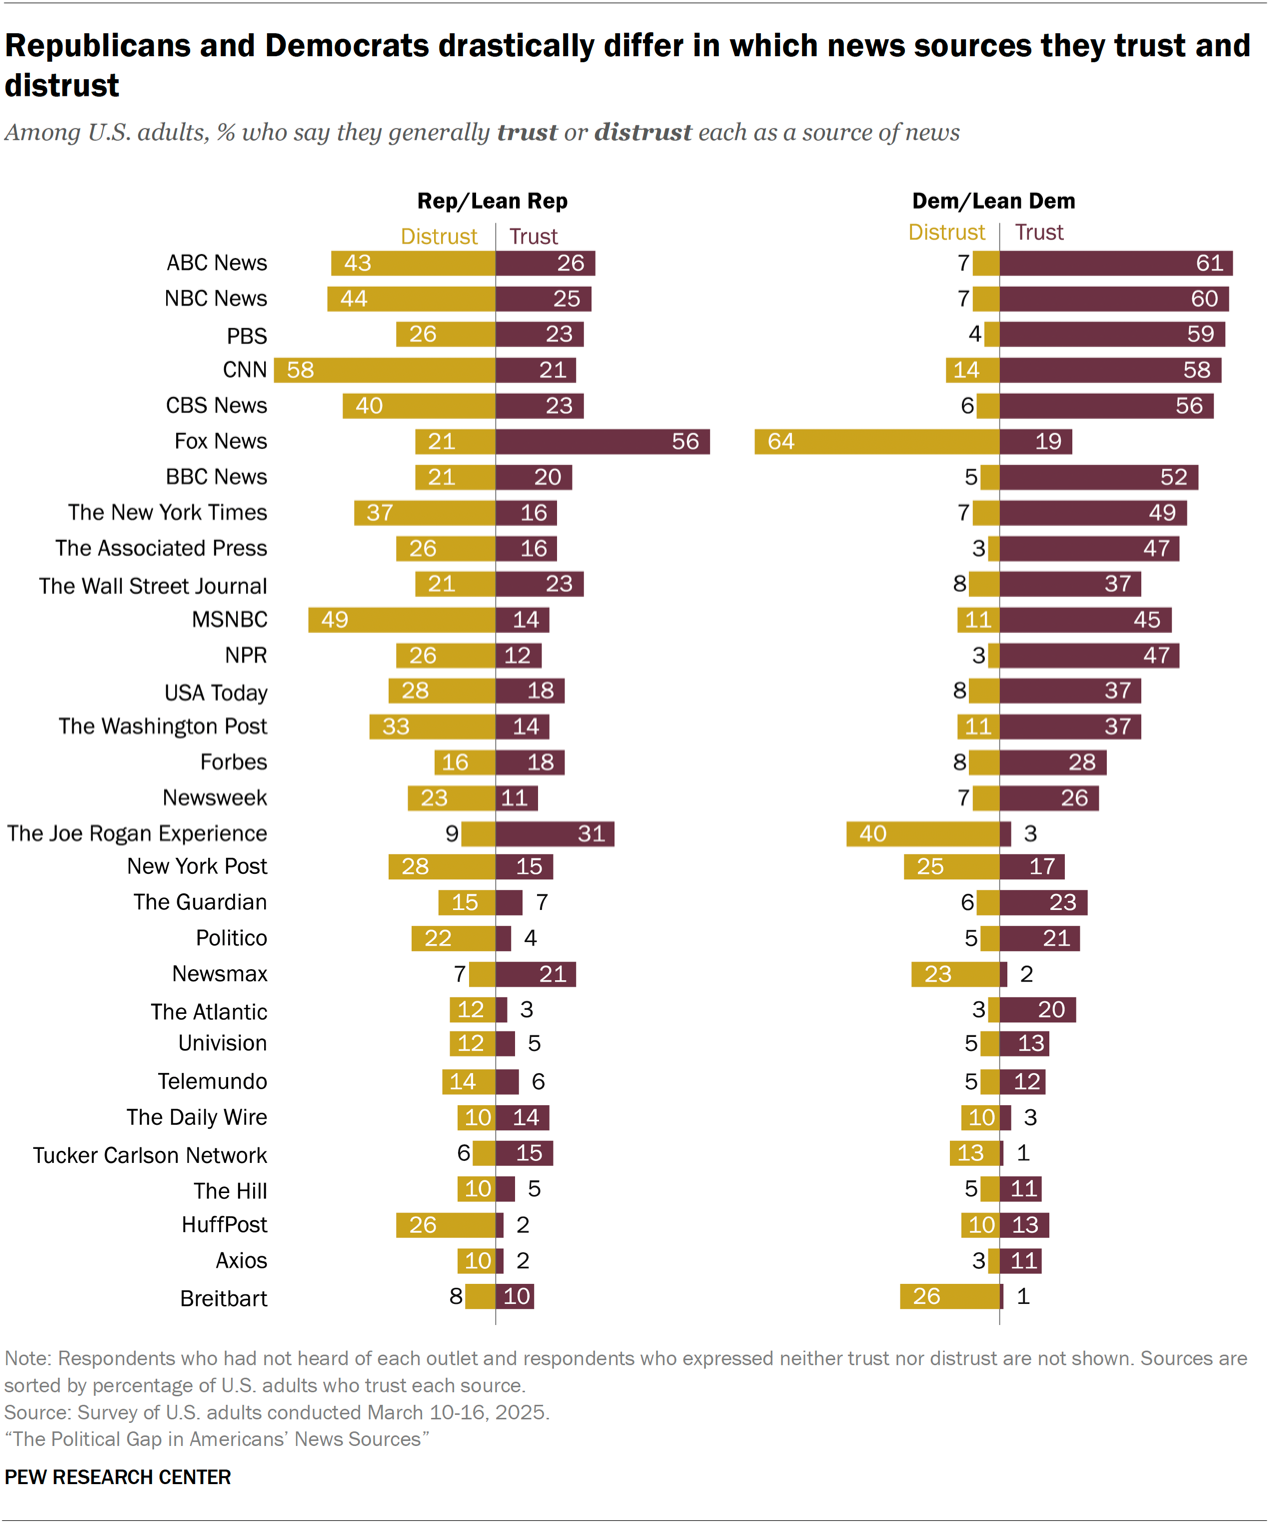
Striking findings from 2025
The Pew Research Centre's yearly wrap-up: "As we do every year, we’ve gathered data around some of the most pivotal news stories of 2025, including President Donald Trump’s return to the White House, the changing U.S. immigration landscape and the rapid rise of artificial intelligence worldwide."
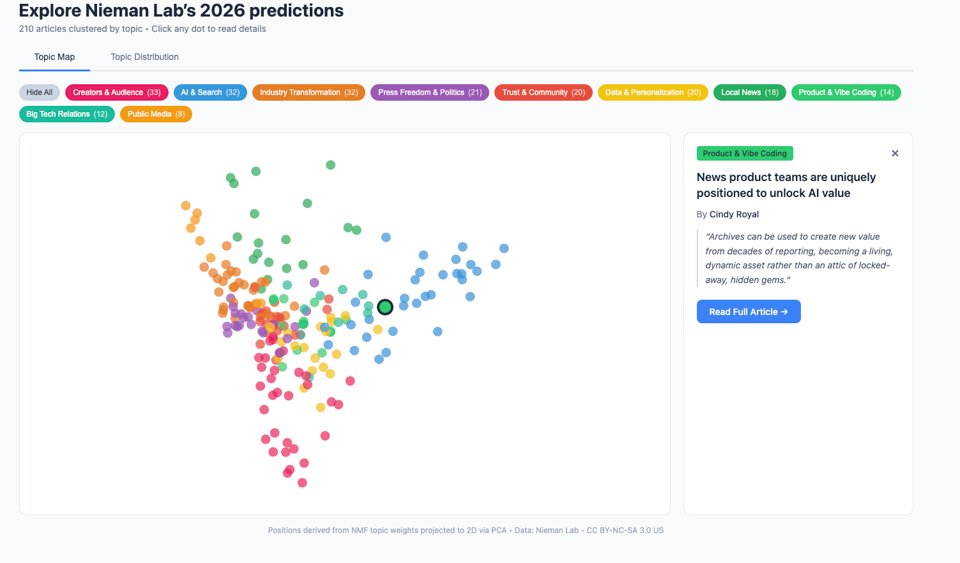
What are journalists excited and worried about heading into 2026?
Florent Daudens mapped "the Nieman Lab predictions into a data viz to see the big picture."
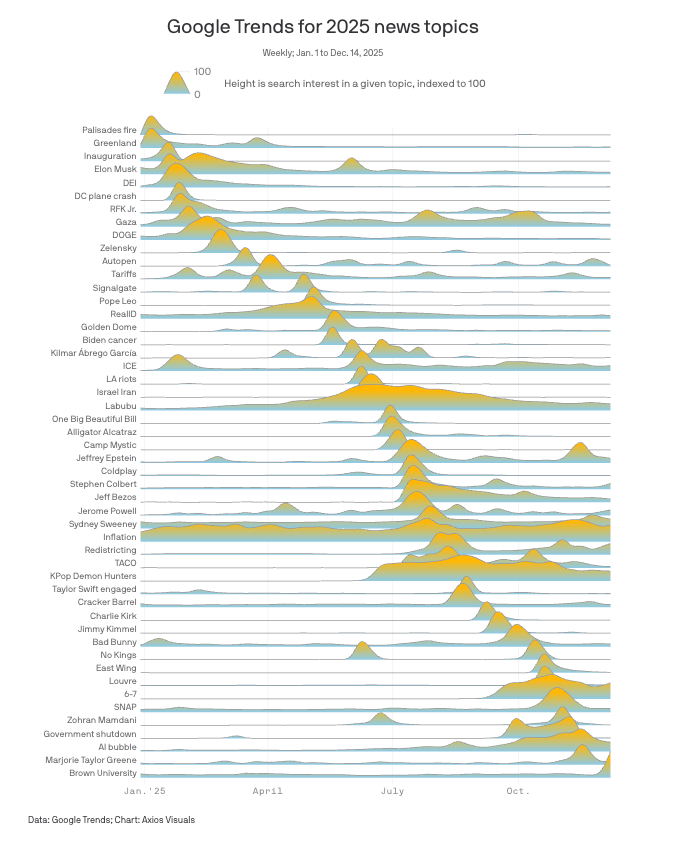
Charting the chaos: These stories captured America's attention in 2025
Axios' yearly visualization of Google Trends.
A little boomer confession: I had to google what Labubu was...
(via Peter Wood)
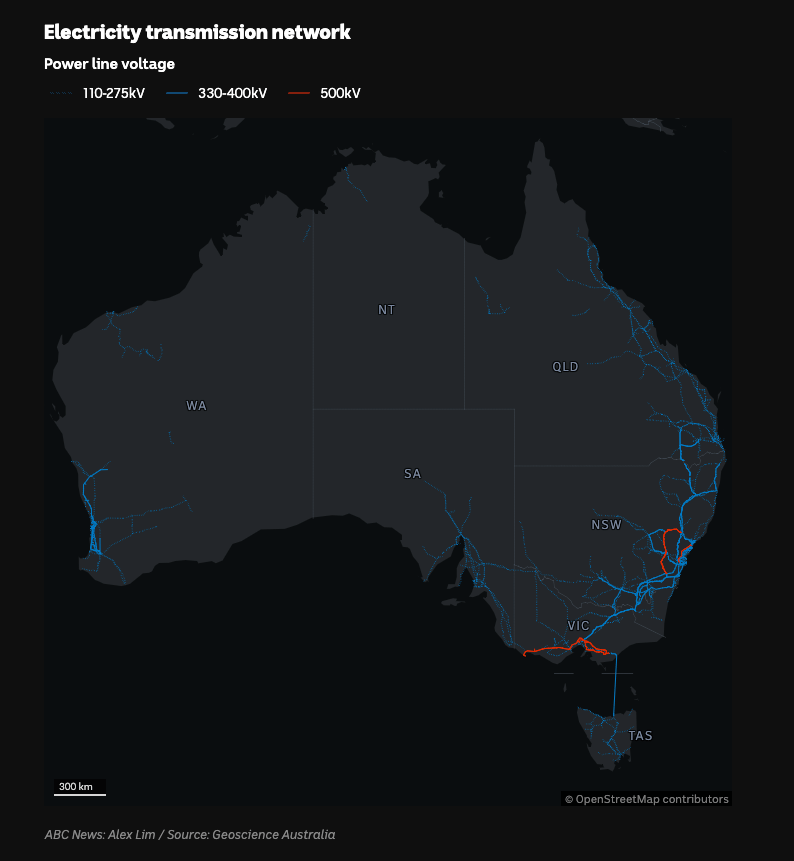
Australia's race to rewire the country amid a global transmission boom is not unique
"Today, Australia's power grid spans across the entire eastern seaboard, only WA and the NT are energy islands.
But it was not always like that."
(via Fair Warning – which I'm very happy to see back in full swing :))
🛠️📖 Tools & Tutorials
Top Python libraries of 2025
"...this year’s selection highlights two things:
The LLM world is evolving fast, and we surface the libraries that genuinely stood out.
But Python remains much broader than LLMs, with meaningful progress in data processing, scientific computing, performance, and overall developer experience."
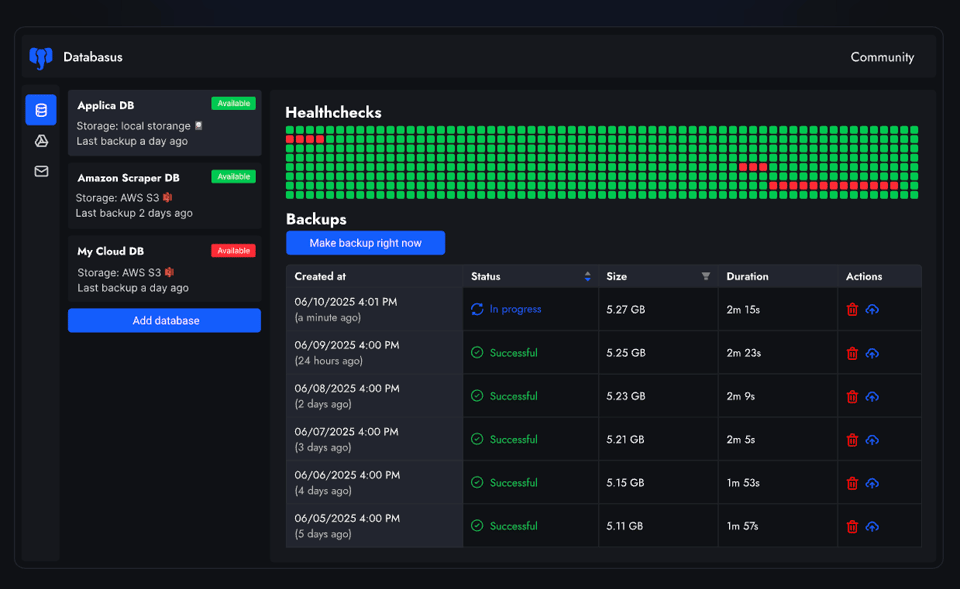
Databasus
"Databases backup tool (PostgreSQL, MySQL, MongoDB)". Open source here.
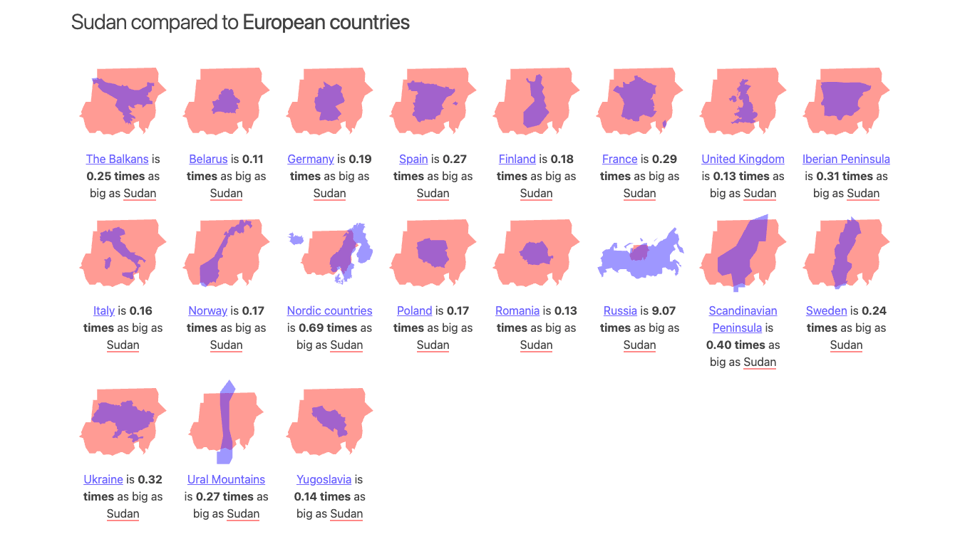
MapFight.xyz
A website to "compare the size of countries, regions and cities".
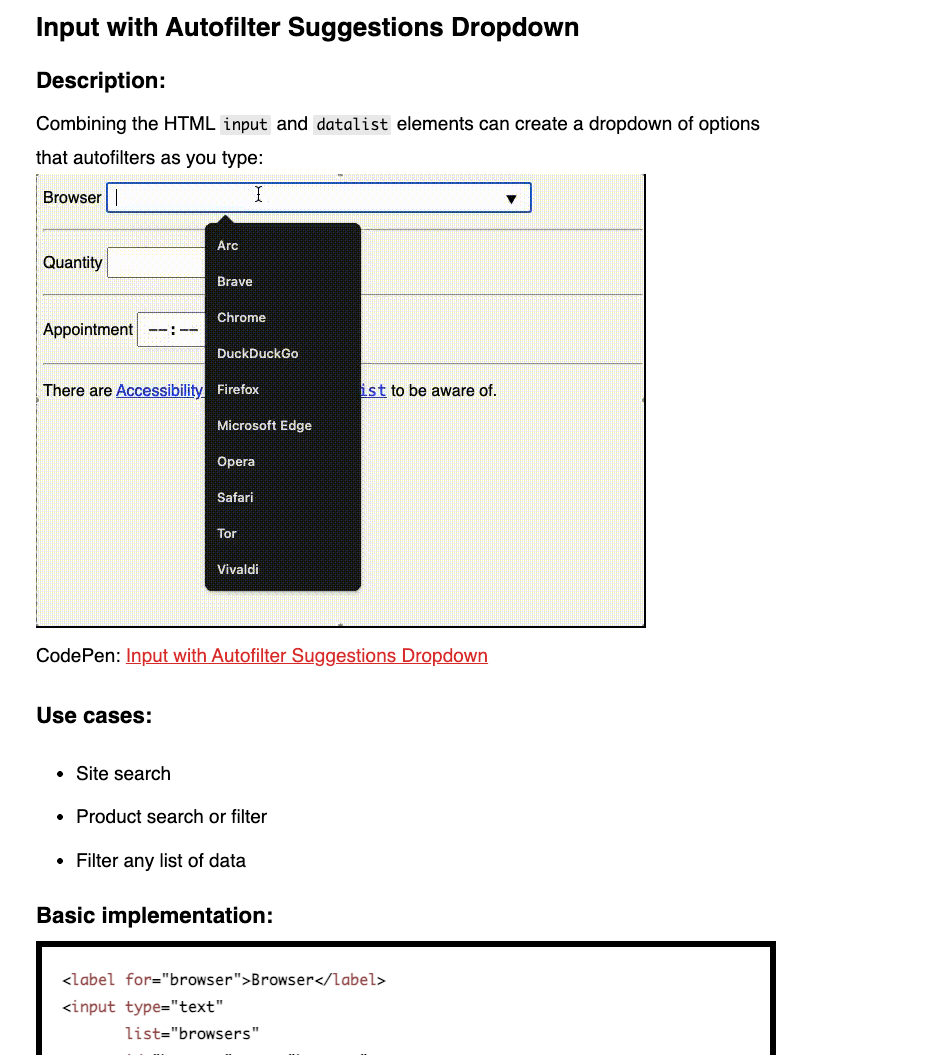
Replacing JS with just HTML
"But as time marches on, and the HTML and CSS methods gain traction, we need to start replacing the old JS methods that feel so comfy with new methods that require less JS."
Top 10 Free GIS Software Tools (2025 Edition)
A good list.

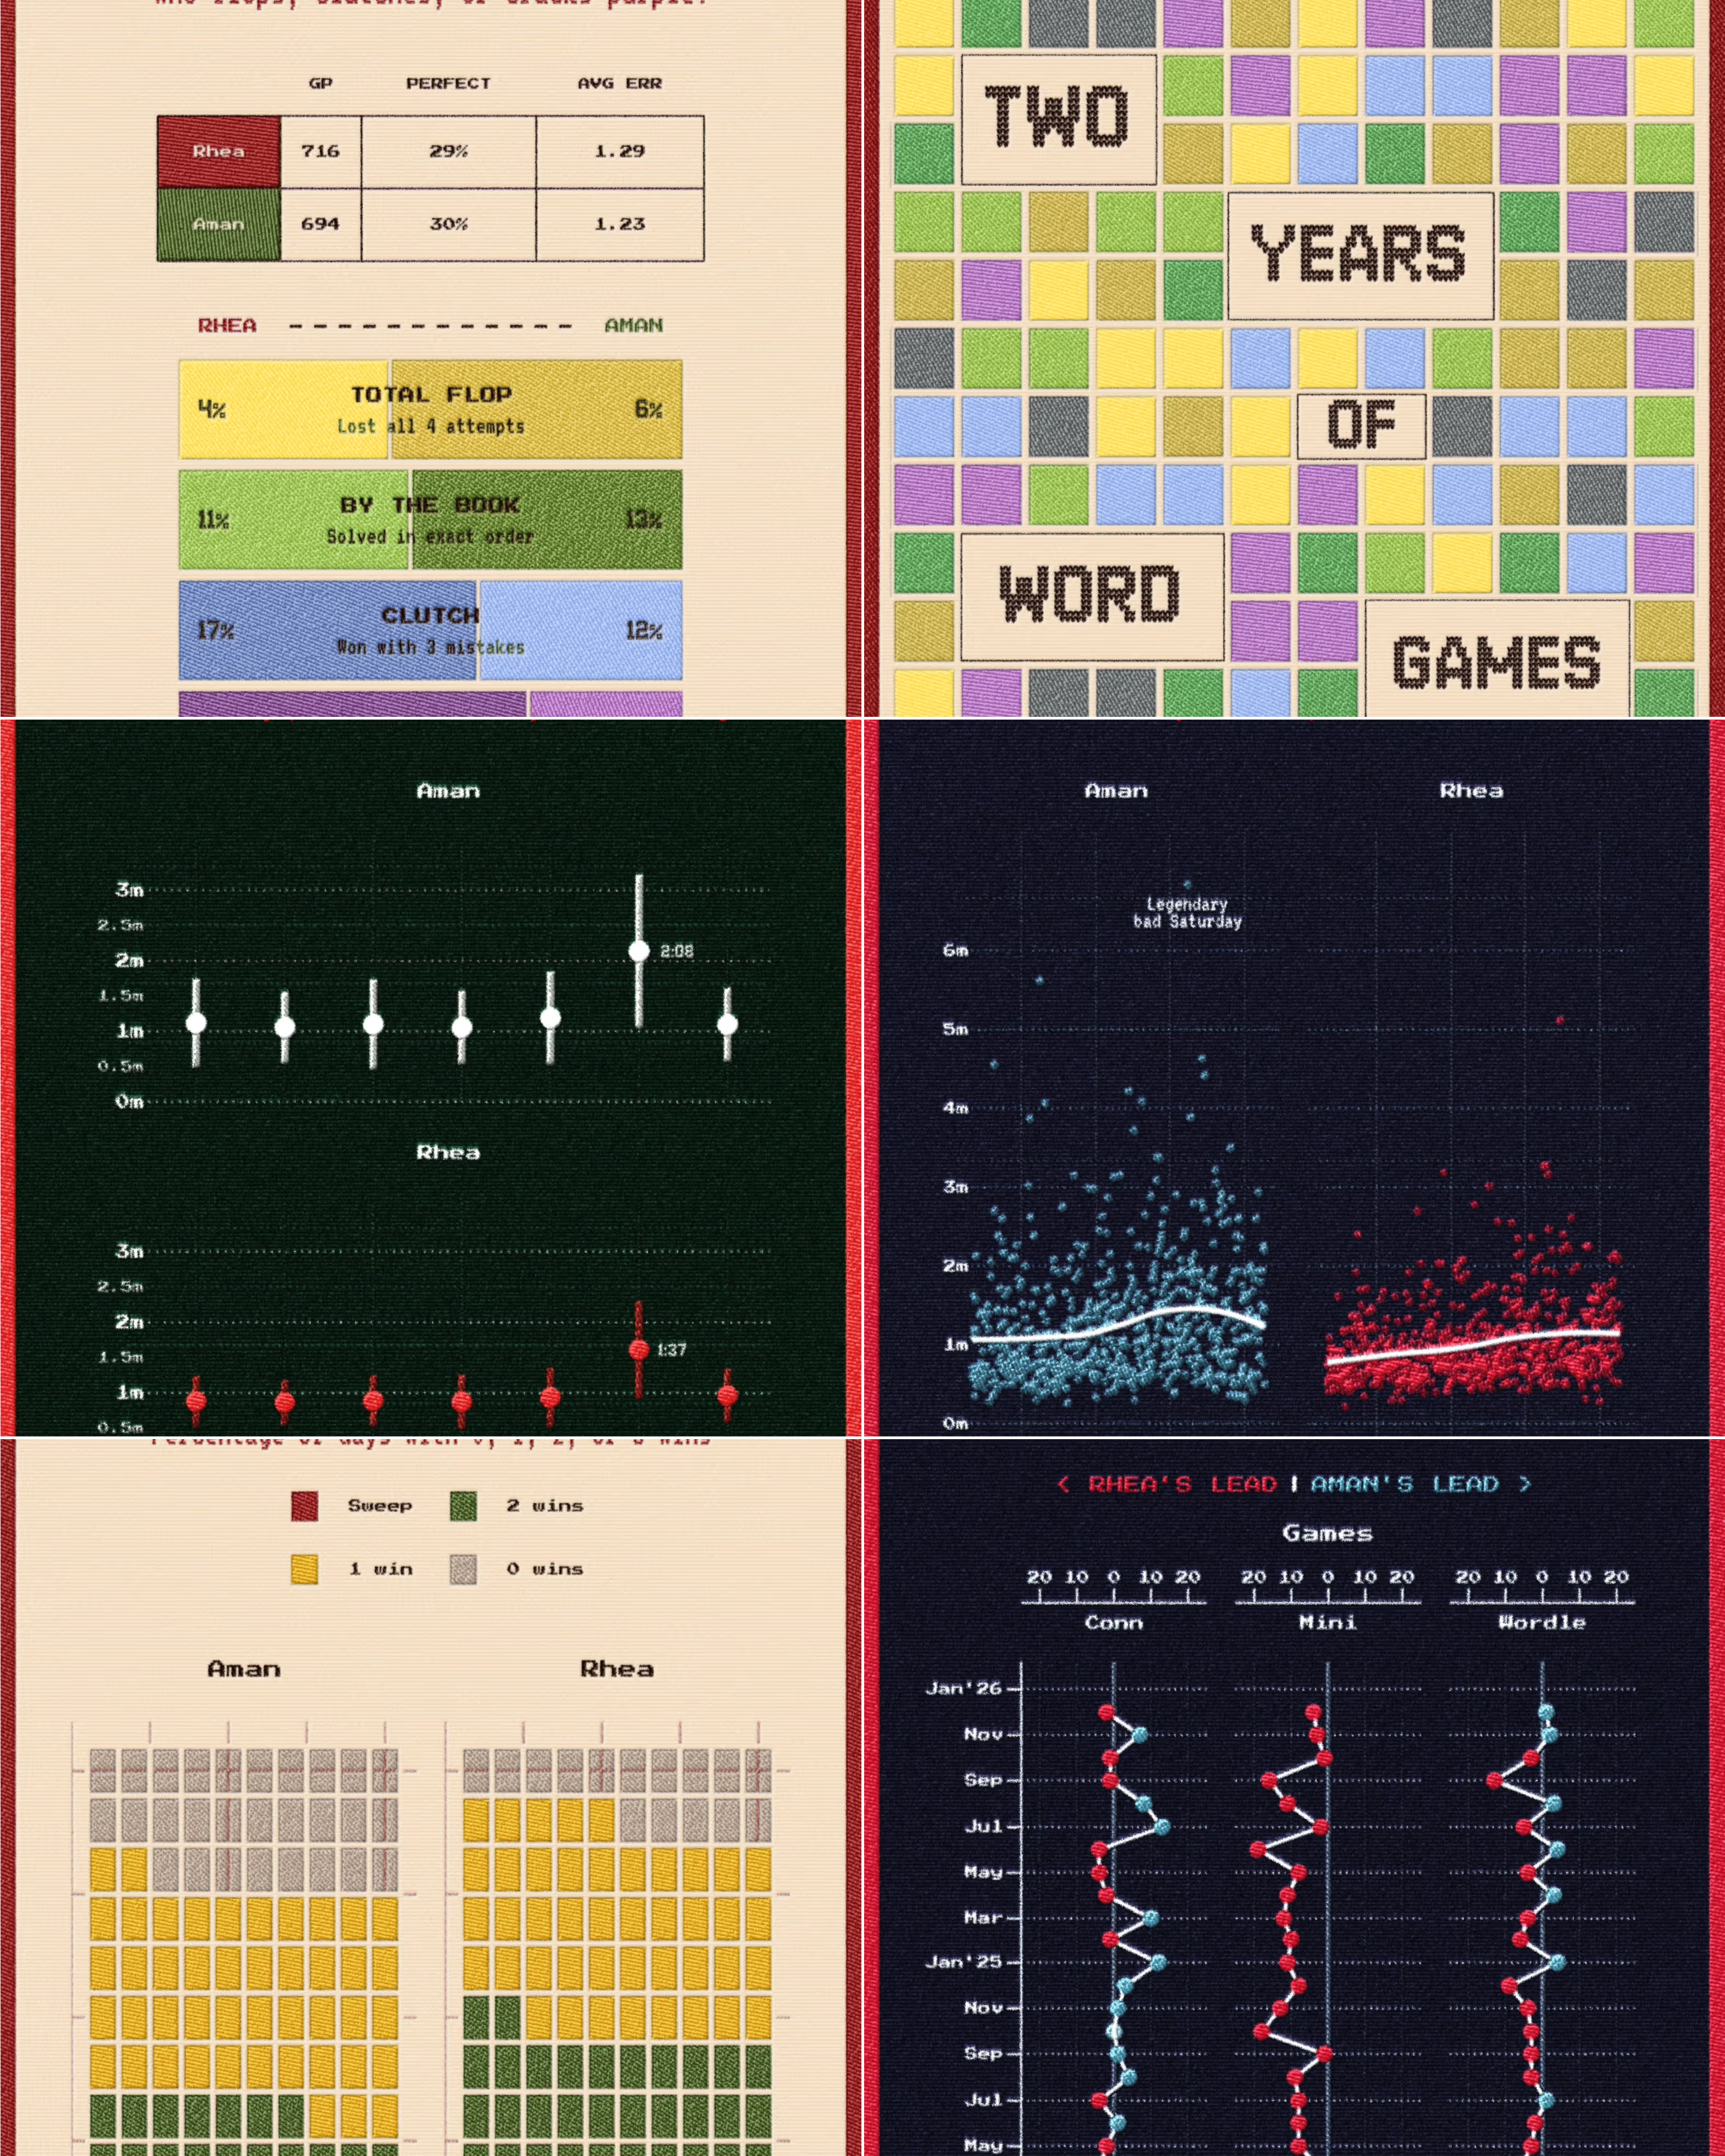
Creating Embroidered Charts with R and ImageMagick
Aman Barghava: "To make my digital work more fun to create and enjoy, I love mimicking real-life objects, textures, and analogies. My latest gimmick this time was trying to make the charts look like they were embroidered into cloth."
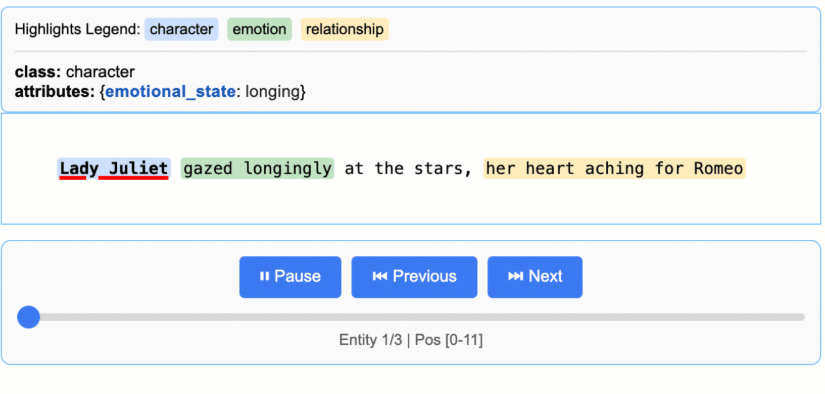
langextract
Released by Google, this is a "Python library for extracting structured information from unstructured text using LLMs with precise source grounding and interactive visualization.". It works with PFDs and web content, among other things.
What an unprocessed photo looks like:
"Here’s a photo of a Christmas tree, as my camera’s sensor sees it". It proceeds to explain the basics of image capture and rendering.
 .
.
Go away Python!
"Are you sick of python? Did you (rightfully) want to tear your eyes out when some LLM suggested that you script with .mjs? Well, there is a solution for you".
73 Programming Project Ideas to Inspire and Challenge You
Some of these are pretty cool.
🤯 Data thinking
Data Manifesto
"Data cannot be owned. By anybody" and other 19 data rules by Kevin Kelly I don't agree with all of them ("privacy is a misunderstanding that does not apply to data" is definitely far from my way of thinking), but they're definitely thought-provoking.
10 Predictions for Data Infrastructure in 2026
"At Columnar, our work to define the next era of data connectivity gives us a front-row seat to the structural movements happening below the surface. Here’s what we see coming in 2026."
📈Dataviz, Data Analysis, & Interactive
Waterways
Tom Peterken (Data Scientist at the Ordnance Survey): "I've taken Ordnance Survey's Water Network data, and coloured each stream/river/canal according to which shipping forecast (or inland waters forecast) area it eventually feeds. The boundaries between basins are so pretty."
(via Guy Lipman)

A Political Atlas of the World – 1st Experiments with WebMapperGPT
Steven Feldman reports on his experiments with mapping LLMs. The result is available here.
https://i0.wp.com/knowwhereconsulting.co.uk/wp-content/uploads/2025/12/image-scaled.png?resize=1024%2C606&ssl=1
Show HN: 22 GB of Hacker News in SQLite
Obviously, you can use this website with the DB in question directly, but I think that the discussion on HackerNews is more interesting. The data base and code are here on GitHub: "Big Query -> ETL -> npx serve docs - that's it."
It is remarkable because it builds a high-performant offline copy of HackerNews, with the ability to update it daily: "A fully static Hacker News archive that runs entirely in your browser using SQLite compiled to WebAssembly."

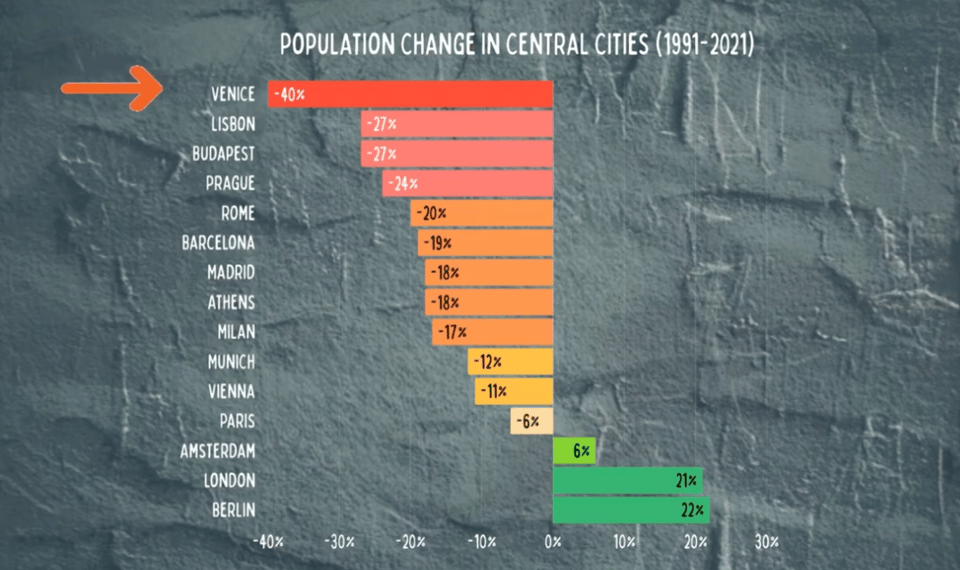
The Tourist Takeover of Europe's Historic Hearts
Ricardo Tamagnini: "Using demographic data, tourism statistics, and urban economics, this video unpacks a central paradox of modern Europe: how cities can look more successful than ever while becoming less liveable for the people who call them home."
Is it New Year already?
Angsar Wolsing's Happy New Year interactive map. At this stage it's obviously complete, but bookmark it for next year :)
People in Billy Joel's "We Didn't Start the Fire"
I never noticed :D. Source code here.
(via Alex Wrottesley)

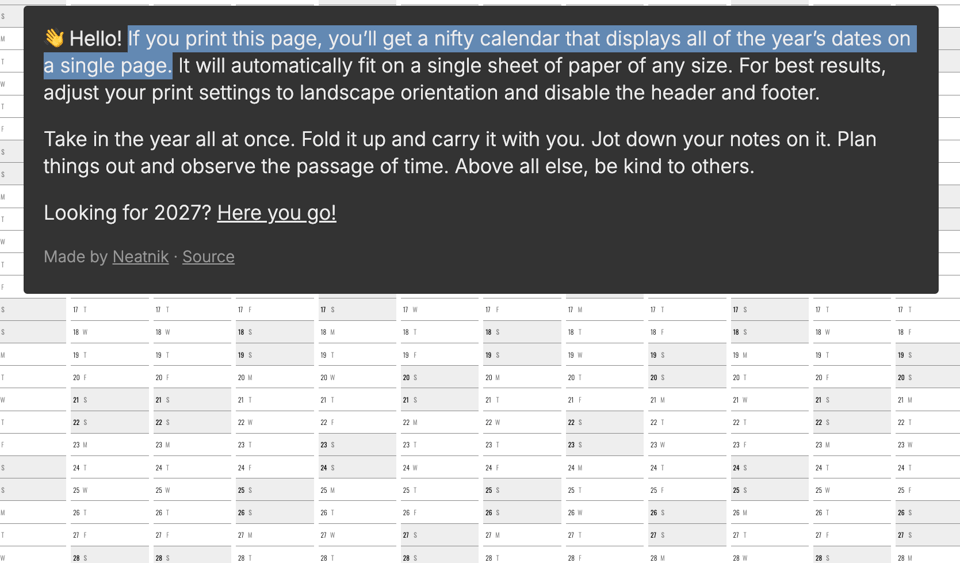
If you print this page, you’ll get a nifty calendar that displays all of the year’s dates on a single page.
Ok, this is not quite a data thing, but the source code is available and I've got a hunch that it might be useful.
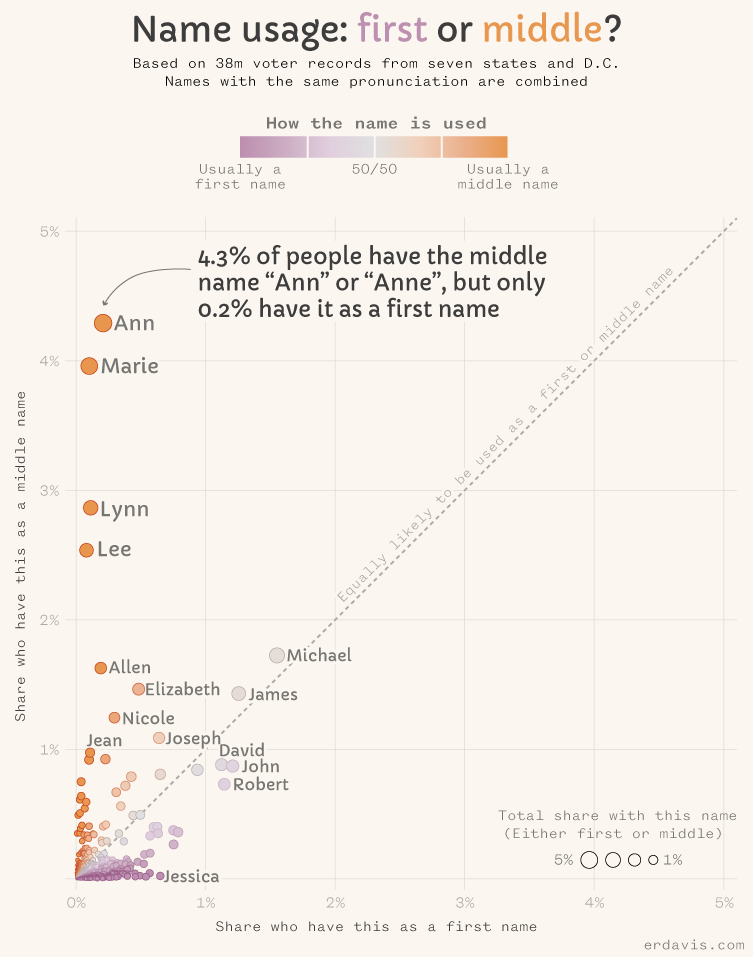
What is the most “middle” name?
Erin Davis: "Essentially, I wanted to see if certain names were more likely to be used as middle names than as first names."
Planning London Datahub
"The Planning London Datahub is a data platform designed to streamline and enhance the planning process in London.
It provides a single consistent data set to support decision-making for planning projects.
The Datahub improves transparency and accessibility of planning information for stakeholders, including government, developers, and the public."
As the Mayor of London's Head of Data Peter Kemp reports, "there are over 1.2million developments worth of data in the system, the data that drives how our city is changing."
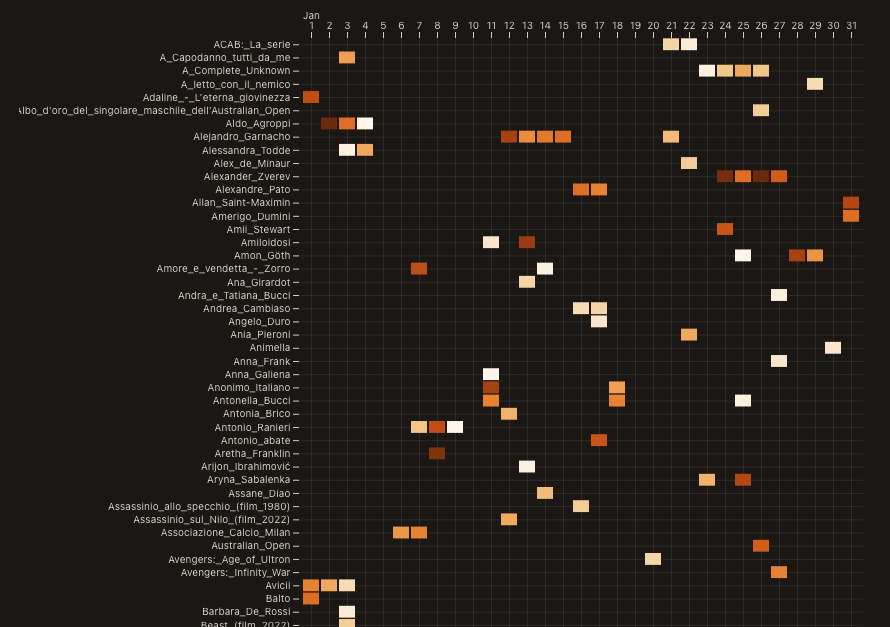
Wiki 2025
In Italian (but it's all dataviz!), by Andrea Mignone – "Il 2025 raccontato con le pagine più viste ogni giorno su Wikipedia", or 2025 in the most viewed Wikipedia pages.
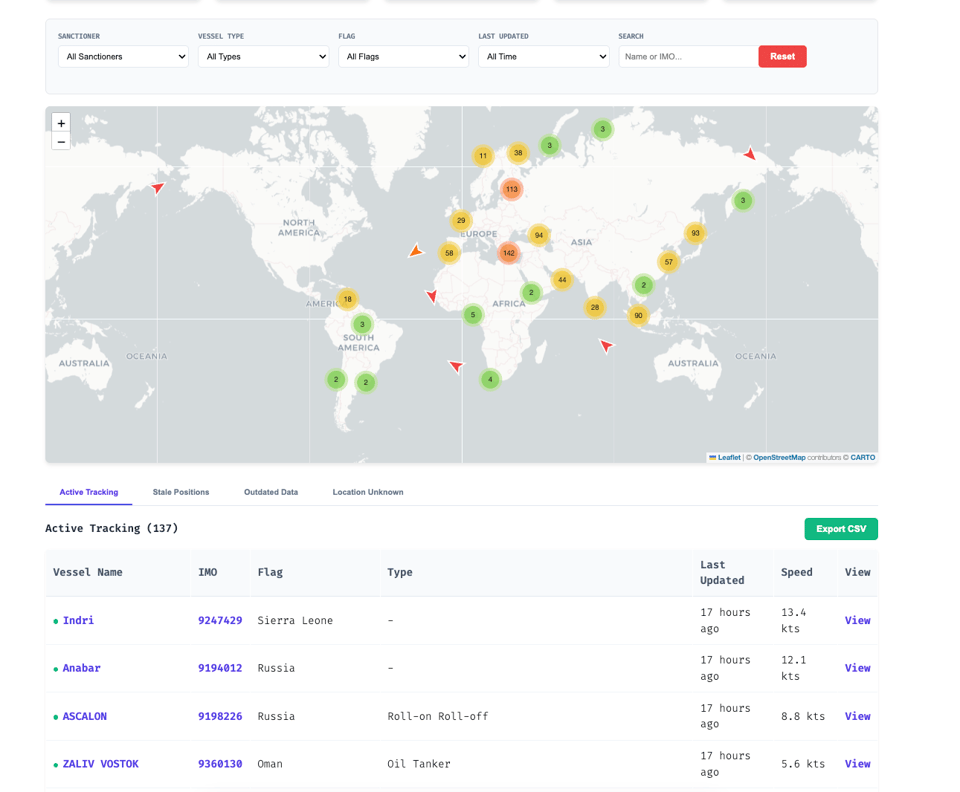
Live Sanctioned Vessel Tracking Map – Global AIS Monitoring
"Real-time positions and compliance status for 400+ vessels under international sanctions".
(via Geomob)
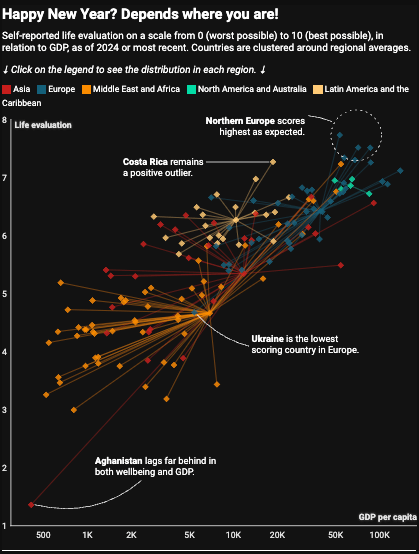
Happy New Year!
Sadly, new year's happiness doesn't reach everyone equally. By Datawrapper's Veronika Halamková.
Soccer Analytics 2025 Review
Jan Van Haaren: "Collection of the soccer analytics content that I liked the most in 2025!"
🤖 AI
AI Marketing Examples: 13 Times AI Actually Delivered
"Every AI marketing disaster you’ve seen—the cringeworthy fake influencers, the obviously robotic copy, the brands caught lying about AI use—happened because someone thought AI could replace strategy, creativity, or authenticity. The examples in this article prove the opposite: AI’s value is removing grunt work and constraints, not replacing the humans who understand your market, your brand, and your customers."
|
DID YOU LIKE THIS ISSUE>? → BUY ME A COFFEE!  You're receiving this email because you subscribed to Quantum of Sollazzo, a weekly newsletter covering all things data, written by Giuseppe Sollazzo (@puntofisso). If you have a product or service to promote and want to support this newsletter, you can sponsor an issue. |
quantum of sollazzo is also supported by Andy Redwood’s proofreading – if you need high-quality copy editing or proofreading, check out Proof Red. Oh, and he also makes motion graphics animations about climate change.
