632: quantum of sollazzo
#632: quantum of sollazzo – 18 November 2025
The data newsletter by @puntofisso.

Hello, regular readers and welcome new ones :) This is Quantum of Sollazzo, the newsletter about all things data. I am Giuseppe Sollazzo, or @puntofisso. I've been sending this newsletter since 2012 to be a summary of all the articles with or about data that captured my attention over the previous week. The newsletter is and will always (well, for as long as I can keep going!) be free, but you're welcome to become a friend via the links below.
Quantum #631 had an open rate of 50.26% and a click rate of 14.55%.
The most clicked link was one for Roman empire fans: Itiner-E.
AMA – Ask Me Anything! Submit a question via this anonymous Google form. I'll select a few every 4-5 weeks and answer them on here :-) Don't be shy!

The Quantum of Sollazzo grove now has 35 trees. It helps managing this newsletter's carbon footprint. Check it out at Trees for Life.
'till next week,
Giuseppe @puntofisso.bsky.social
🛎️ Things that caught my attention
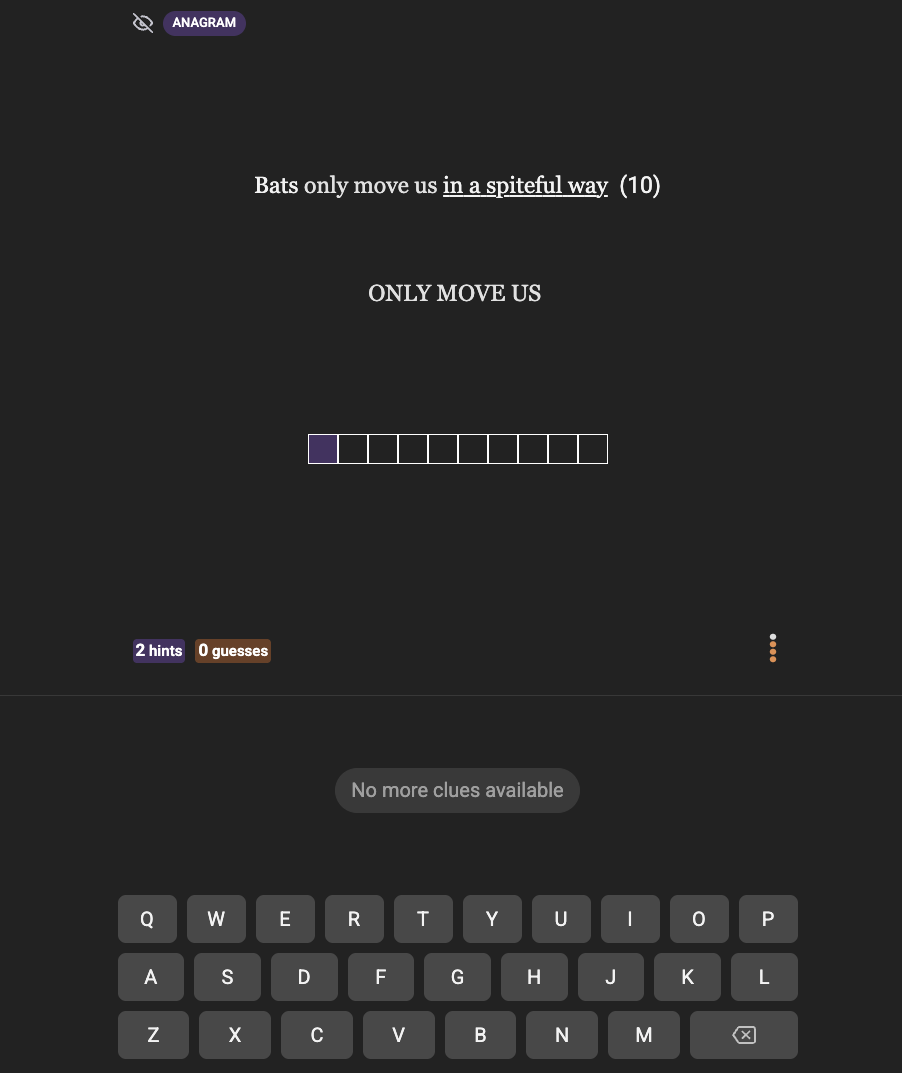
It's not quite data... or maybe is it? :-) My friend and former colleague Kayla Plunkett and team have launched this really cool website to Learn how to play cryptic crossword. It provides hints as you play, and you get a different game every day, graded for difficulty. Happy playing!
✨ Topical
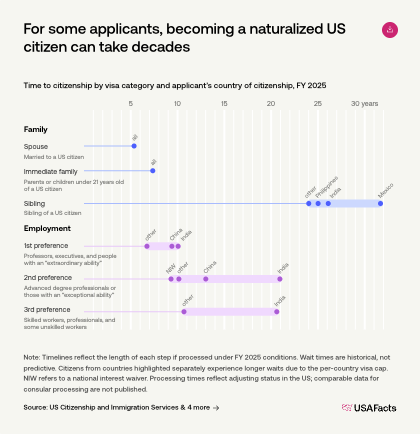
How long can it take to become a US citizen?
USAFacts: "For some immigrants, becoming a US citizen takes a few years. For others, limited visa availability and annual country caps mean waiting decades before even applying."
Brain food, delivered daily
Every day we analyze thousands of articles and send you only the best, tailored to your interests. Loved by 505,869 curious minds. Subscribe.

🛠️📖 Tools & Tutorials
side::kick(): A coding agent for RStudio
With a caveat that this is a highly experimental project, side::kick() is a "coding agent for data science in RStudio, implemented entirely in R. It can interact with your files, talk to your active R session, and run code."

Perkeep
Perkeep is a brilliant long-term data archiving solution: it's a "set of open source formats, protocols, and software for modeling, storing, searching, sharing and synchronizing data in the post-PC era. Data may be files or objects, tweets or 5TB videos, and you can access it via a phone, browser or FUSE filesystem."
Difference in difference
"Difference in differences is a very old technique, and one of the first applications of this method was done by John Snow, who’s also popular due to the cholera outbreak data visualization.
In his study, he used the Difference in Difference (DiD) method to provide some evidence that, during the London cholera epidemic of 1866, the cholera was caused by drinking from a water pump."
sitemap.js
"Sitemap-generating framework for node.js".
Useful to get indexed on Google.
🤯 Data thinking
From web developer to database developer in 10 years
Phil Eaton: "Last month I completed my first year at EnterpriseDB. I'm on the team that built and maintains pglogical and who, over the years, contributed a good chunk of the logical replication functionality that exists in community Postgres. Most of my work, our work, is in C and Rust with tests in Perl and Python. Our focus these days is a descendant of pglogical called Postgres Distributed which supports replicating DDL, tunable consistency across the cluster, etc. This post is about how I got here."
📈Dataviz, Data Analysis, & Interactive
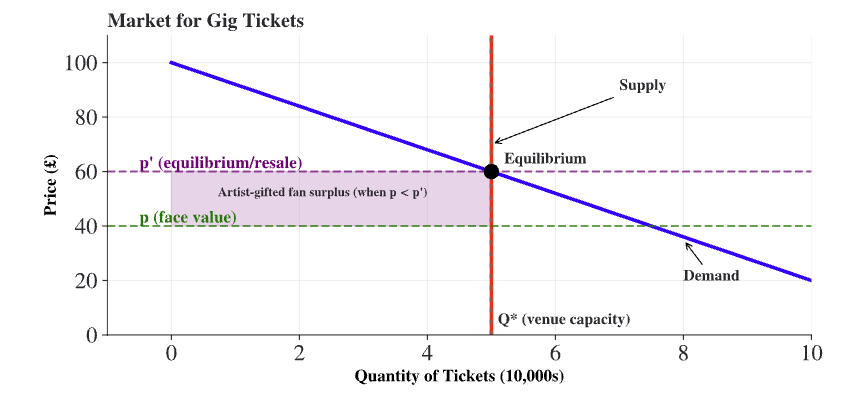
One trick to stop ticket touts
Arthur Turrell: "In economics terms, the artists are charging below the equilibrium price, ie the one that the fans are willing to bear (even if they would prefer not to!) The artists would like the fans to capture this benefit. But the resellers do charge the equilibrium price, which is, and can pocket for every ticket sold (minus the cost of their labour.) By the way, can be substantial: a paper by Connolly and Krueger (2018) found that the mean resale mark-up was 36% but a few 100 percent for superstar artists."
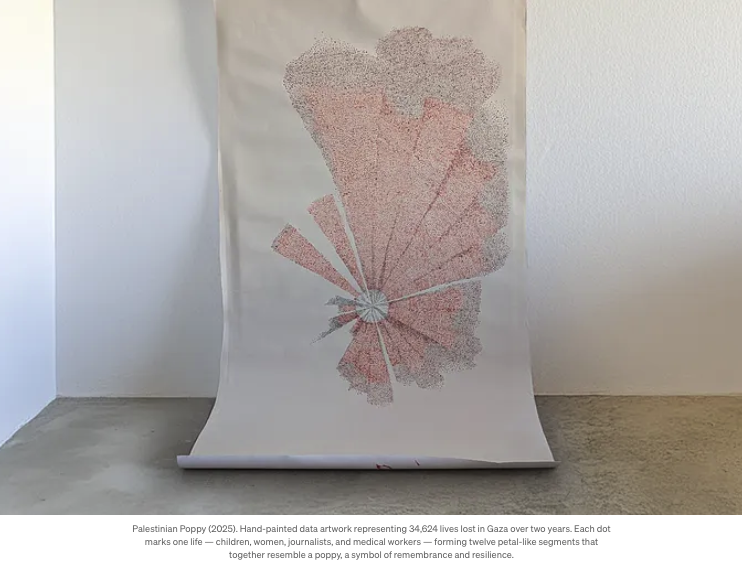
The Weight of Counting
Data designer Valentina d'Efilippo has written a reflective piece about remembrance, data, the poppy, and the Gaza-Israel conflict. A lot of food for thought. This is based on her experience creating two visualizations that use poppies, the first in 2013 to represent conflicts from the last century, and one about deaths in Gaza.
7 sets Venn Diagram
"128 color combinations from mixing 7 colors".
(h/t Chris Weston)
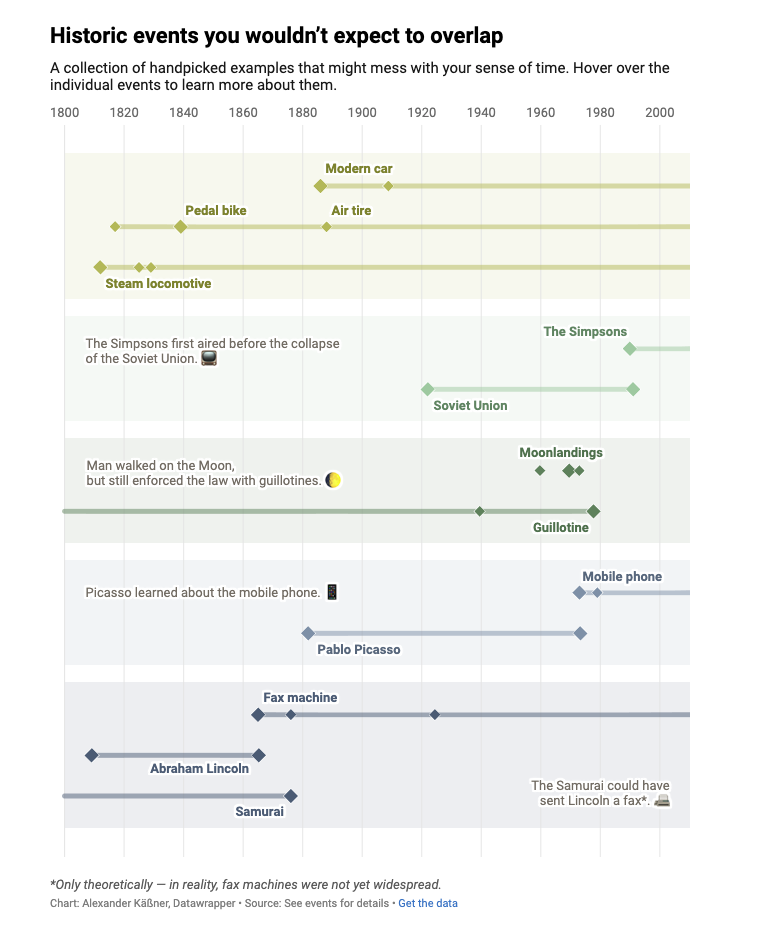
Facts that might mess with your sense of time
Alexander Käßner of DataWrapper questions our sense of time.
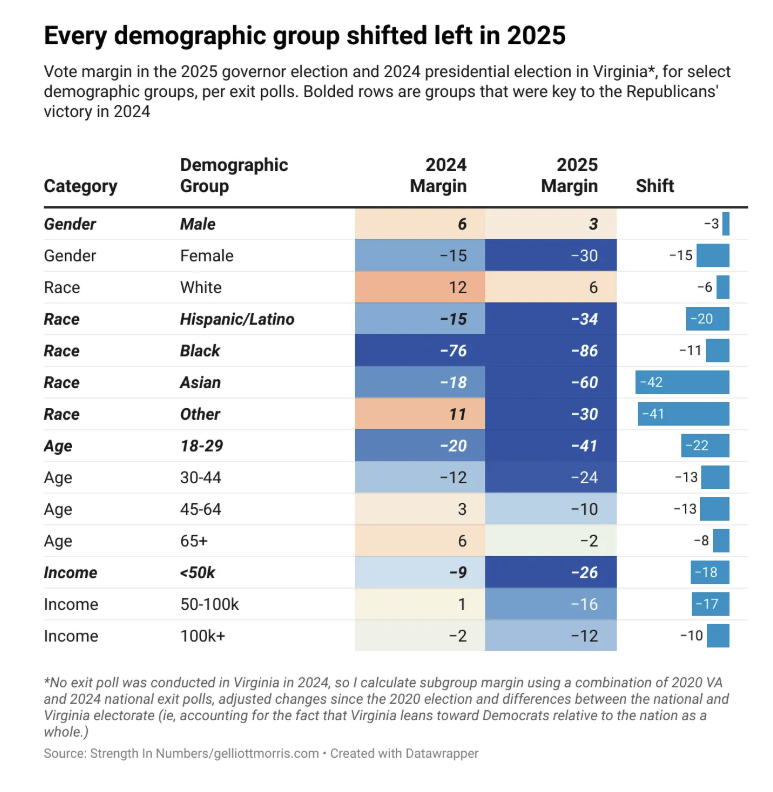
The 2024 Trump "realignment" is already over
"Claims of a conservative realignment of non-whites, the working class, and young voters have been highly exaggerated", claims this analysis by George Elliott Morris.
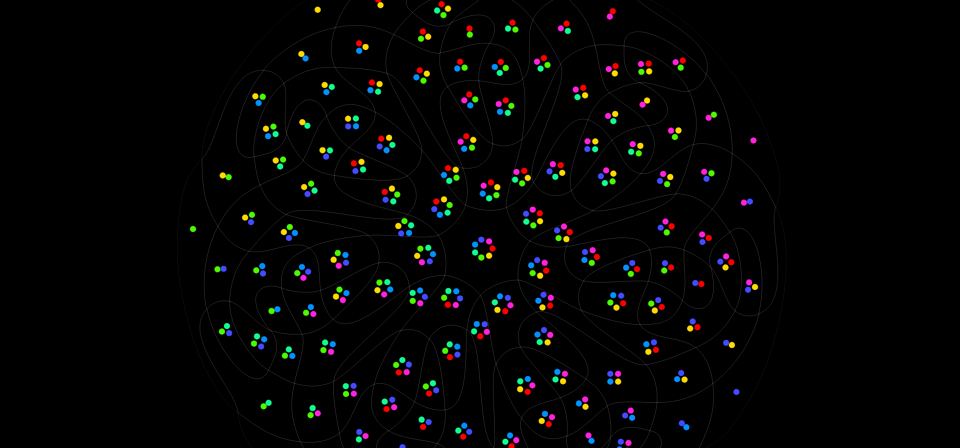
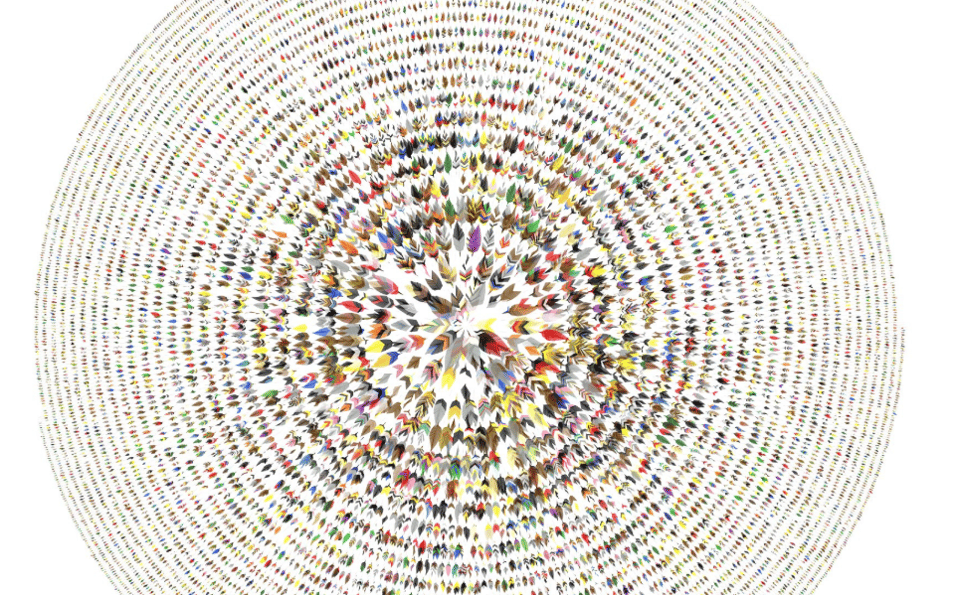
Birds of a feather...
Jer Thorp: "It took me about three months to get here but... Here's a 🪶 for (nearly) every species of bird, with colors extracted from wikipedia descriptions."
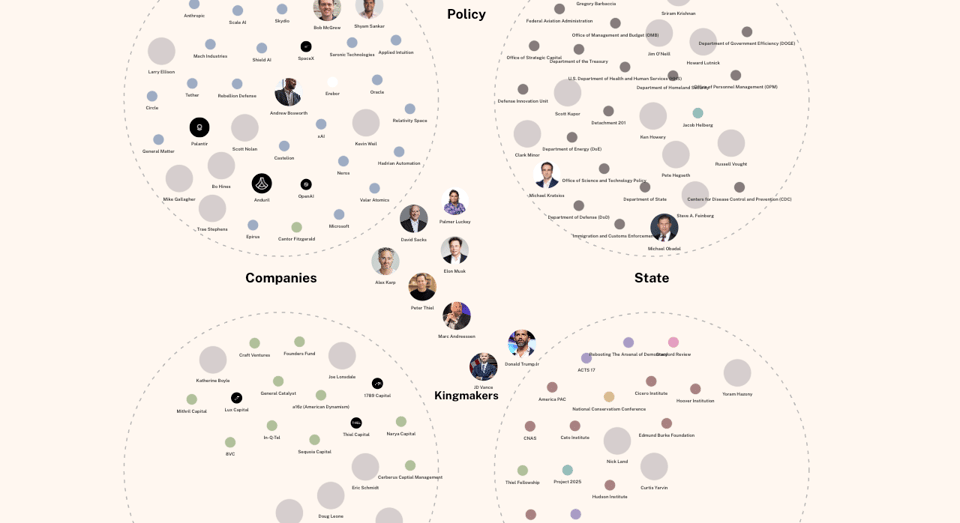
The Authoritarian Stack
Former city data executive and now academic Francesca Bria has written a highly critical piece on "How Tech Billionaires Are Building a Post-Democratic America — And Why Europe Is Next". Whatever your stance on this complex topic, it comes with pretty good visualizations in terms of capturing relationships.
🤖 AI
Careful Consequences Check
Racheld Coldicutt and Careful Industries have launched this interesting AI Consequences Checker, a template for workshops/analysis "to make a rapid assessment of the potential risks and issues involved in using or adopting an AI-powered product, feature, or service."
AI isn’t replacing jobs. AI spending is
"Big spending on artificial intelligence puts pressure on jobs, as gloomy narratives about the future of work are ironically making new graduates less employable."
The majority AI view
Anil Dash: "Technologies like LLMs have utility, but the absurd way they've been over-hyped, the fact they're being forced on everyone, and the insistence on ignoring the many valid critiques about them make it very difficult to focus on legitimate uses where they might add value."
|
DID YOU LIKE THIS ISSUE>? → BUY ME A COFFEE! 
You're receiving this email because you subscribed to Quantum of Sollazzo, a weekly newsletter covering all things data, written by Giuseppe Sollazzo (@puntofisso). If you have a product or service to promote and want to support this newsletter, you can sponsor an issue. |
quantum of sollazzo is also supported by Andy Redwood’s proofreading – if you need high-quality copy editing or proofreading, check out Proof Red. Oh, and he also makes motion graphics animations about climate change.
