631: quantum of sollazzo
#631: quantum of sollazzo – 11 November 2025
The data newsletter by @puntofisso.

Hello, regular readers and welcome new ones :) This is Quantum of Sollazzo, the newsletter about all things data. I am Giuseppe Sollazzo, or @puntofisso. I've been sending this newsletter since 2012 to be a summary of all the articles with or about data that captured my attention over the previous week. The newsletter is and will always (well, for as long as I can keep going!) be free, but you're welcome to become a friend via the links below.
Quantum #630 had an open rate of 51.93% and a click rate of 15.67%.
The most clicked link was 50 Cents adjusted for inflation, but a close (and more useful) second was GeoUtil. You never disappoint.
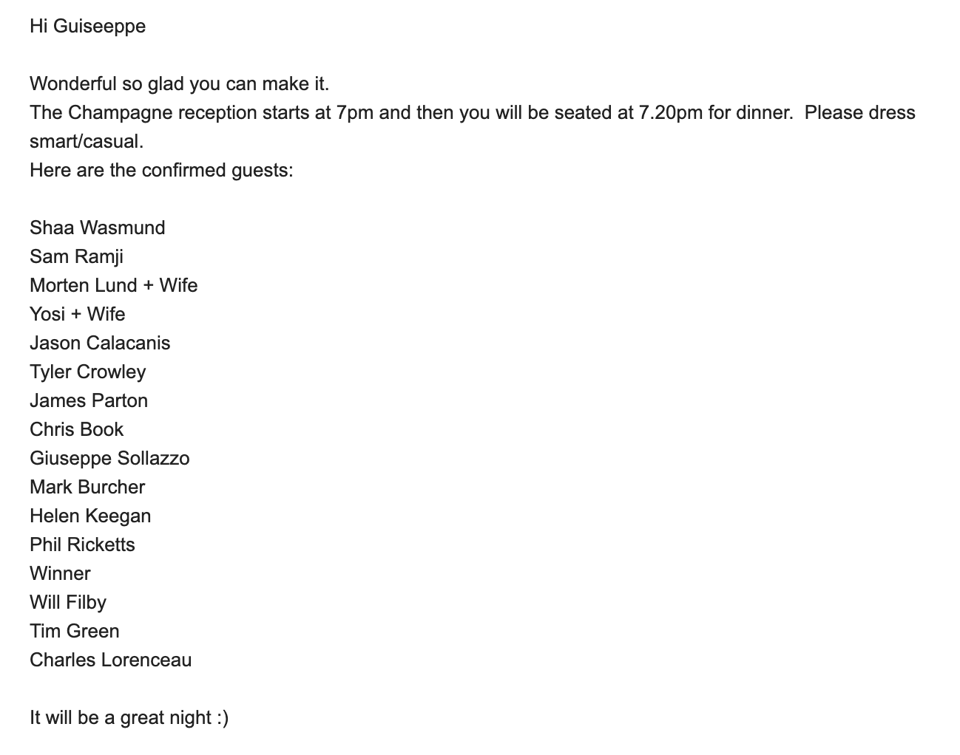
I was reminded of this invite, 14 years ago. The most random and strange night of my life. From the age of social media, I snatched a free ticket to this conference called "The power of one" (held on the 11/11/11 – hence the name) at Battersea Power Station; then by pure chance I was selected as an attendee for the speakers' dinner (I hadn't even realised there was a lottery!). Cue an evening of small talk with people like Morten Lund and Jason Calacanis, feeling inadequate and willing to become an app millionaire (reader: it didn't happen). I learned a bit from that experience, mostly that I didn't necessarily want to be like some of the folks at that table ;-)
(At the conference I also met one of my now best friends and dad of one of the children I sometimes babysit, but that's another story!)
AMA – Ask Me Anything! Submit a question via this anonymous Google form. I'll select a few every 4-5 weeks and answer them on here :-) Don't be shy!

The Quantum of Sollazzo grove now has 35 trees. It helps managing this newsletter's carbon footprint. Check it out at Trees for Life.
'till next week,
Giuseppe @puntofisso.bsky.social
🛎️ Things that caught my attention
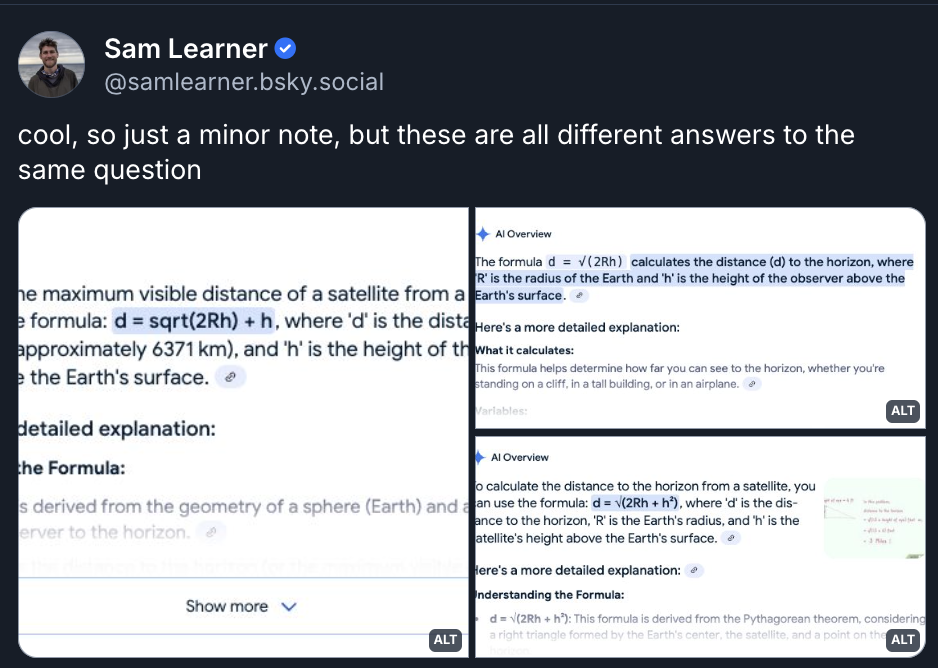
Journo Sam Learner published this great thread of LLMs getting facts wrong.
My friend Esko Reinikainen of Satori Lab, based in Finland, has launched an AI Literacy initiative called "Climbing the AI Literacy ladder".
✨ Topical
Predicting Every Block of the 2025 NYC Mayoral Election
"Spoiler Alert: Zohran Mamdani is going to win" – this data analysis was, in hindsight, right about a few things.

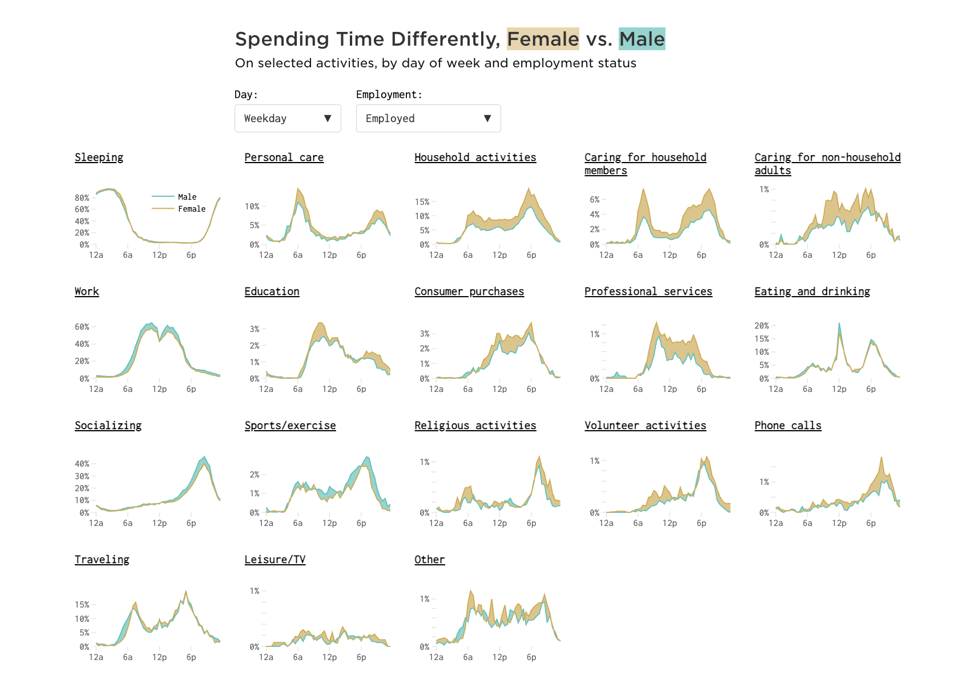
How Men and Women Spend Their Days
Nathan Yau (FlowingData): "Women and men tend to spend their days differently in the United States. Varying responsibilities and priorities will do that."
Based on the ever fascinating American Community Survey, a part of the US Census.
Anti-immigration politics contribute to racism in Germany
Chiponda Chimbelu and Ana Munoz Padros for Deutsche Welle, look at data about racism in Germany, and provide all source code here.

Brain food, delivered daily
Every day we analyze thousands of articles and send you only the best, tailored to your interests. Loved by 505,869 curious minds. Subscribe.

🛠️📖 Tools & Tutorials
The Art of Data Visualization with ggplot2
"The TidyTuesday Cookbook" by Nicola Rennie.

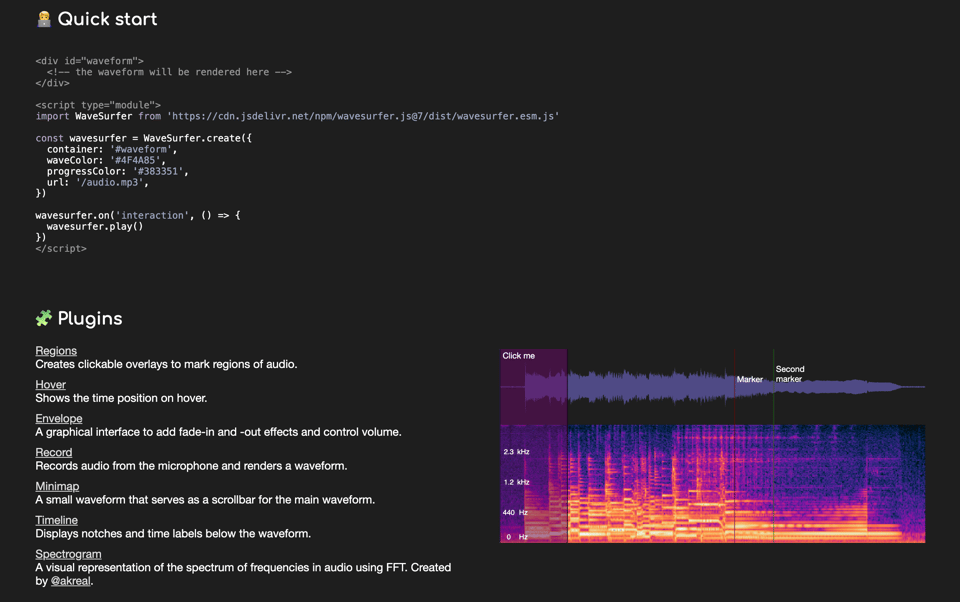
Wavesurver
Wavesurfer is an open source audio waveform player.
Grayscale testing: The missing step in color accessibility
"You ran your contrast check and got the green check, nice work! Checking contrast ratios is one part of color accessibility. The other part is that color can’t be the only way information is conveyed."
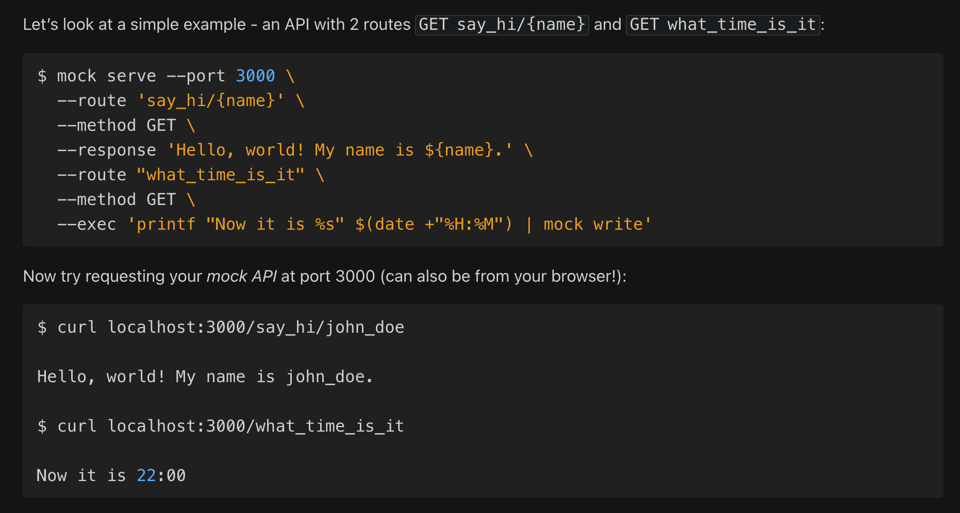
mock
"mock is an API utility - it lets you:
- define API routes easily through API configuration files or through command-line parameters
- use shells scripts as response handlers. Or any other type of program can act as response handlers
- test your API - make assertions on whether an endpoint was requested."
The Case Against pgvector
"What happens when you try to run pgvector in production and discover all the things the blog posts conveniently forgot to mention"
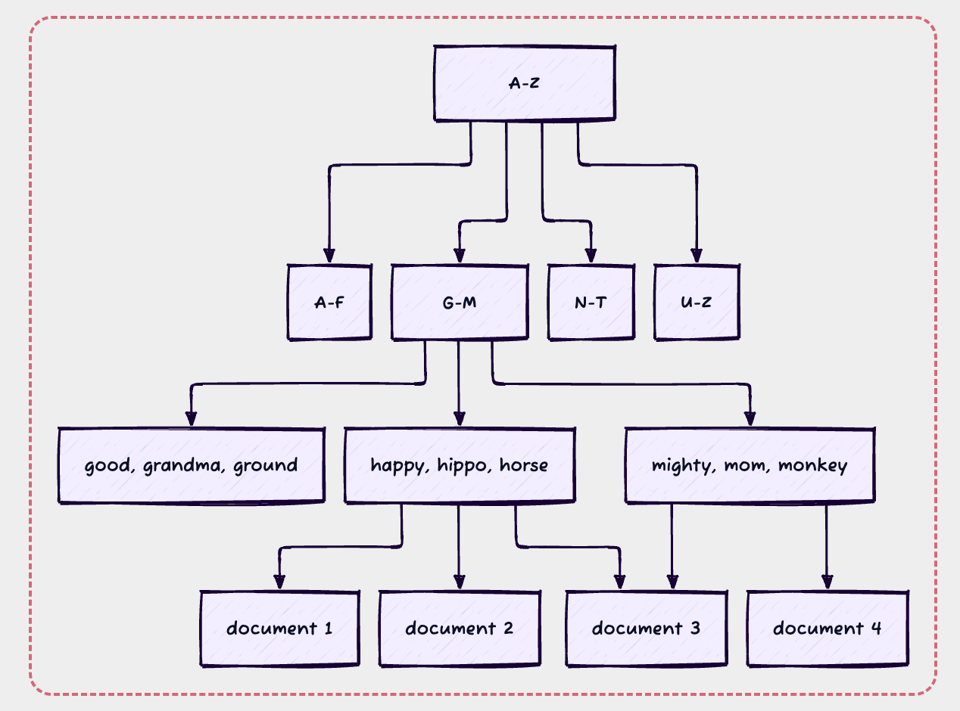
Full Text Search Shenanigans
"A great blog post from 2013 describes using bloom filters to build a space-efficient full text search index for small numbers of documents. ... In this blog post I propose a way of scaling the technique to large document corpuses (e.g. the web) and discuss why that is a bad idea."
Counting the planes overhead
"This week, I was unpacking a lot of the boxes from our old home (yes it's been over a year since we moved), and I found my RTL-SDR dongle."
A nice write-up of how to use a simple dongle to track airplanes through ADS-B data.
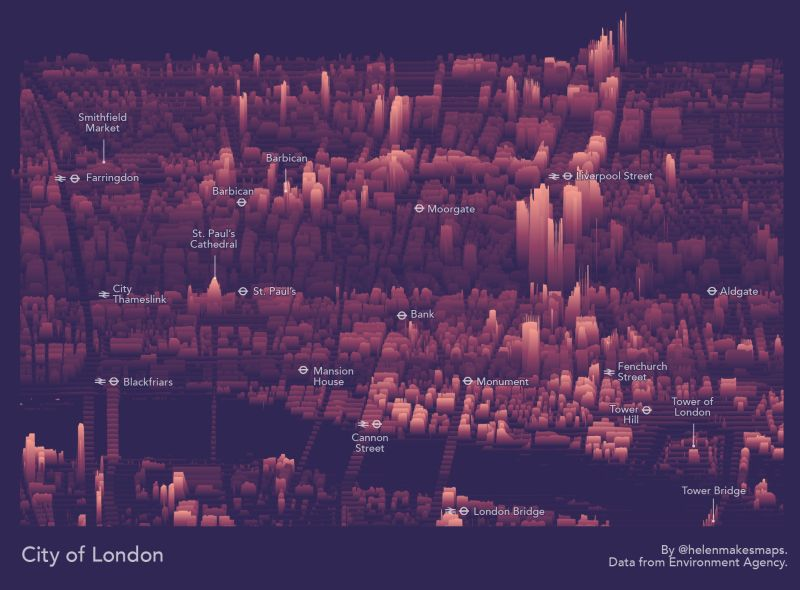
How to Joy Plot
Helen McKenzie: "If you haven't come across joy plots before, they're essentially a series of layered line graphs which build up to give the impression of a 3D landscape. They owe their name to the cover of Joy Division's 1979 album Unknown Pleasures." Here's her tutorial. The image below is from Helen's LinkedIn post, created for the 30 Day Map Challenge.
🤯 Data thinking
Will I Make It To The Restaurant Before The Soup Dumplings Get Cold? (And Other Problems In Machine Learning)
"I'm chronically late. Not because I want to be rude - I feel terrible about it every single time - but because I'm catastrophically bad at predicting how long it takes to get anywhere.
Turns out machine learning algorithms have the exact same problem."
📈Dataviz, Data Analysis, & Interactive
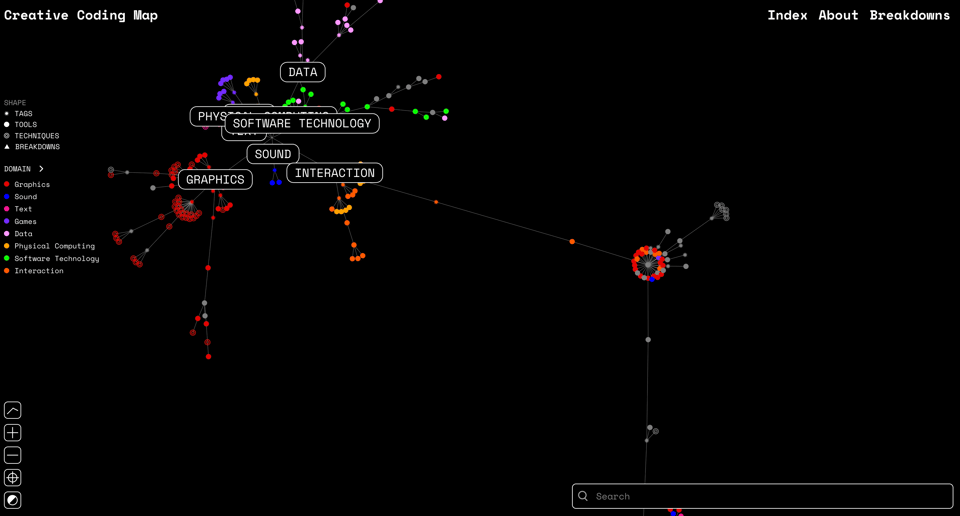
Creative Coding Map
"This living document offers a dynamic visualization of the evolution, relationships, and communities of creative coding tools."
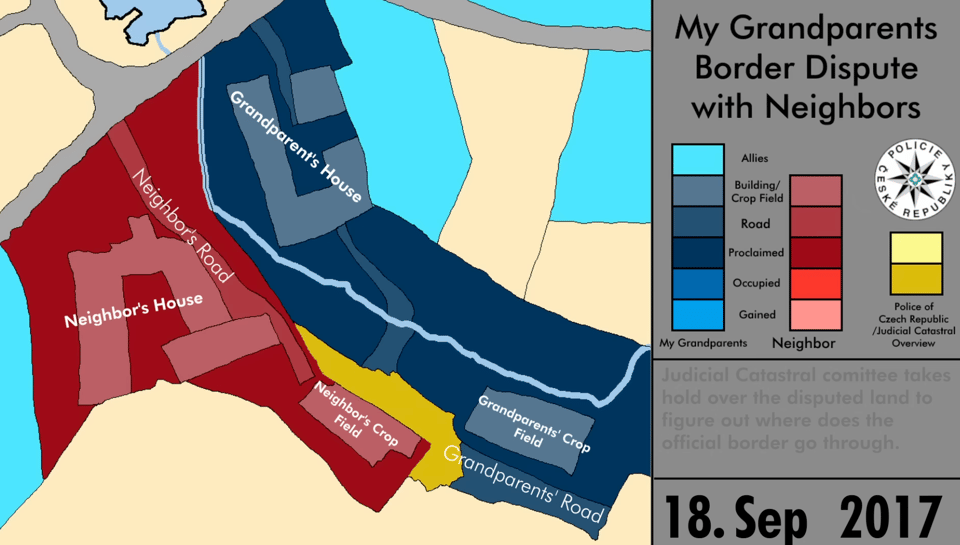
My Grandparents' Border Dispute with Neighbors: Every Day
Hilarious video about a cadastral fight.
(hat tip Alex Wrottesley)
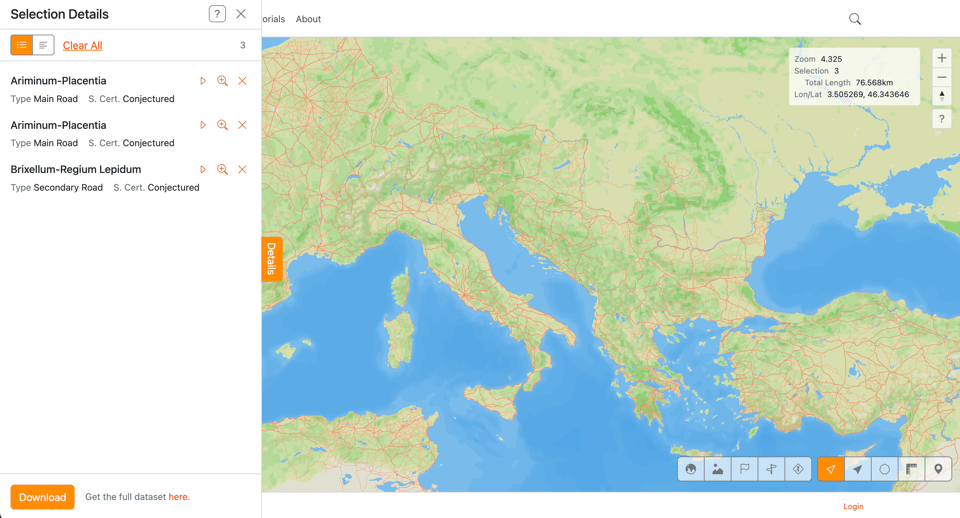
Welcome to Itiner-e – The Digital Atlas of Ancient Roads
"Itiner-e aims to host the most detailed open digital dataset of roads in the entire Roman Empire. The data creation is a collaborative ongoing project edited by a scholarly community. Itiner-e allows you to view, query and download roads."
(via Lucilla Piccari)
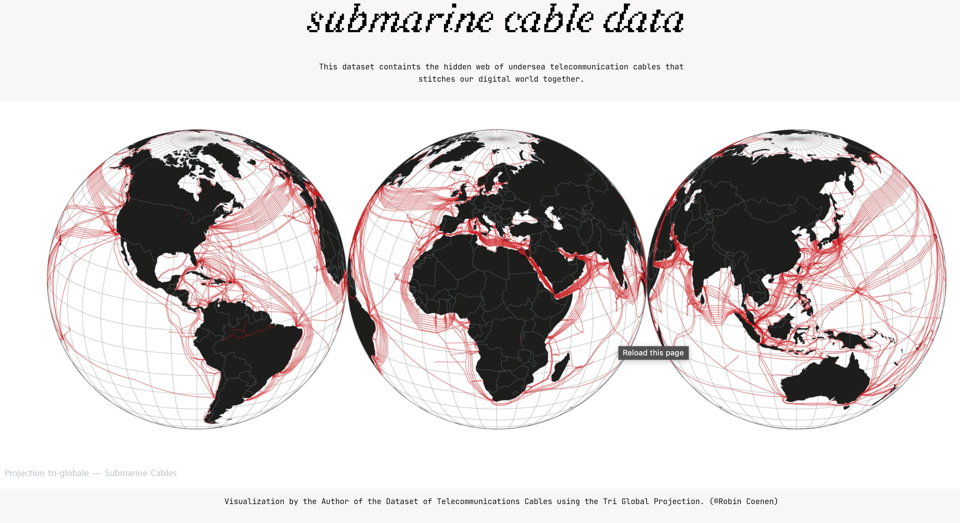
Equal Earth, Triple Earth, Spaceship Earth — Re:port 002
"This Re:port explores the ongoing search for better ways to represent our globe on flat surfaces (most recently with the Tri Global Projection) and highlights global datasets that caught my eye — from historical CO₂ emissions to the hidden web of submarine cables."
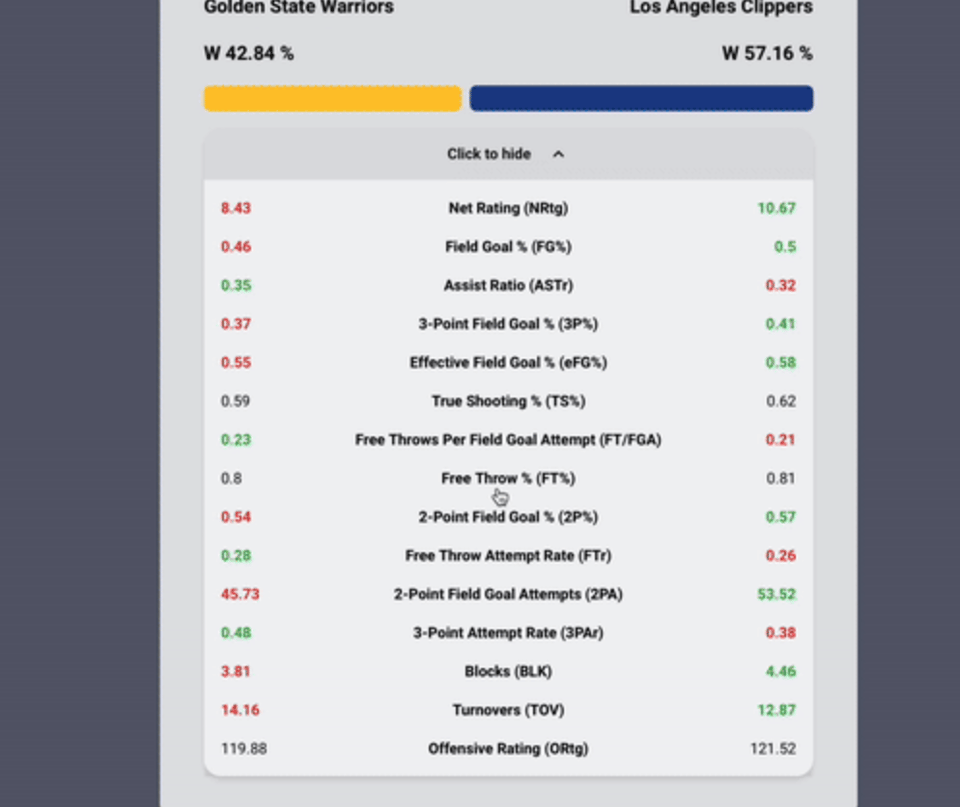
🏀 DeepShot: Predict NBA Games with Machine Learning
"An advanced NBA game predictor powered by historical data from Basketball Reference, rolling statistics, and machine learning — built with NiceGUI for a seamless experience." The source code is here.
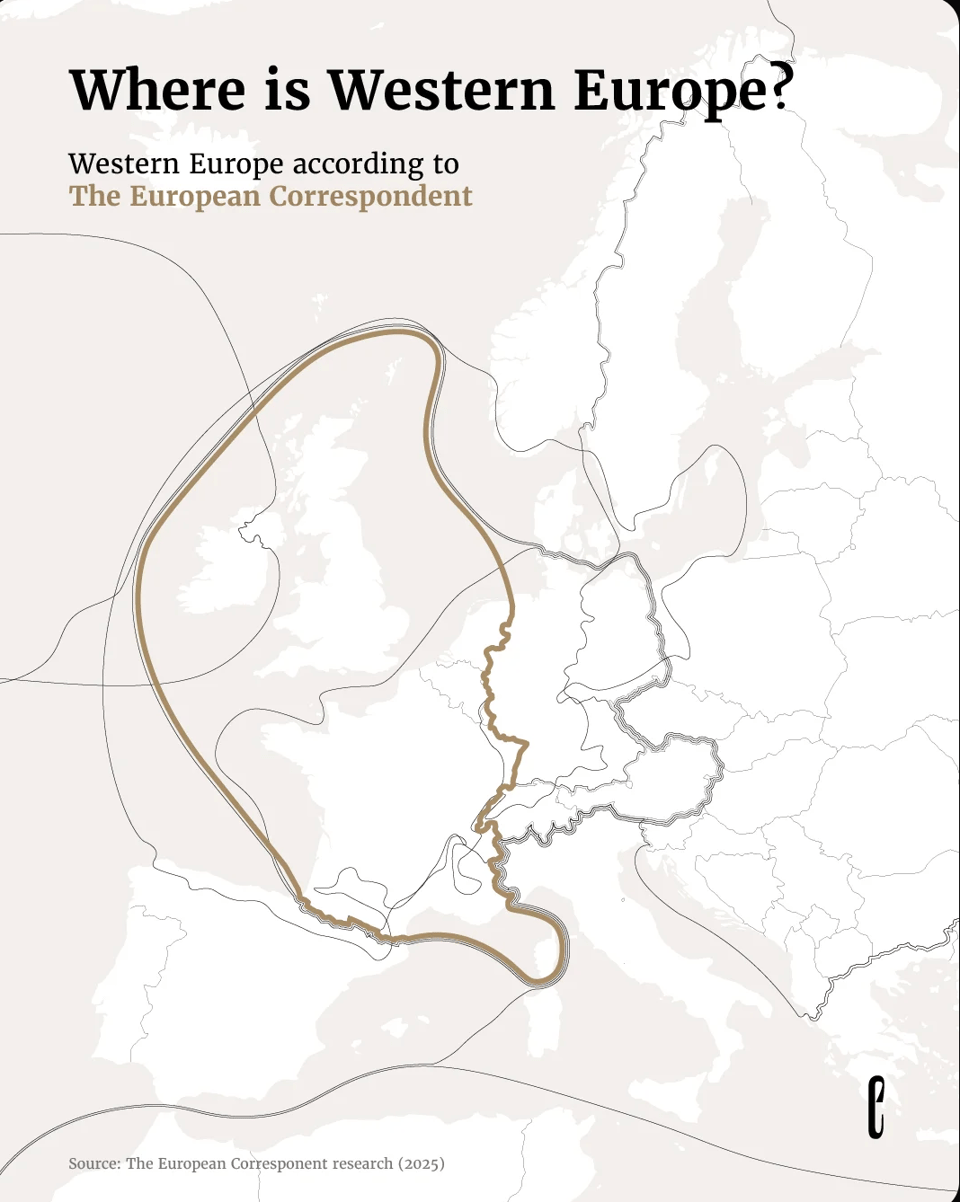
Where is Western Europe?
The European Correspondent: "Recently, we posed the question: ”Where is Europe?” But in everyday conversations, I more often find myself talking about which part of Europe I or someone else is from, or where they’ve travelled. Everyone seems to have their own mental map of Europe, and Western Europe, like every other European sub-region, shifts location depending on who’s drawing it."
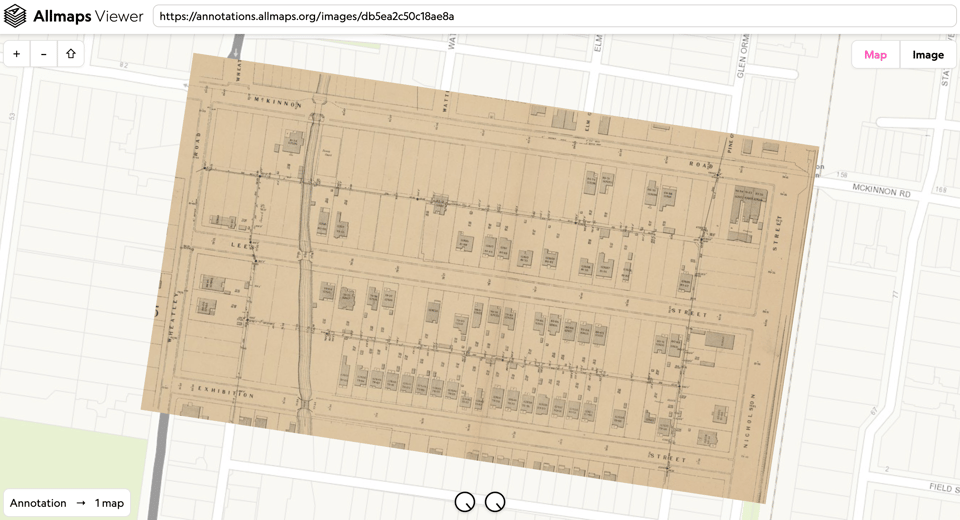
Allmaps
"Millions of maps are available through IIIF, across libraries, archives and museums worldwide. Allmaps makes it easier and more inspiring to curate, georeference and explore collections of digitized maps."
(via Geomob)
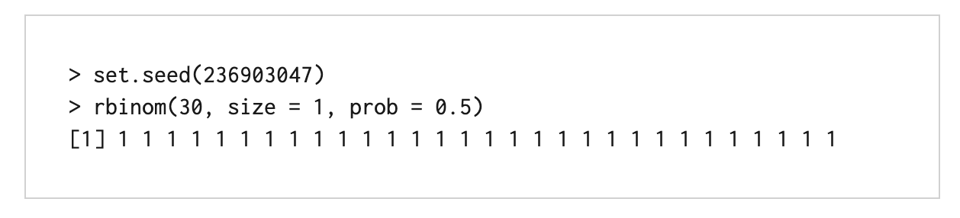
Totally random
"If you take 30 draws from a Bernoulli distribution, e.g., to randomise people to one of two conditions, there’s a 2230=1229=1536,870,912 chance that all 30 will be assigned to the same condition (all 1s or all 0s). That’s vanishingly unlikely, but using the following seed with R’s rbinom produces 30 ones."
🤖 AI
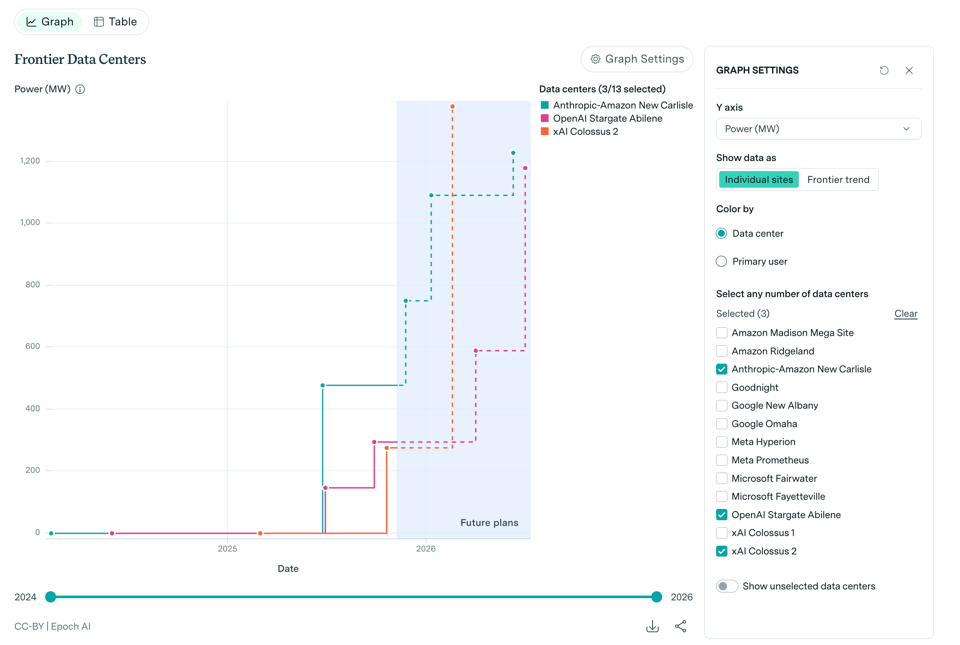
Frontier Data Centers
Epoch AI: "Our open database of large AI data centers, using satellite and permit data to track compute, power use, and construction timelines."
The article also links to data and methodology.
(via Davide Tassinari)
nokode
This is just next level. Dystopian or exciting, you tell me. "A web server with no application logic. Just an LLM with three tools."
Basically, the webserver asks an AI what to do with every request. The obvious "issue" is that it's non-deterministic.
Useful to also read comments on HackerNews, summarised by this exchange:
A – The question posed sounds like "why should we have deterministic behavior if we can have non-deterministic behavior instead?"
B – Because nobody actually wants a "web app". People want food, love, sex or: solutions.
|
DID YOU LIKE THIS ISSUE>? → BUY ME A COFFEE! 
You're receiving this email because you subscribed to Quantum of Sollazzo, a weekly newsletter covering all things data, written by Giuseppe Sollazzo (@puntofisso). If you have a product or service to promote and want to support this newsletter, you can sponsor an issue. |
quantum of sollazzo is also supported by Andy Redwood’s proofreading – if you need high-quality copy editing or proofreading, check out Proof Red. Oh, and he also makes motion graphics animations about climate change.
