618: quantum of sollazzo
#618: quantum of sollazzo – 5 August 2025
The data newsletter by @puntofisso.

Hello, regular readers and welcome new ones :) This is Quantum of Sollazzo, the newsletter about all things data. I am Giuseppe Sollazzo, or @puntofisso. I've been sending this newsletter since 2012 to be a summary of all the articles with or about data that captured my attention over the previous week. The newsletter is and will always (well, for as long as I can keep going!) be free, but you're welcome to become a friend via the links below.
The most clicked link last week was this handy 3D glass generator.
AMA – Ask Me Anything! Submit a question via this anonymous Google form. I'll select a few every 4-5 weeks and answer them on here :-) Don't be shy!

The Quantum of Sollazzo grove now has 31 trees. It helps managing this newsletter's carbon footprint. Check it out at Trees for Life.
'till next week,
Giuseppe @puntofisso.bsky.social
🛎️ Things that caught my attention
Well, not something that caught my attention, strictly speaking – more like me seeking your attention :) I had my Nightingale debut last week, with an article titled "The Bus Station That Didn’t Exist, and Other Data Epiphanies", in which I share the best eureka moments I've had working with data. It is a ca 2500-word summary of my recent talks.
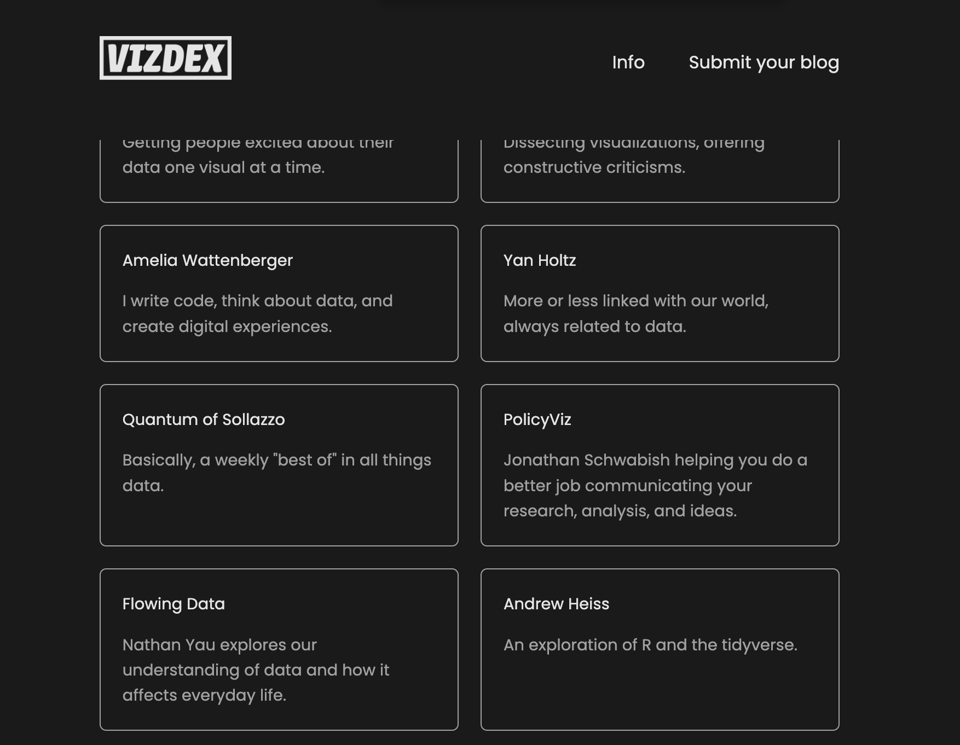
Quantum also joined VizDex, a library of "personal and independent blogs and newsletters dedicated to data visualization. It is updated regularly and does not use any algorithm." Quantum is flattered to be in some big names' company.
✨ Topical
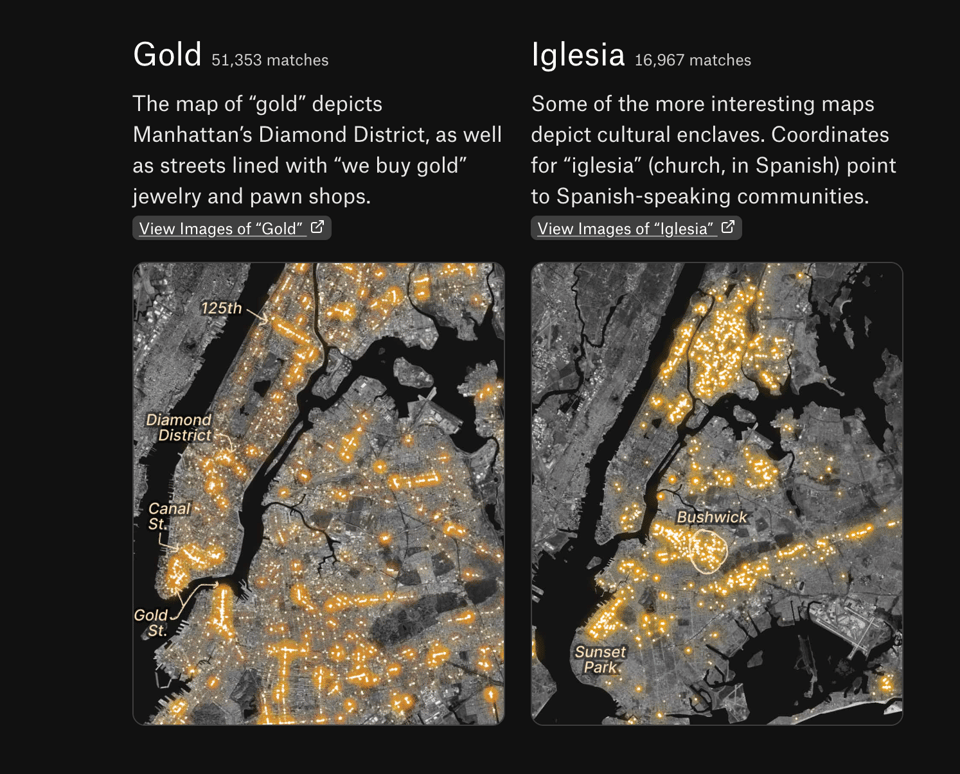
What if you could search every visible word on New York City’s streets?
"This is possible because media artist Yufeng Zhao fed millions of publicly-available panoramas from Google Street View into a computer program that transcribes text within the images (anyone can access these Street View images; you don’t even need a Google account!).
The result is a search engine of much of what’s written in NYC’s streets. It's limited to what a Google Street View car can capture, so it excludes text in areas such as alleyways and parks, or any writing too small to be read by a moving vehicle."
This article by The Pudding presents a pretty cool way of analysing streets.
(via Durand D'Souza)
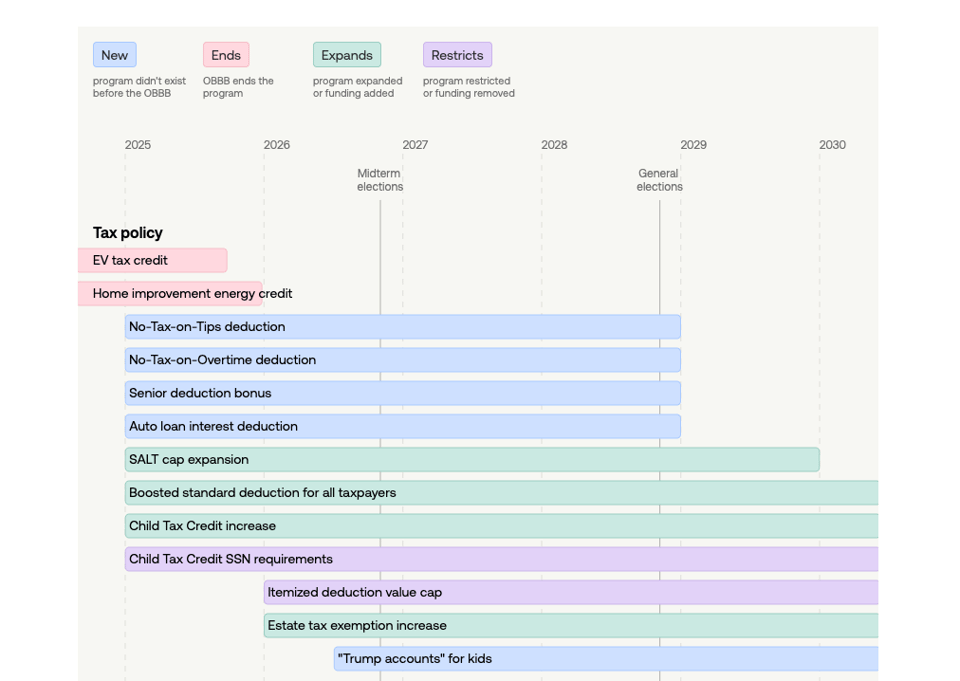
When does the One Big Beautiful Bill take effect?
USAFacts: "The One Big Beautiful Bill, signed into law on July 4, is set to introduce a host of changes to everything from tax reform to government assistance programs to immigration and border policy. It introduces some brand-new policies and expands, restricts, or ends others.
A number of these changes took effect the moment President Trump’s pen struck the dotted line — your 2025 tax return could reflect some of them. Others will go into effect in the coming years, with some not scheduled to arrive until 2028.
This visualization explains what is happening — and when, piece by piece."
Brain food, delivered daily
Every day we analyze thousands of articles and send you only the best, tailored to your interests. Loved by 505,869 curious minds. Subscribe.

🛠️📖 Tools & Tutorials
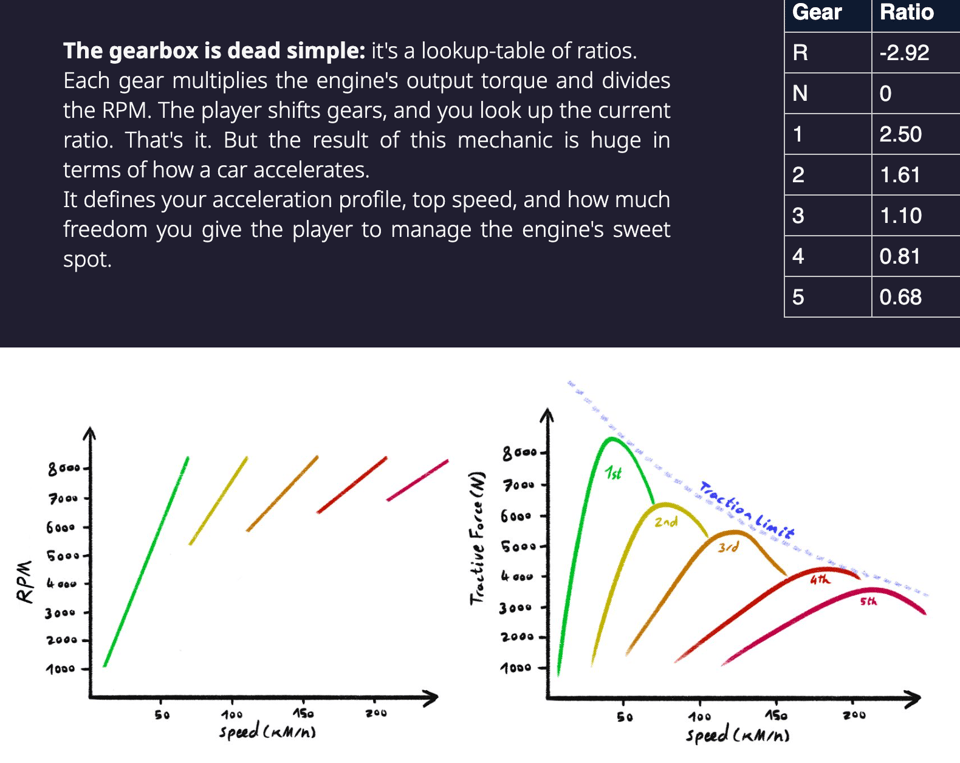
Programming Vehicles in Games
Software developer Wassim Alhajomar writes about "the fundamental principles needed to get a functional vehicle in your game."
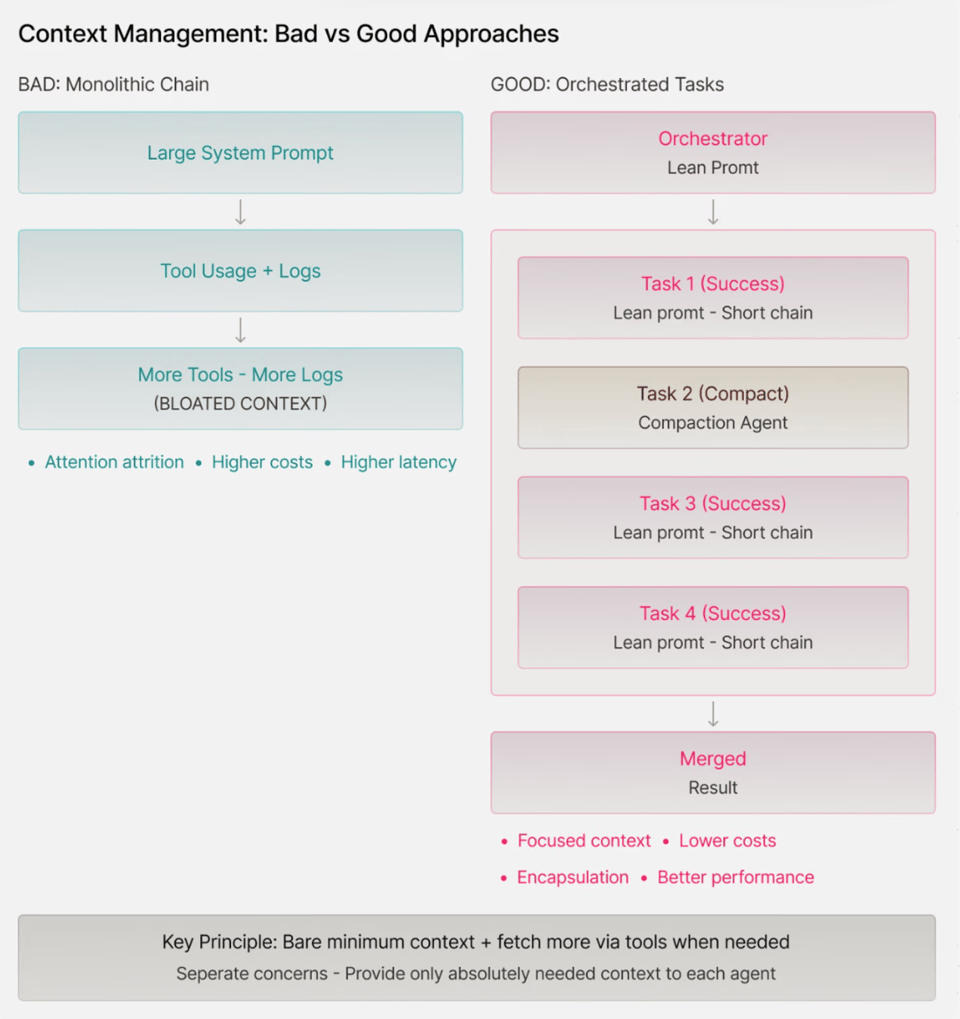
Six Principles for Production AI Agents
"Practical lessons from building production agentic systems."
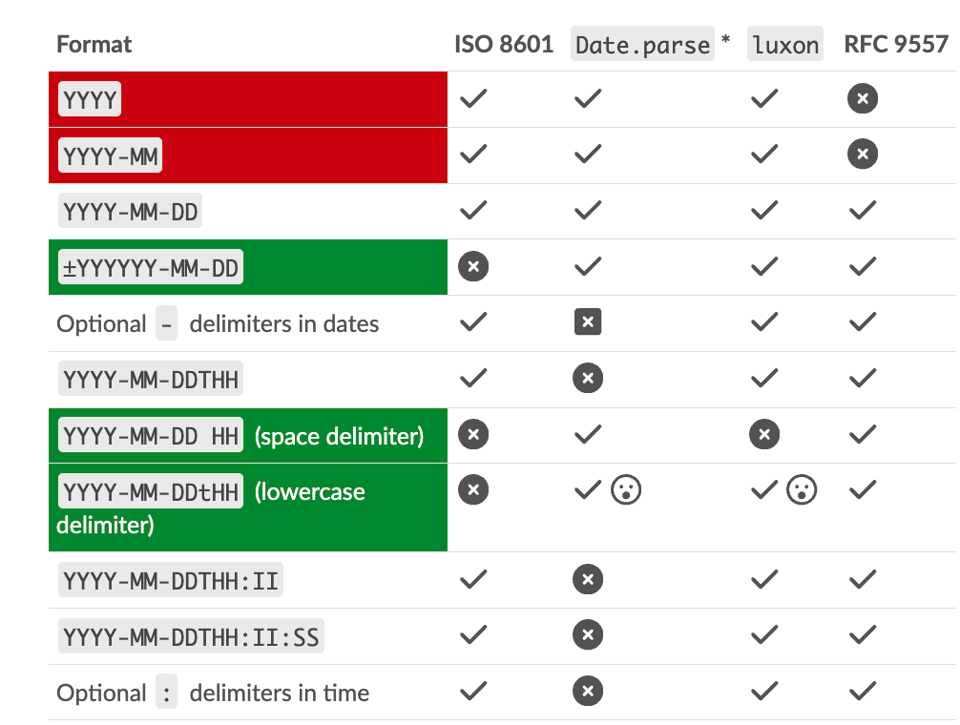
Never write your own date parsing library
"Never. No exceptions." – Zach Leatherman insists.
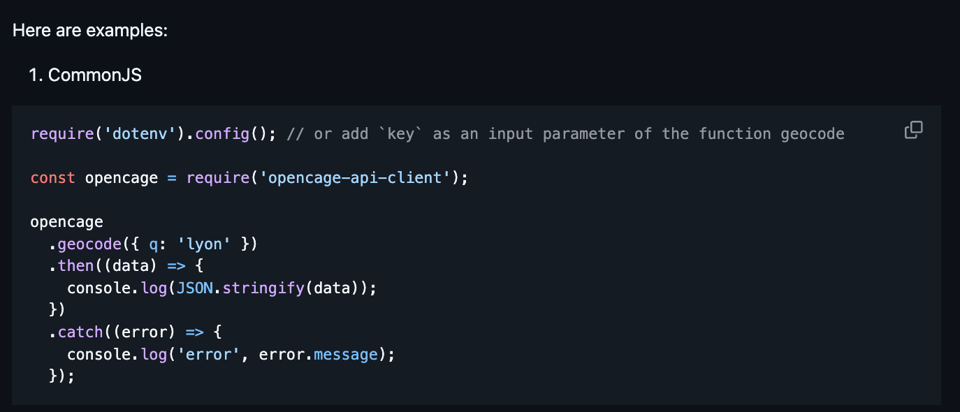
OpenCage API Client
Arnaud Ferrand has released a new version of his open-source library opencage-api-client. This is a a TypeScript/JavaScript wrapper for (previous Quantum sponsors) OpenCage's geocoding API.
It's an easy-to-use, lightweight, promised-based library with full TypeScript support and complete OpenCage Data API coverage.
If you use geocoding in your apps, you may want to take a look.
12 heuristics for content design
"Design heuristics are rule-of-thumb best practice guidelines that typically improve user experience (UX)." They are often not really us data folk's major strength, so I hope this article will help.

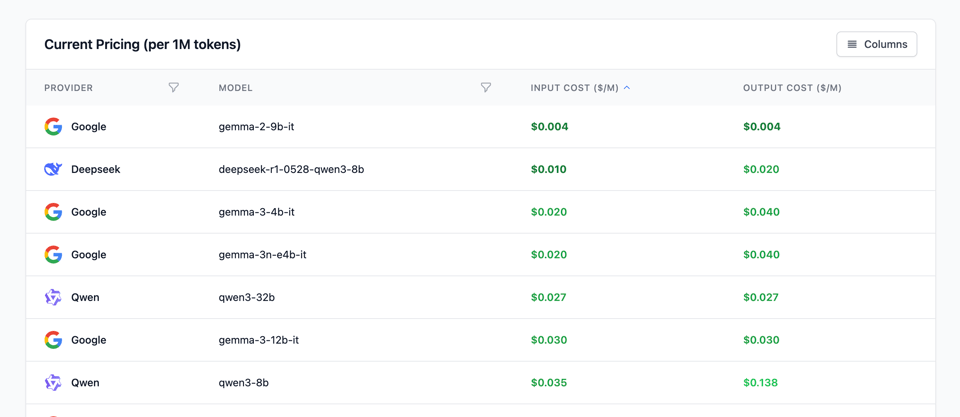
Price Per Token
"Up-to-date pricing information for major LLM APIs including OpenAI, Anthropic, Google, and more. Compare costs across different AI models and find the best value for your use case."
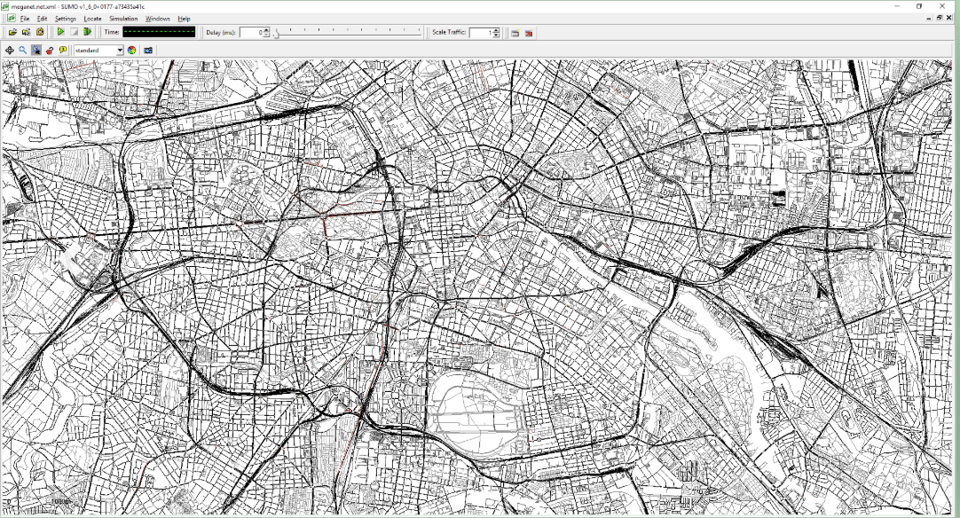
Simulation of Urban MObility
"Welcome to Eclipse SUMO (Simulation of Urban MObility), an open source, highly portable, microscopic and continuous multi-modal traffic simulation package designed to handle large networks."
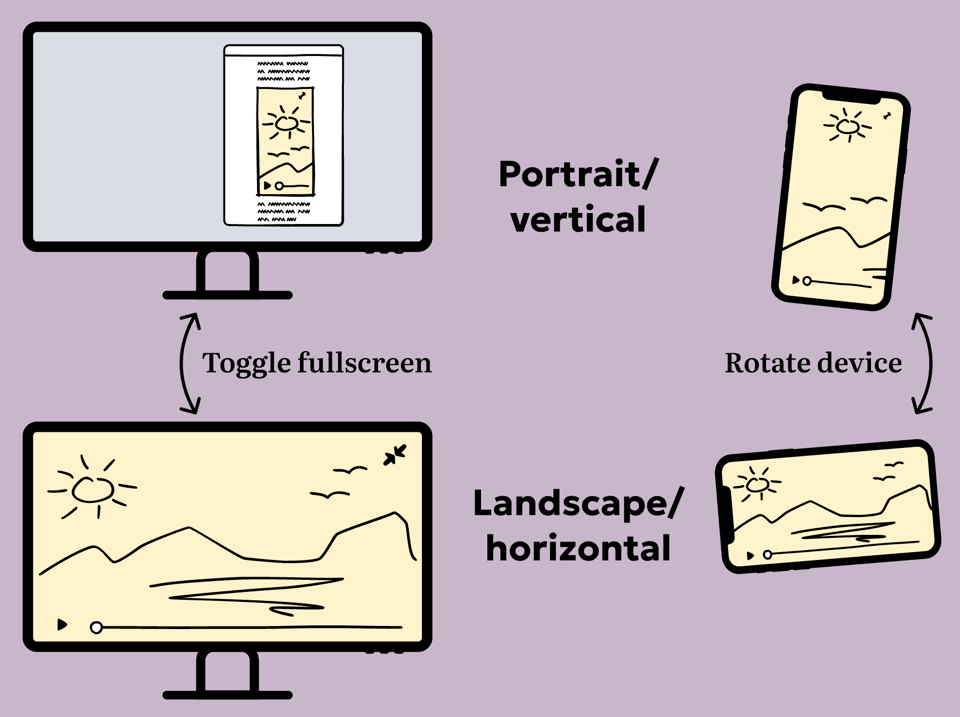
Responsive video is (almost) easy now
This article explains why avoiding embedding videos from video streaming platforms into websites allows the creation of a better user experience. It starts from the ability of hosting both vertical and horizontal videos.
🤯 Data thinking
Doing SQL work with LLM aids as a SQL addict
"It could be better, it could be worse", says Randy Au.
"But even if syntax is a relatively low point of friction, it's still a point of friction. So there's lots of smart ways to ease some of the bumps involved. So keep understanding and designing your SQL manually. That skill ain't turning obsolete anytime soon."
📈Dataviz, Data Analysis, & Interactive
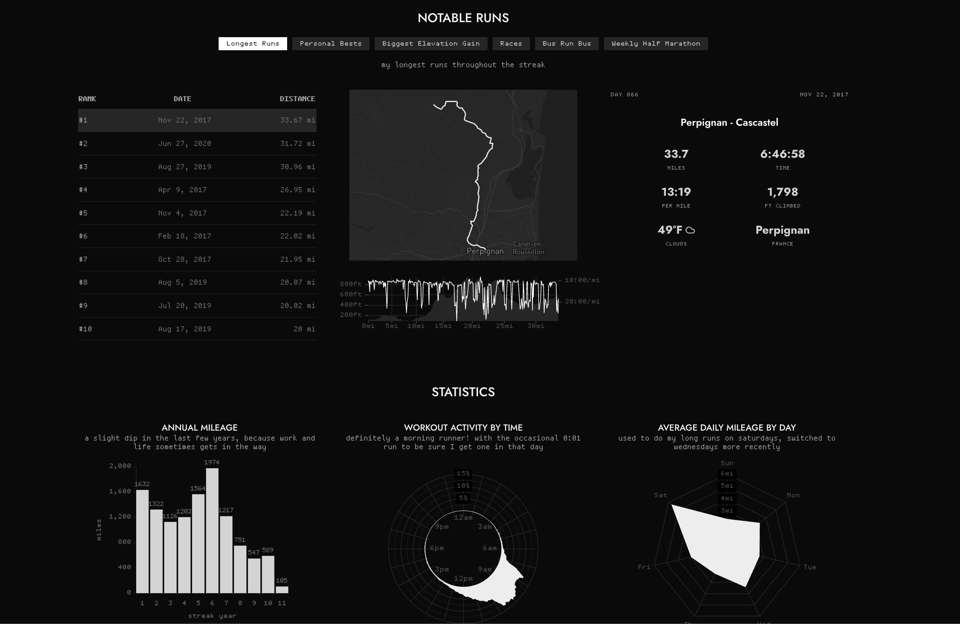
No days off
This guy has been running every day for over ten years, and built this website to visualize his feats.
You could run Doom on 16 billion crabs
"Someone figured out how to make logic gates based on crabs, so running Doom on crabs is now only a matter of time (and crabs)", while someone else has recently saved a PNG image to a bird (seriously... but you really need to get what he's doing here!)
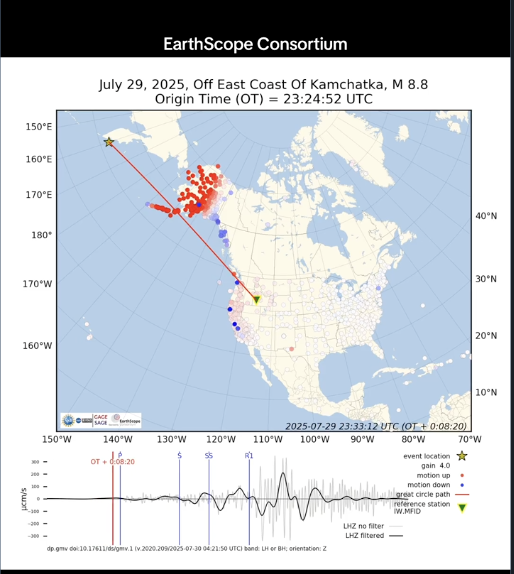
Watch the seismic waves from the magnitude 8.8 earthquake...
"...off the coast of Russia sweep beneath seismic stations in North America. By the time the waves reached North America, they are far too small to be felt by people, but can still be detected by seismic instruments."
This BlueSky update is using data from EarthScope, but I haven't managed to locate the actual page. If you do, please let me know.
(via Chris Weston)
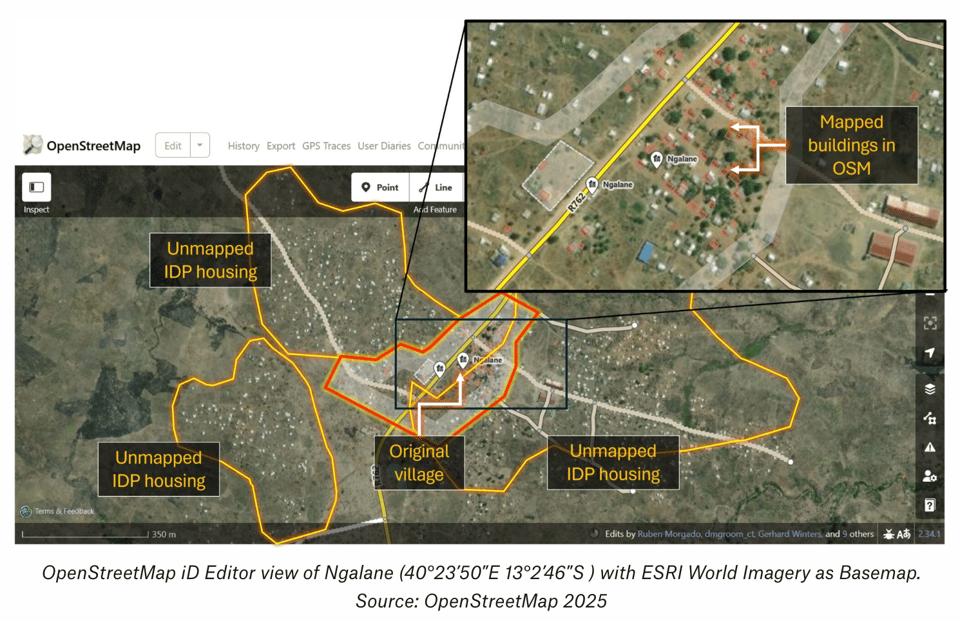
The Story of a Storm Part II: Visualising Conflict and Displacement Data
"In Part One of The Story of a Storm we showed you how to turn raw climate data into visualisations using NASA’s Giovanni tool and to plot it with Google Earth Pro Desktop.
In Part Two, we’ll focus on conflict and displacement data."
🤖 AI
The tech bros are making themselves sick
Ryan Broderick writes about LLM-induced psychosis: "I have to actually hold off on writing about every instance of ChatGPT-induced psychosis that comes across my feed right now because I don’t want to overwhelm you, dear reader. But make no mistake, it’s absolutely happening at an alarming rate."
Maybe a bit exaggerated, but interesting.
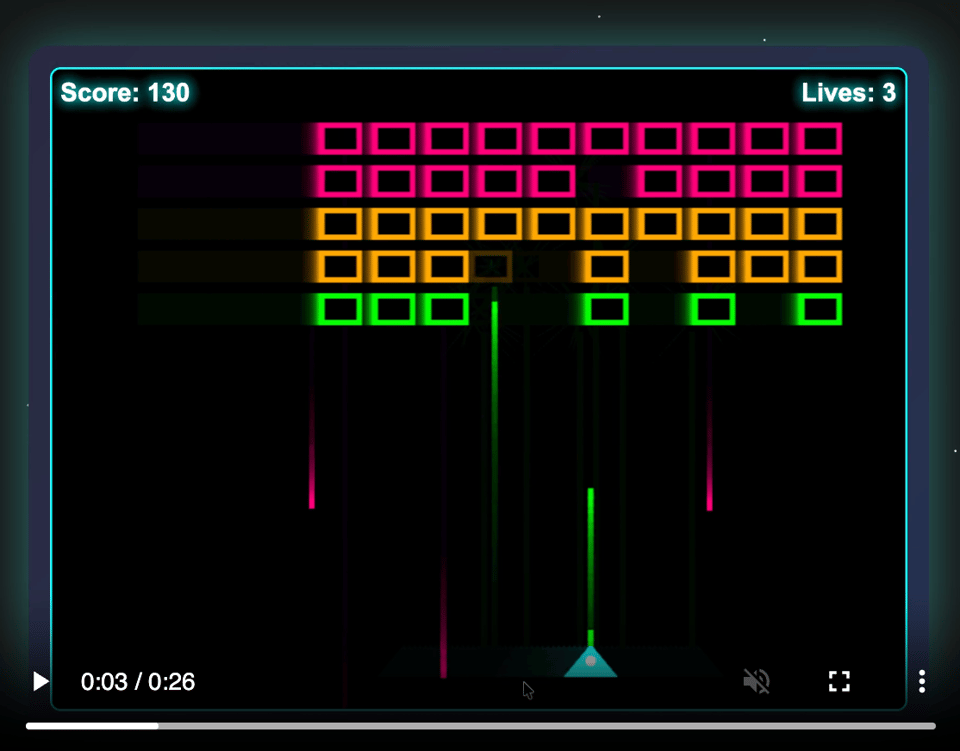
My 2.5 year old laptop can write Space Invaders in JavaScript now, using GLM-4.5 Air and MLX
Simon Willison: "I fed it the following prompt:
Write an HTML and JavaScript page implementing space invaders
And it churned away for a while and produced the following:"
|
DID YOU LIKE THIS ISSUE>? → BUY ME A COFFEE! 
You're receiving this email because you subscribed to Quantum of Sollazzo, a weekly newsletter covering all things data, written by Giuseppe Sollazzo (@puntofisso). If you have a product or service to promote and want to support this newsletter, you can sponsor an issue. |
quantum of sollazzo is also supported by Andy Redwood’s proofreading – if you need high-quality copy editing or proofreading, check out Proof Red. Oh, and he also makes motion graphics animations about climate change.
