605: quantum of sollazzo
#605: quantum of sollazzo – 15 April 2025
The data newsletter by @puntofisso.

Hello, regular readers and welcome new ones :) This is Quantum of Sollazzo, the newsletter about all things data. I am Giuseppe Sollazzo, or @puntofisso. I've been sending this newsletter since 2012 to be a summary of all the articles with or about data that captured my attention over the previous week. The newsletter is and will always (well, for as long as I can keep going!) be free, but you're welcome to become a friend via the links below.
The most clicked link last week was the, erm, vaguely controversial Looks Mapping – a great example of how... NOT to use AI :)
It's AMA o'clock! This is the Quantum of Sollazzo Ask Me Anything section.
AMA – Ask Me Anything by submitting a question via this anonymous Google form. If there are many questions, I'll select a few every 4-5 weeks and answer them on here :-) Don't be shy!

The Quantum of Sollazzo grove now has 30 trees. It helps managing this newsletter's carbon footprint. Check it out at Trees for Life.
QUANTUM GOES ON HOLIDAY FOR A FEW WEEKS
Sorry folks, I'm taking a little break. All going to plan, Quantum will return on Tuesday, May 13th. You're welcome to send me questions, ideas, requests :-)
'till next week,
Giuseppe @puntofisso.bsky.social
✨ Topical
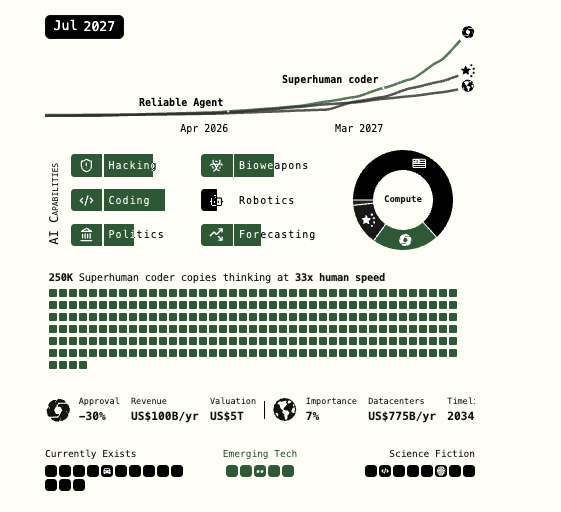
AI 2027
"We predict that the impact of superhuman AI over the next decade will be enormous, exceeding that of the Industrial Revolution.
We wrote a scenario that represents our best guess about what that might look like.1 It’s informed by trend extrapolations, wargames, expert feedback, experience at OpenAI, and previous forecasting successes."
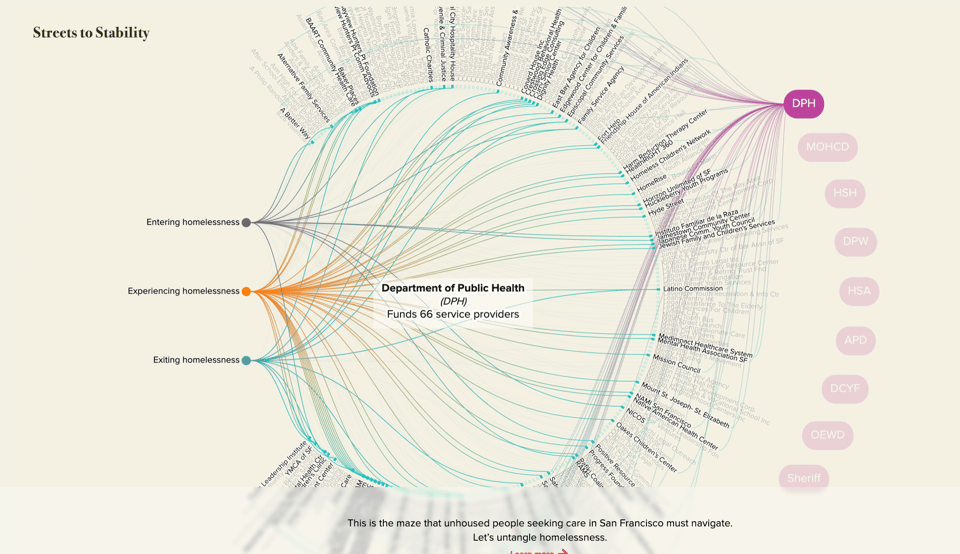
Streets to Stability – Breaking the cycle of homelessness in San Francisco
"San Francisco is world-renowned for its landmarks—the Golden Gate Bridge and cable cars—and as the birthplace of companies like Airbnb, OpenAI, Levi Strauss and Uber. Sadly, it has also become well known for the 8,300 people within its boundaries who sleep in doorways, cars, and tents and beneath bridges on any given night."
Brilliantly illustrated.
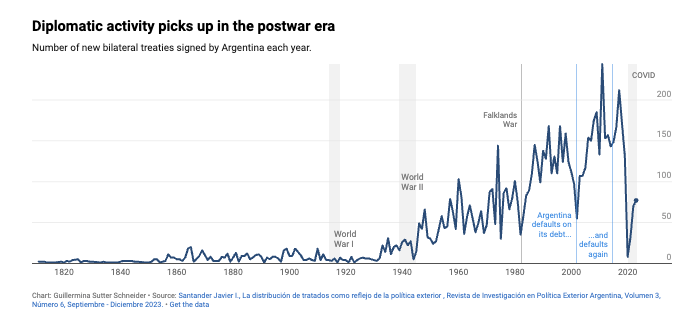
Two to tango: 200 years of Argentina’s diplomatic relations
Datawrapper's Guillermina Sutter Schneider takes a look at Argentina's relationships with the rest of the world. Extra points for the title, obviously.
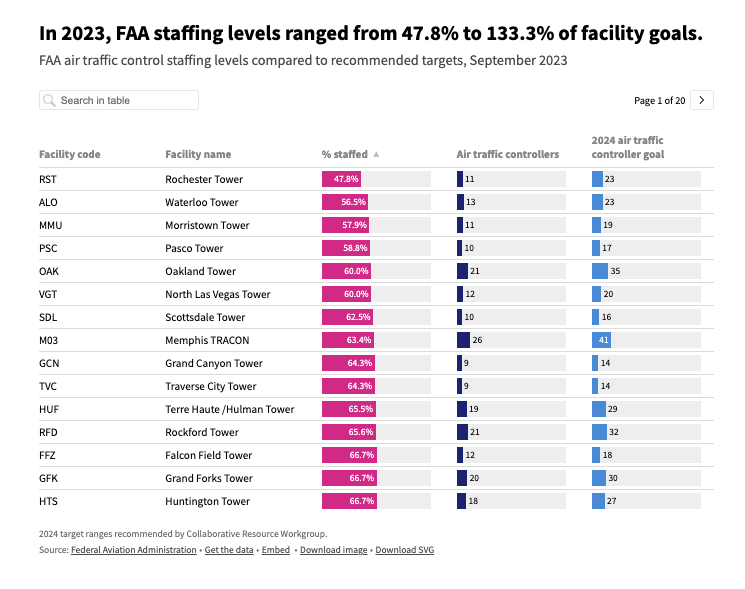
Is there a shortage of air traffic controllers?
USA Facts and the issue of short-staffing of air traffic controllers in the US: "Although hiring has increased and reforms are underway, the FAA is working to close staffing gaps nationwide."
This reminds me of one of the most famous crises of the 80s, when an air traffic controller strike resulted in Ronald Reagan's administration firing most of the strikers.
Brain food, delivered daily
Every day we analyze thousands of articles and send you only the best, tailored to your interests. Loved by 505,869 curious minds. Subscribe.

🛠️📖 Tools & Tutorials
Anime.Js
"All-in-one animation engine. A fast and versatile JavaScript library to animate anything."
An impressive set of features, including great scroll management, which could make it useful for very interactive visual stories (especially those based on scrollytelling). However, the learning curve is steep.

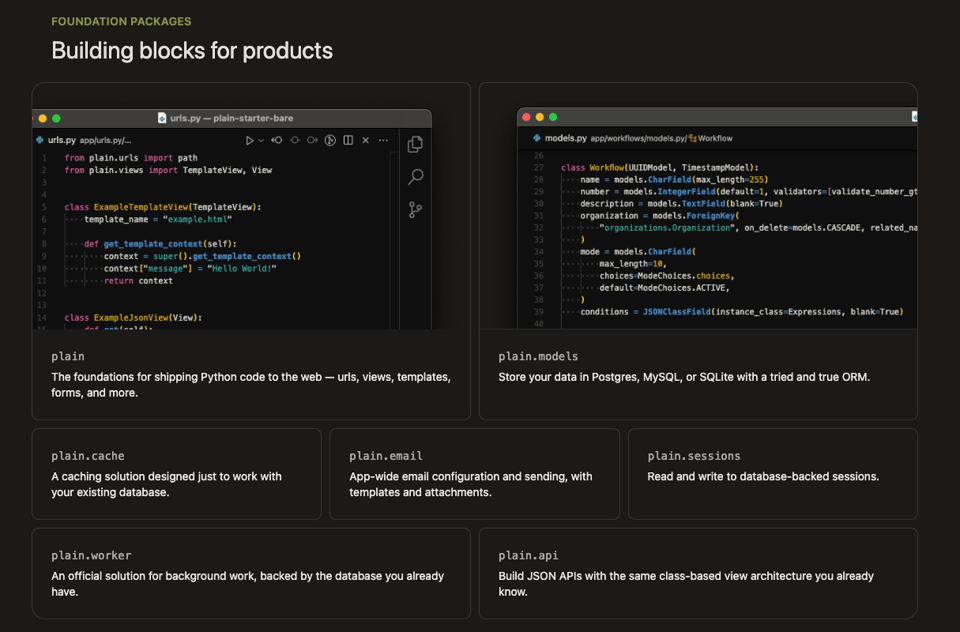
Plain
"A web [framework])(https://plainframework.com/) for building products with Python."
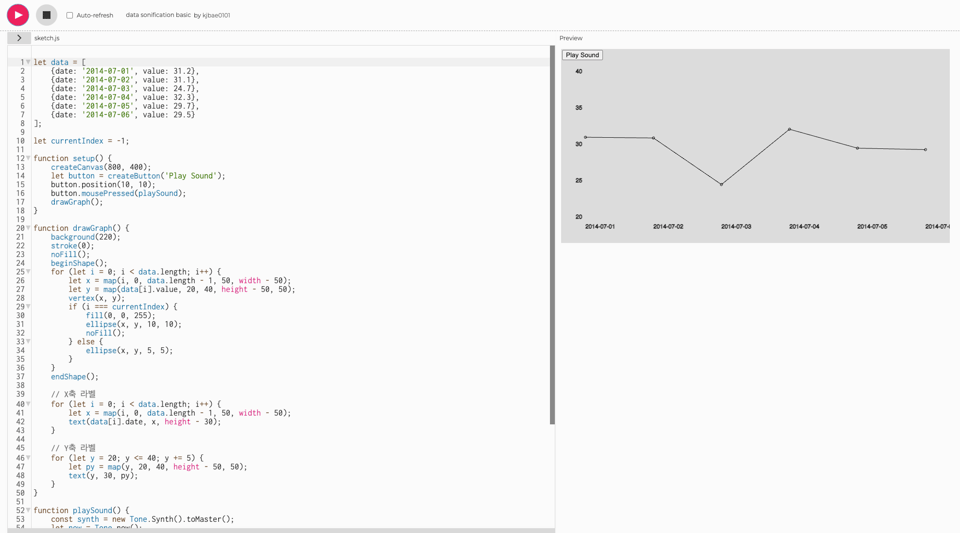
Data sonification with P5
Just a bit of sample code.
OmniSVG: A Unified Scalable Vector Graphics Generation Model
An AI tool that generates SVGs from icons. It's work-in-progress, as the pretrained model is still in the TODO list, but here's the code repo, and this is the paper explaining it.

Data Compass AI
"Making organizations' data maturity levels transparent. ... Data Compass's mission is to make organizations' data maturity levels (be they large corporations, startups, non-profits, or government agencies) transparent to data job seekers and the data community. And also to allow organizations to see how their data maturity stacks up against others in their industry."
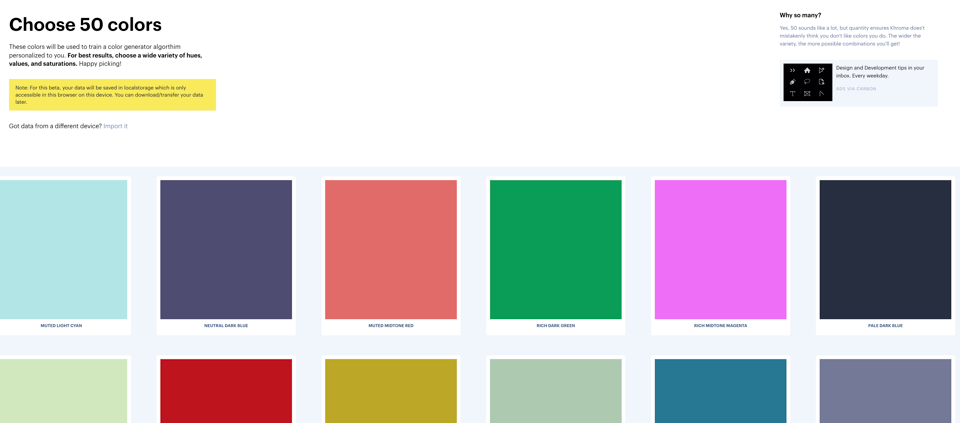
Khroma
"Design with colors you love. Khroma uses AI to learn which colors you like and creates limitless palettes for you to discover, search, and save."
To be honest, selecting 50 colours this way is a bit of a faff, but the concept is intriguing.
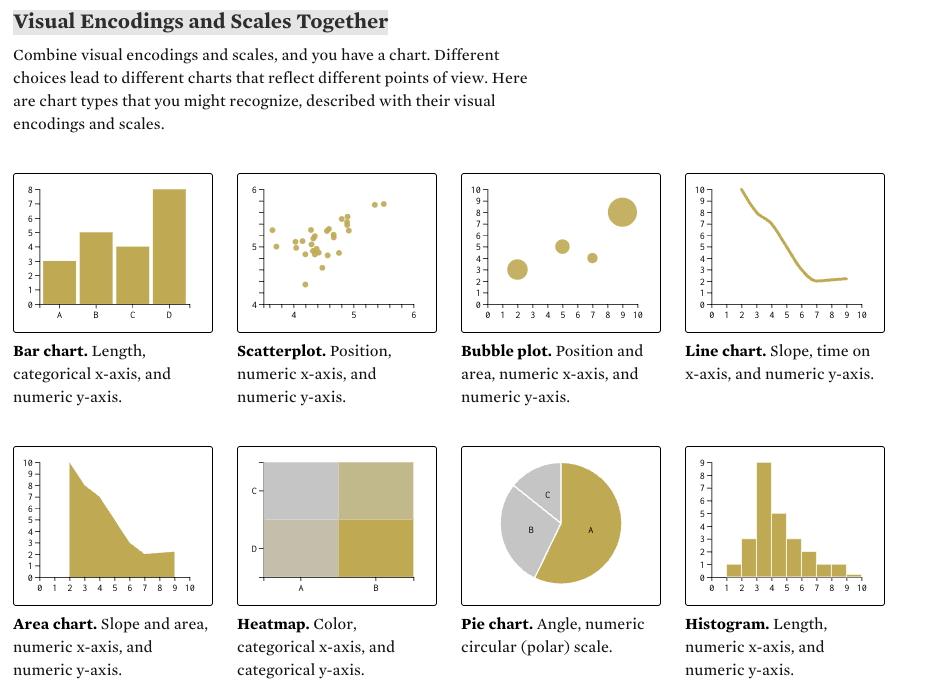
Defense Against Dishonest Charts
"Charts are a window into the world. When done right, we gain an understanding of who we are, where we are, and how we can become better versions of ourselves. However, when done wrong, in the absence of truth, charts can be harmful.
This is a guide to protect ourselves and to preserve what is good about turning data into visual things."
From FlowingData, a very useful tutorial.
🤯 Data thinking
Measuring clouds... okay, cloudy water (and air)
"In the tail end of 2024, the water system that serves NYC had declared a drought warning because we didn't get enough rain for most of the Fall season. Since then, out of idle curiosity I check the official page for the current reservoir levels. The drought warning was lifted in early January since we had a lot of big snow events upstate this winter."
But also: "Why must the references be remade on a very regular basis? Because there's a process called "Ostwald ripening" that happens to suspensions of solids and liquids where small particles will, over time, clump together and form larger crystals or bodies because clumping puts the system into a better (lower energy) thermodynamic state."
How Analytics Marginalized Baseball’s Superstar Pitchers
"Why has pro baseball made it so hard for today’s pitchers to achieve greatness?"
📈Dataviz, Data Analysis, & Interactive
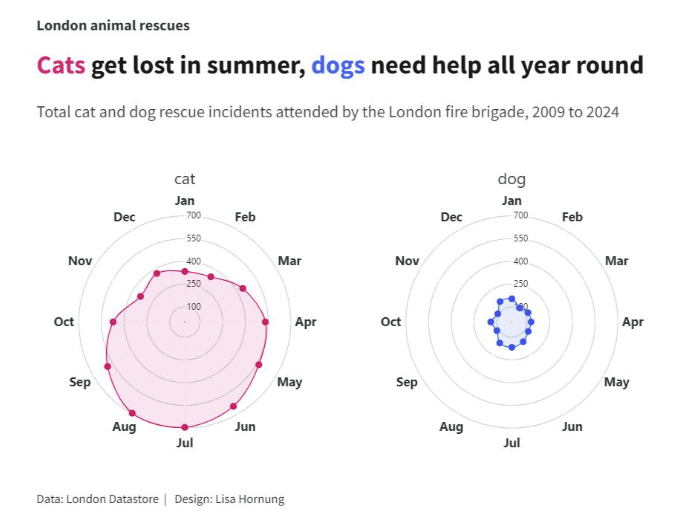
Cats get lost in summer, dogs need help all year round
Aside from the beauty of the chart, this is the ever impressive Lisa Hornung taking on the #30DayChartChallenge and releasing code (also see her full list of charts on GitHub).
A truly exceptional... pet project.
(I'm so sorry.)
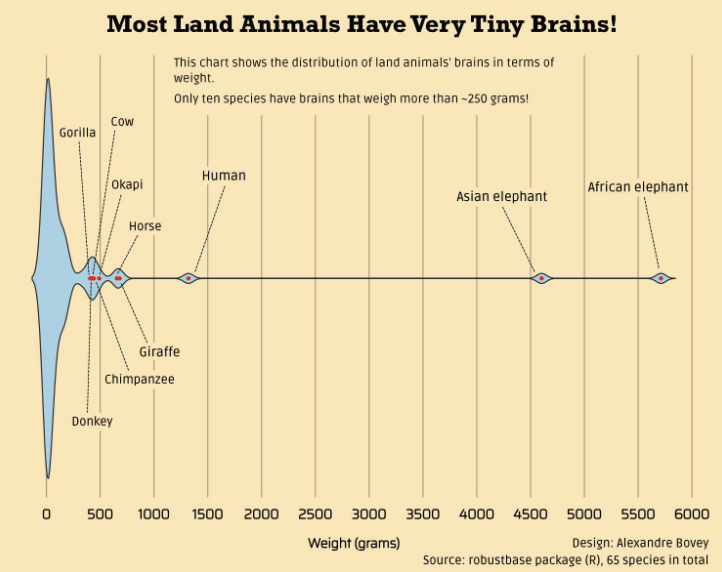
Most Land Animals Have Very Tiny Brains!
Yet another #30DayChartChallenge example about animals.
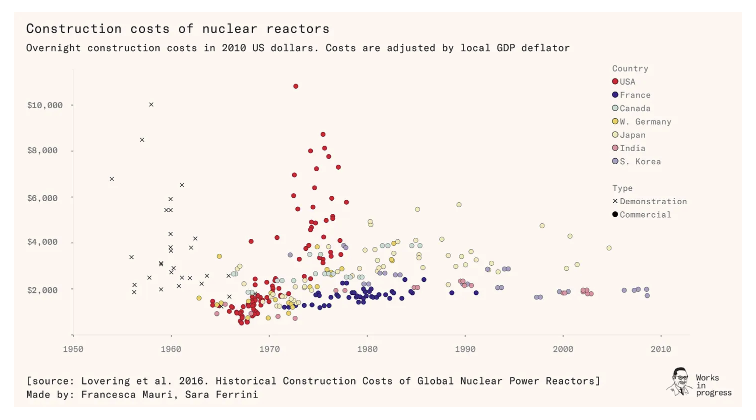
A syllabus for nuclear power
An article on nuclear power, which comes with very good dataviz included.
Studies in distortions
"Manifestations, manifestos, and other inspirations by Agnes Denes."
Philosophical art through the medium of geographic projections.

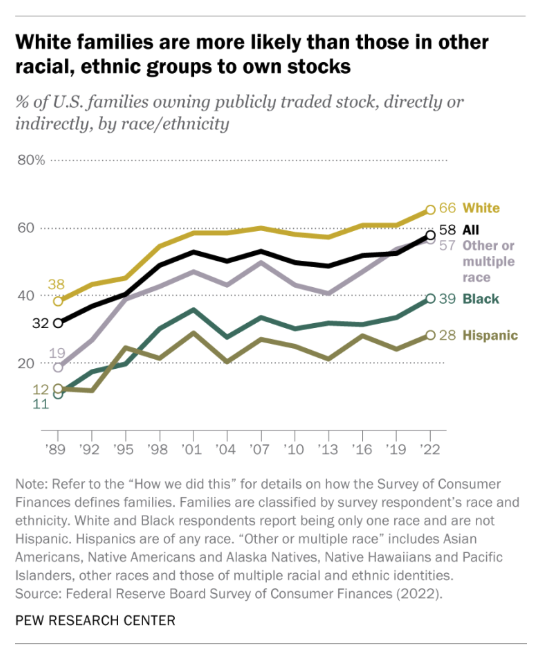
A booming U.S. stock market doesn’t benefit all racial and ethnic groups equally
The Pew Research Centre looks at the ethnic distribution of US household stock exchange investments.
🤖 AI
How AI will Disrupt BI As We Know It
"Business intelligence is on a collision course with AI. ... For a long time, BI included a bunch of stuff that it no longer does. Like: data processing. Pre-cloud, BI tools processed data locally and often had proprietary processing engines. They competed on being fast."
An interesting look at how Business Intelligence, as a fuzzy term that includes modeling, exploratory data analysis, and presentation, is at risk of disappearing or heavily transforming. However, it has evolved multiple times in the past.
|
DID YOU LIKE THIS ISSUE>? → BUY ME A COFFEE! 
You're receiving this email because you subscribed to Quantum of Sollazzo, a weekly newsletter covering all things data, written by Giuseppe Sollazzo (@puntofisso). If you have a product or service to promote and want to support this newsletter, you can sponsor an issue. |
quantum of sollazzo is also supported by Andy Redwood’s proofreading – if you need high-quality copy editing or proofreading, check out Proof Red. Oh, and he also makes motion graphics animations about climate change.
