603: quantum of sollazzo
#603: quantum of sollazzo – 1 April 2025
The data newsletter by @puntofisso.

Hello, regular readers and welcome new ones :) This is Quantum of Sollazzo, the newsletter about all things data. I am Giuseppe Sollazzo, or @puntofisso. I've been sending this newsletter since 2012 to be a summary of all the articles with or about data that captured my attention over the previous week. The newsletter is and will always (well, for as long as I can keep going!) be free, but you're welcome to become a friend via the links below.
The most clicked link last week was Lucy McGowan's oddly visual analysis of the Severance TV show
It's AMA o'clock! This is the Quantum of Sollazzo Ask Me Anything section.
AMA – Ask Me Anything by submitting a question via this anonymous Google form. If there are many questions, I'll select a few every 4-5 weeks and answer them on here :-) Don't be shy!

The Quantum of Sollazzo grove now has 25 trees. It helps managing this newsletter's carbon footprint. Check it out at Trees for Life.
'till next week,
Giuseppe @puntofisso.bsky.social
✨ Topical
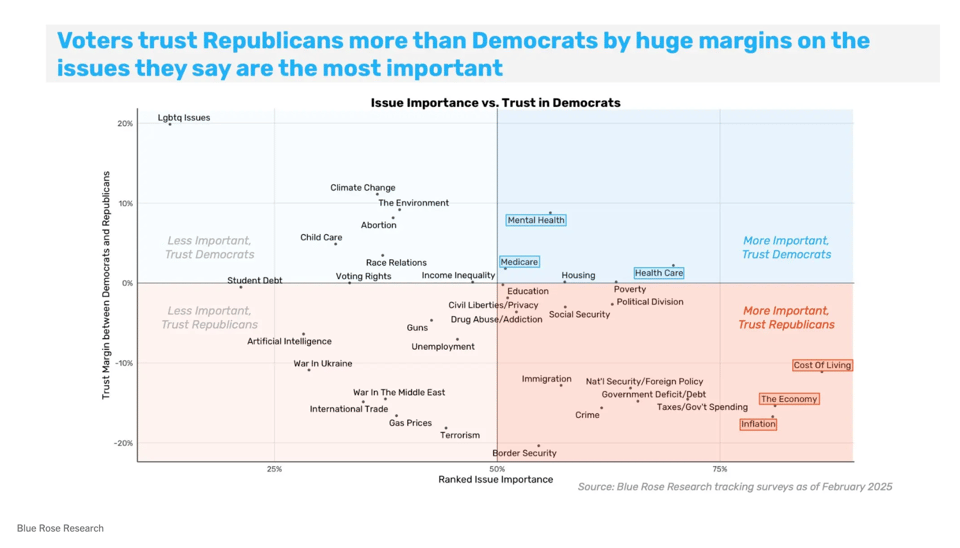
Democrats Need to Face Why Trump Won
This is the transcript of a political talk/podcast, which however caught my attention because of interesting data analysis and rather numerous charts that come from the slides they used.
The booming, high-stakes arms race of airline safety videos
"...since 2011, more and more videos increasingly take place outside the airplane".

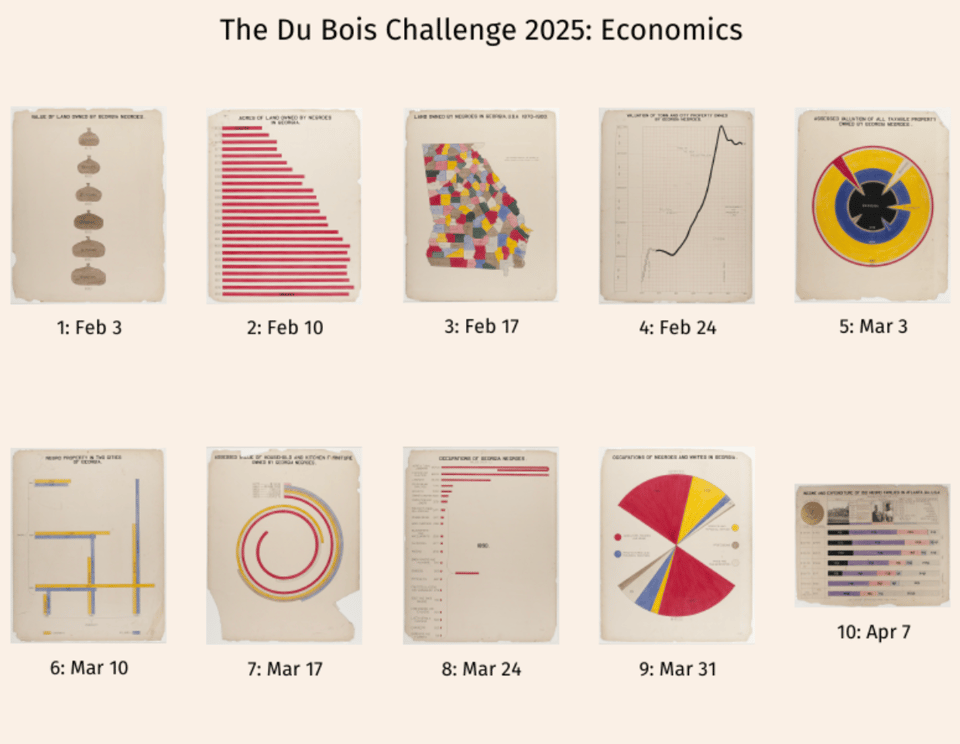
Du Bois Visualization Challenge: 2025
"The goal of the challenge is to celebrate the data visualization legacy of W.E.B Du Bois by recreating the visualizations from the 1900 Paris Exposition using modern tools."
Keep an eye on the results.
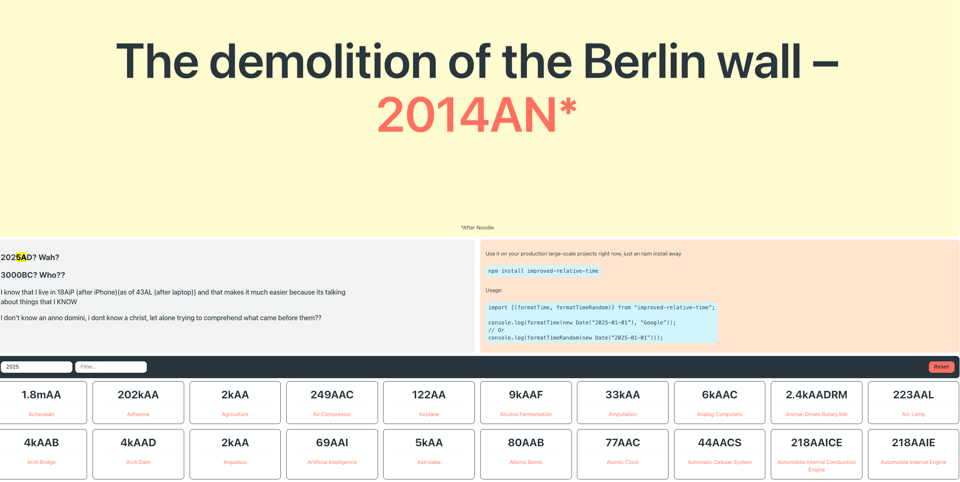
Relative time
Let me give you an example. 2025 AD is 4ACOVIDP, i.e. year 4 since the introduction of a COVID antiviral pill. This website, also usable as a Javascript library in your code, is an entirely bonkers idea, and I love it for that.
Brain food, delivered daily
Every day we analyze thousands of articles and send you only the best, tailored to your interests. Loved by 505,869 curious minds. Subscribe.

🛠️📖 Tools & Tutorials
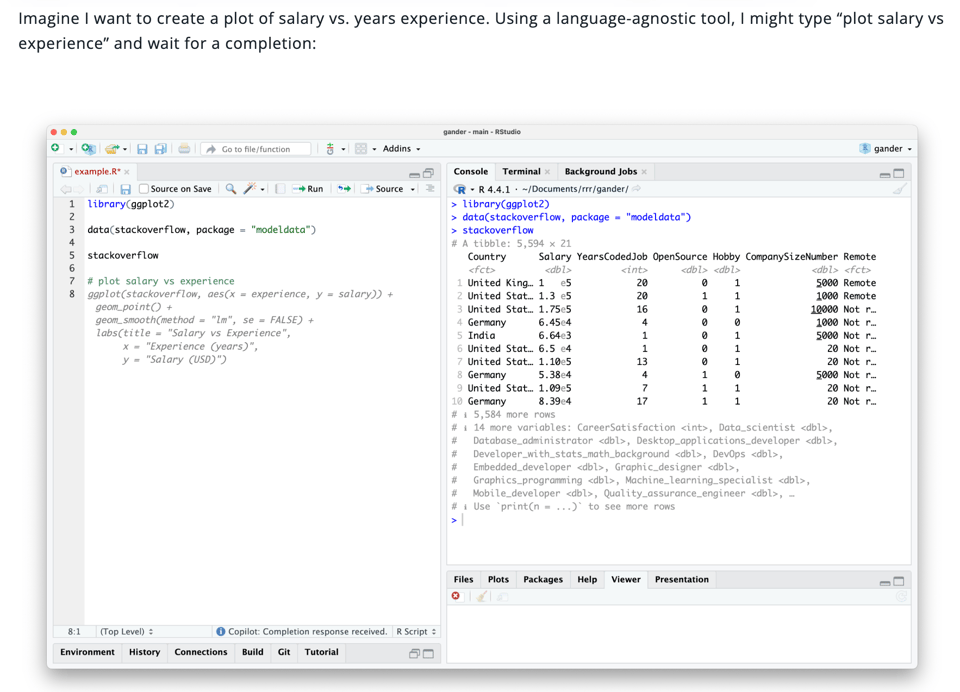
gander
"gander is a higher-performance and lower-friction chat experience for data scientists in RStudio and Positron–sort of like completions with Copilot, but it knows how to talk to the objects in your R environment. The package brings ellmer chats into your project sessions, automatically incorporating relevant context and streaming their responses directly into your documents."
You can also read an intro here.
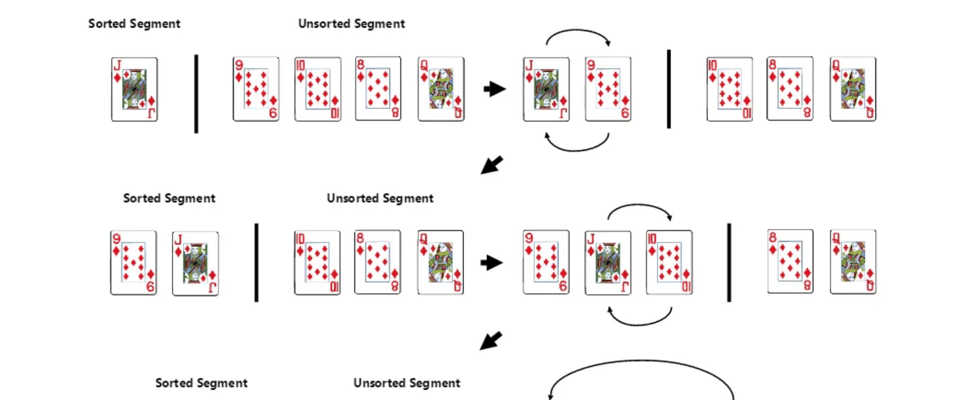
Visual-Focused Algorithms Cheat Sheet
"A visual-focused review of some key practical algorithms used in the real world."
fasttransform: Reversible Pipelines Made Simple
Fast.ai has been "Introducing fasttransform, a Python library that makes data transformations reversible and extensible through the power of multiple dispatch."
25 ridiculously impressive HTML5 canvas experiments
"Looking to take your HTML5 animations to the next level? Get inspired by these 25 extremely cool examples of canvas in HTML5!"
Some of these are genuinely jaw-dropping.

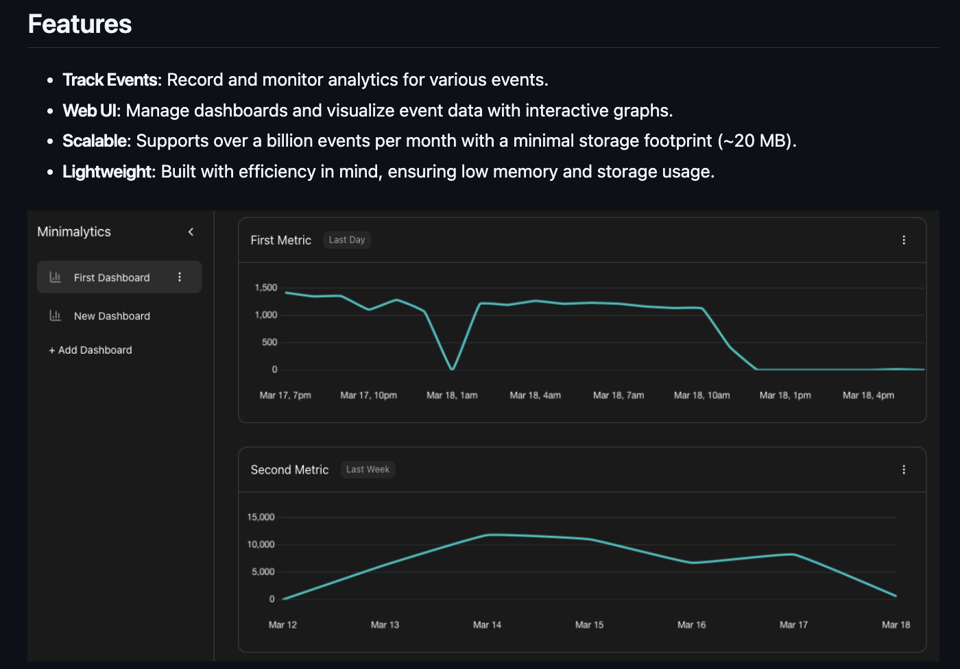
Minimalytics
"Minimalytics is a standalone minimalist analytics tool built on SQLite. Designed for resource-constrained environments, it provides a lightweight solution for tracking and visualizing event data with a minimal footprint. Whether you're tracking internal services or need a simple analytics tool, Minimalytics delivers performance without the bloat."
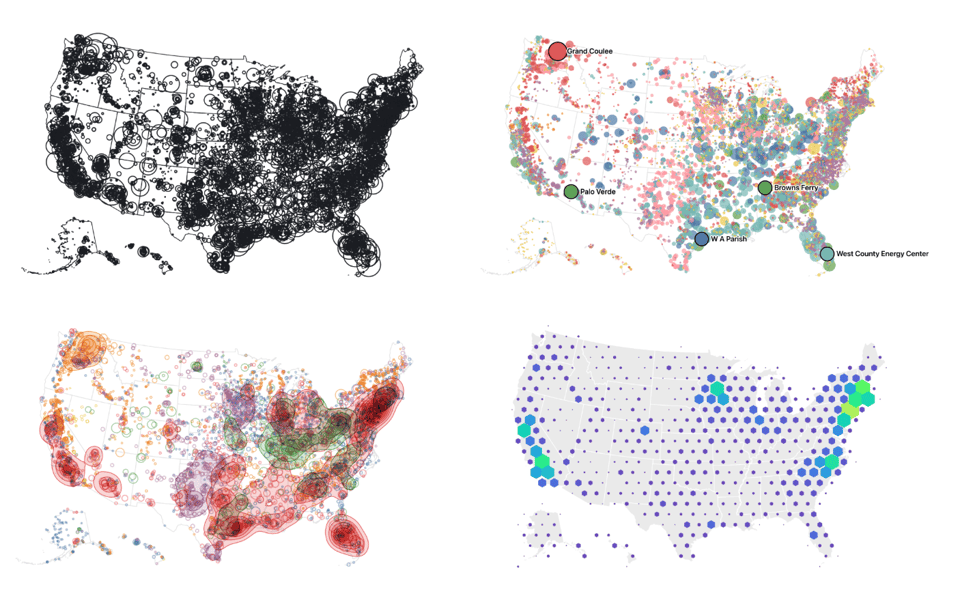
Build your first map with Observable Plot
"This tutorial walks through the process of building a bubble map (and beyond!) of United States power plant capacities in Observable Plot. Here’s a preview of what we’ll make:"
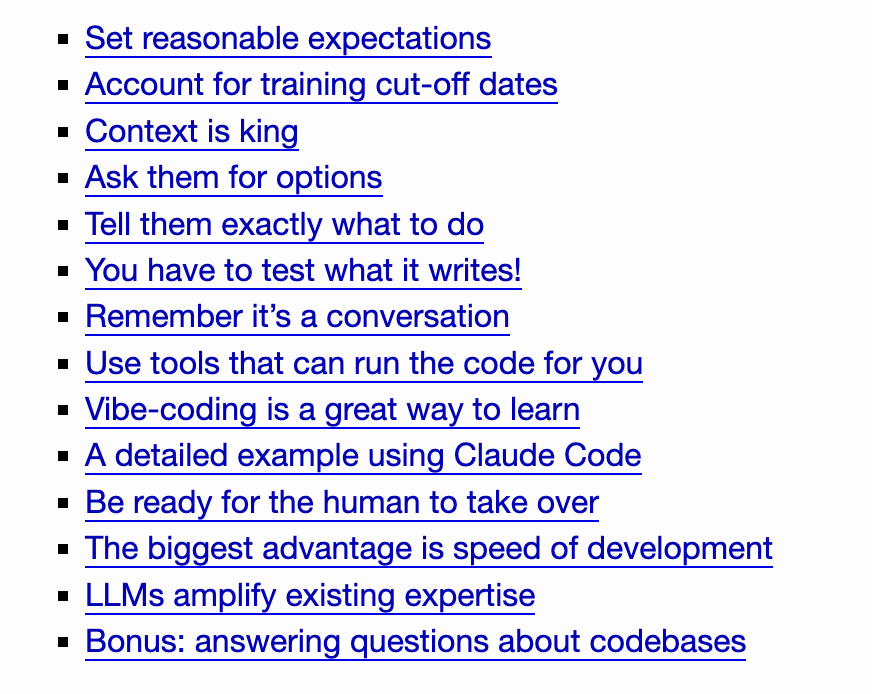
Here’s how I use LLMs to help me write code
The ever helpful Simon Willison: "I’ve been getting great results out of LLMs for code for over two years now. Here’s my attempt at transferring some of that experience and intuition to you."
🤯 Data thinking
Why the modern data stack matters in the AI age
"In 2021 through early 2023, the data space and specifically “The Modern Data Stack” was arguably the highest energy, most dynamic area of the tech sector, and certainly dominated the discourse.
In late 2022, the ChatGPT moment happened and all of the oxygen, immediately, became sucked up into AI.
The mystery on my mind has been - what is the connection here? Is it just an accident of history that right before we got AI systems that actually work at scale, we were focusing on centralizing and modeling our data?"
'Data' sucks
"Let's say the "badness" of a variable name is: "how badly named something is" multiplied by "how often you see the bad name". I think the worst variable name in all of programming is the word "data"."
A love letter to the CSV format
"Or why people pretending CSV is dead are wrong"
📈Dataviz, Data Analysis, & Interactive
US military chart from the 1940s
Ed Conway: "We like to think this is the golden age of data visualisation. But check out this chart from the US military during WWII👇"
(via Peter Wood)

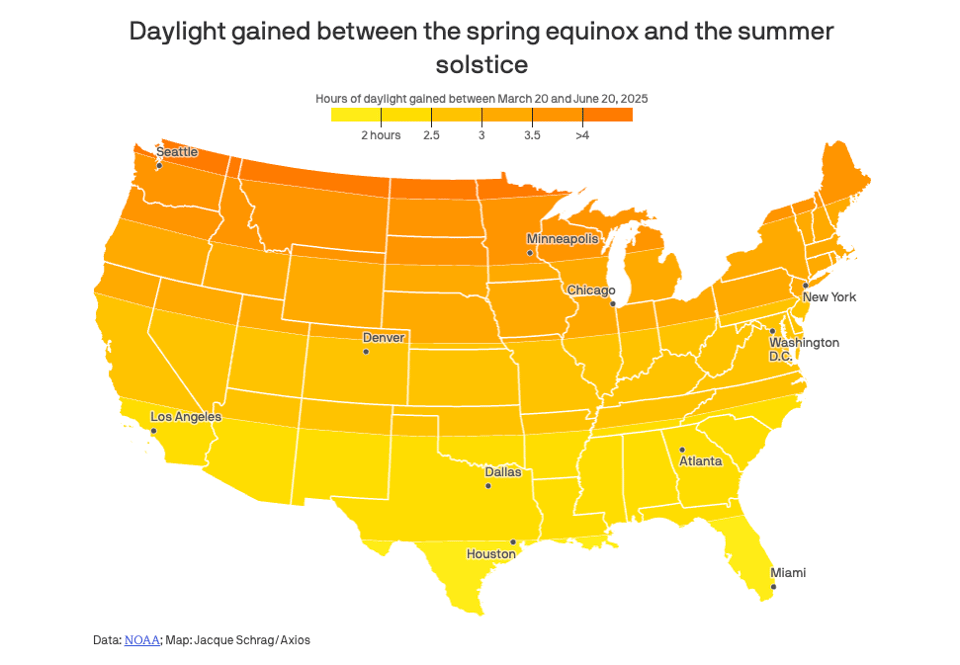
How much daylight you're gaining as spring begins
Axios: "Parts of the U.S. will gain three hours or more of daylight between Thursday's spring equinox and the summer solstice on June 20, per NOAA's solar calculator."
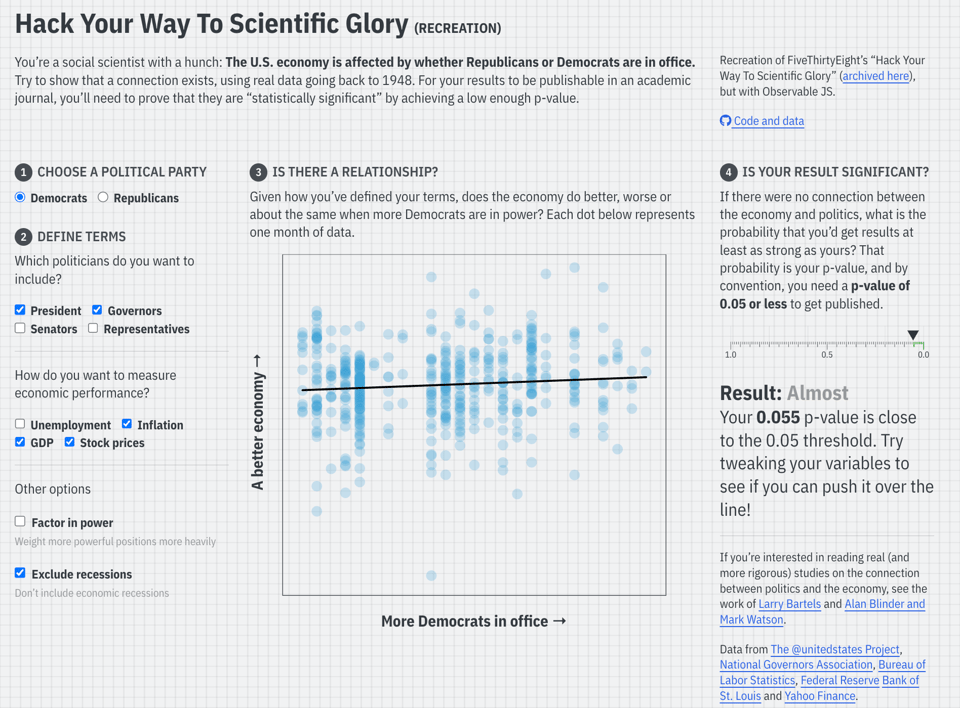
Hack Your Way To Scientific Glory (recreation)
"You’re a social scientist with a hunch: The U.S. economy is affected by whether Republicans or Democrats are in office. Try to show that a connection exists, using real data going back to 1948. For your results to be publishable in an academic journal, you’ll need to prove that they are “statistically significant” by achieving a low enough p-value."
When You Will Die
FlowingData: "With absolute certainty, you will die. When will it happen? That is a trickier question. But we can use what we do know and run simulations to get a more accurate and more meaningful answer than average life expectancy."

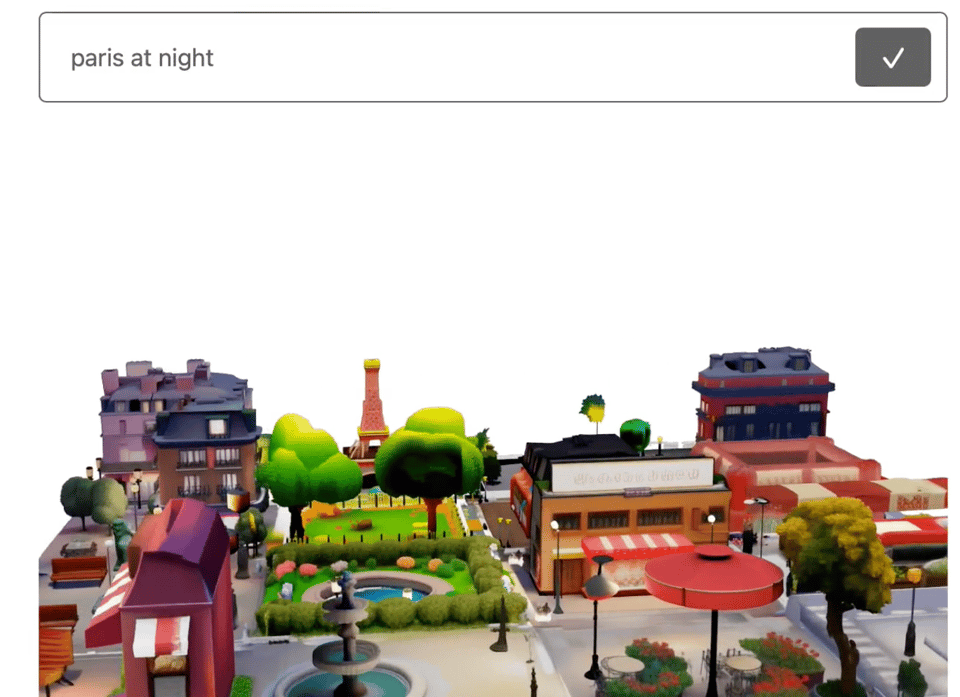
SynCity: Training-Free Generation of 3D Worlds
"SynCity generates complex and immersive 3D worlds from text prompts and does not require any training or optimization."
🤖 AI
Deep Learning is Not So Mysterious or Different
NYU Professor Andrew Gordon Wilson: "Deep neural networks are often seen as different from other model classes by defying conventional notions of generalization. Popular examples of anomalous generalization behaviour include benign overfitting, double descent, and the success of overparametrization. We argue that these phenomena are not distinct to neural networks, or particularly mysterious. Moreover, this generalization behaviour can be intuitively understood, and rigorously characterized using long-standing generalization frameworks such as PAC-Bayes and countable hypothesis bounds. We present soft inductive biases as a key unifying principle in explaining these phenomena: rather than restricting the hypothesis space to avoid overfitting, embrace a flexible hypothesis space, with a soft preference for simpler solutions that are consistent with the data. This principle can be encoded in many model classes, and thus deep learning is not as mysterious or different from other model classes as it might seem. However, we also highlight how deep learning is relatively distinct in other ways, such as its ability for representation learning, phenomena such as mode connectivity, and its relative universality."
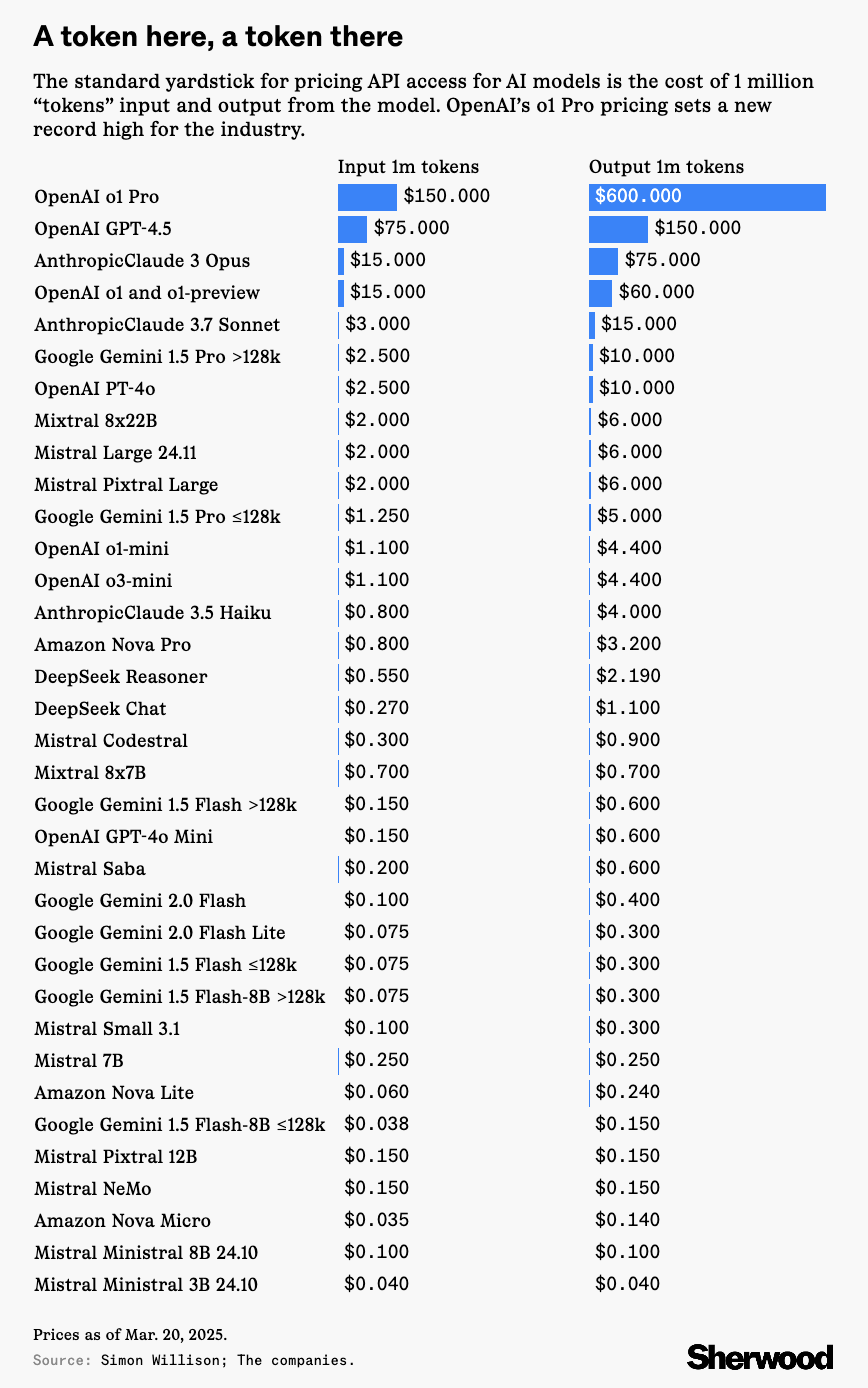
OpenAI’s o1-pro is the most expensive AI model in the industry
Jon Keegan: "No other model by a major AI company comes even close."
|
DID YOU LIKE THIS ISSUE>? → BUY ME A COFFEE! 
You're receiving this email because you subscribed to Quantum of Sollazzo, a weekly newsletter covering all things data, written by Giuseppe Sollazzo (@puntofisso). If you have a product or service to promote and want to support this newsletter, you can sponsor an issue. |
quantum of sollazzo is also supported by Andy Redwood’s proofreading – if you need high-quality copy editing or proofreading, check out Proof Red. Oh, and he also makes motion graphics animations about climate change.
