599: quantum of sollazzo
#599: quantum of sollazzo – 4 March 2025
The data newsletter by @puntofisso.

Hello, regular readers and welcome new ones :) This is Quantum of Sollazzo, the newsletter about all things data. I am Giuseppe Sollazzo, or @puntofisso. I've been sending this newsletter since 2012 to be a summary of all the articles with or about data that captured my attention over the previous week. The newsletter is and will always (well, for as long as I can keep going!) be free, but you're welcome to become a friend via the links below.
The most clicked link last week was this quirky collection of GIF banners from the Internet that was. You truly are a bunch of nerds and I love you.
It's AMA o'clock! This is the Quantum of Sollazzo Ask Me Anything section.
AMA – Ask Me Anything by submitting a question via this anonymous Google form. If there are many questions, I'll select a few every 4-5 weeks and answer them on here :-) Don't be shy!

The Quantum of Sollazzo grove now has 25 trees. It helps managing this newsletter's carbon footprint. Check it out at Trees for Life.
'till next week,
Giuseppe @puntofisso.bsky.social
✨ Topical
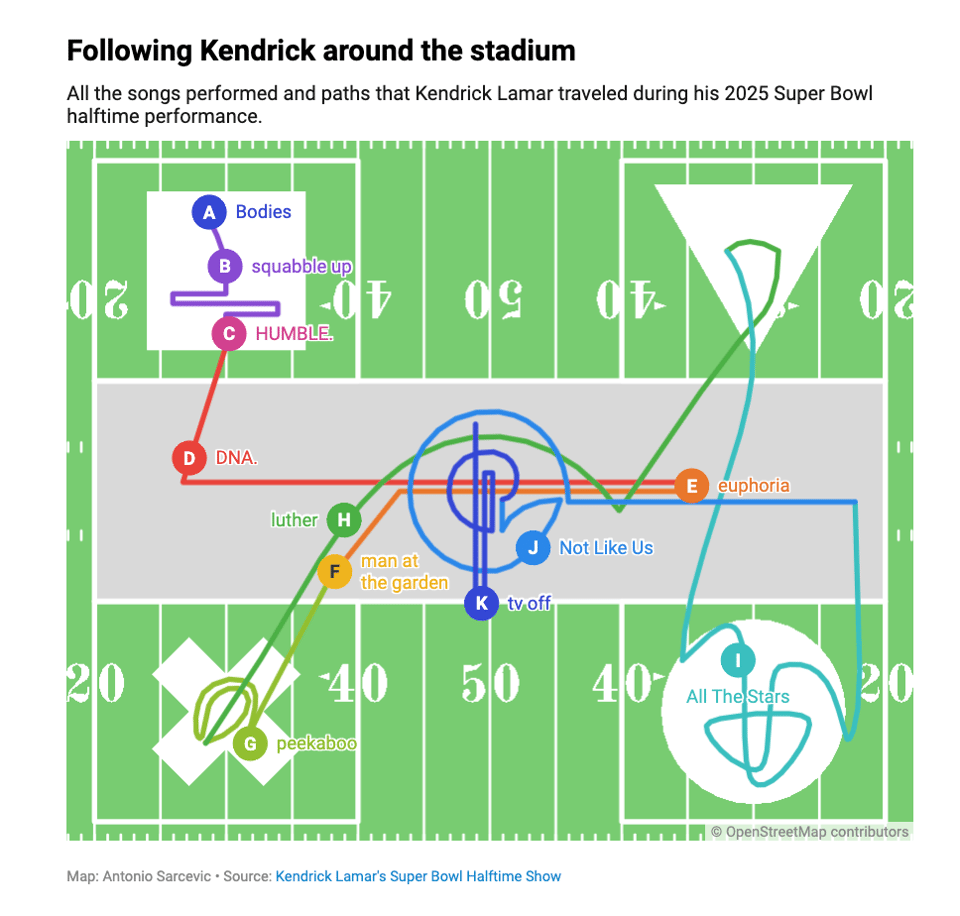
Mapping a Super Bowl halftime show
Datawrapper's Antonio Sarcevic: "I wanted to challenge myself to visualize the performance with Datawrapper by somehow drawing the field, stage setup, and most importantly the path that Kendrick traveled during his performance."
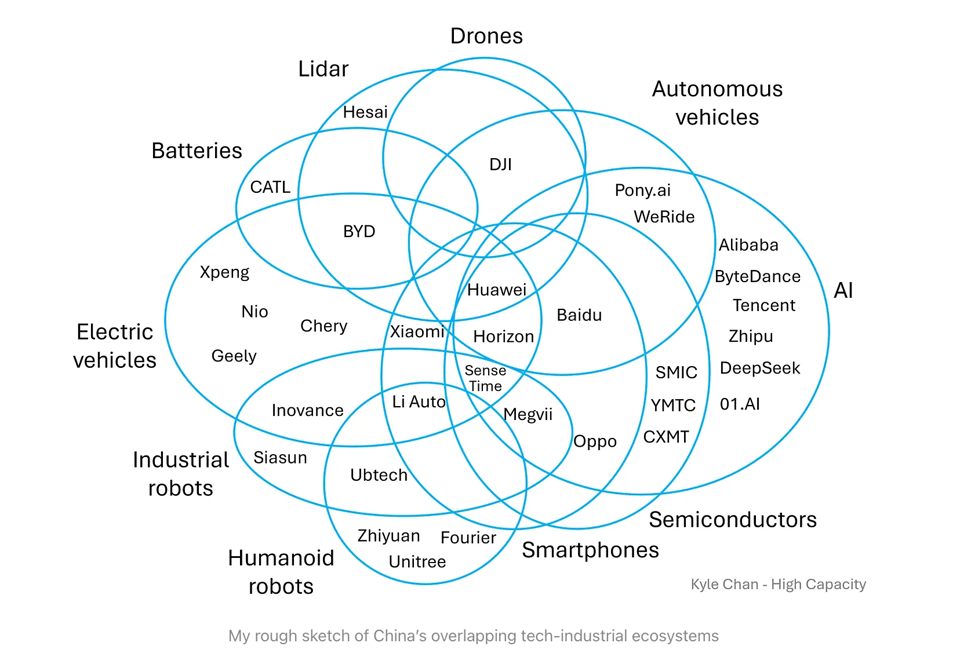
China's overlapping tech-industrial ecosystems
"EVs, batteries, lidar, drones, robotics, smartphones, AI. China's progress across a range of overlapping industries creates a mutually reinforcing feedback loop."
Mostly linked for the incredible, and migraine-inducing Venn diagram below.
(via Peter Wood)
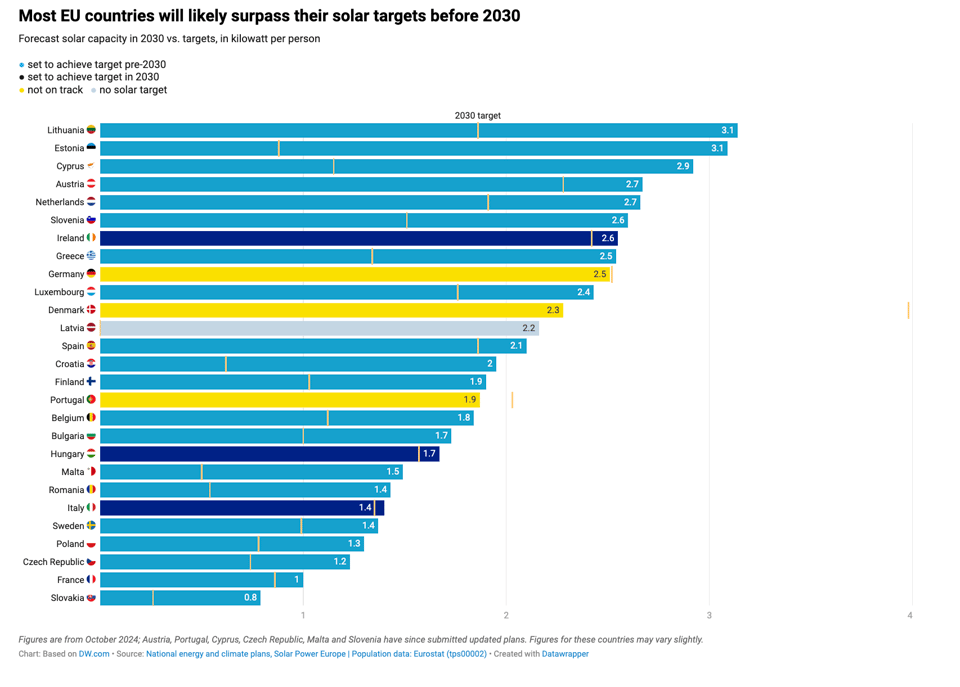
How Europe is funding its solar boom
Kira Schacht – Deutsche Welle but via the European Data Journalism Network: "The EU has doubled its solar capacity in the last 3 years. DW and the European Data Journalism Network have analyzed how subsidies made this possible, what supports are still available, and what still needs to happen."
Winners of the Closeread Prize – Data-Driven Scrollytelling with Quarto
Posit: "The only requirement was that the story use Closeread, an extension for Quarto that allows you to author web stories that unfold as the user scrolls through. It’s a powerful scrollytelling technique that takes care and craft to use effectively."
A nice set of inspiring data scrollytelling stories.
Brain food, delivered daily
Every day we analyze thousands of articles and send you only the best, tailored to your interests. Loved by 505,869 curious minds. Subscribe.

🛠️📖 Tools & Tutorials
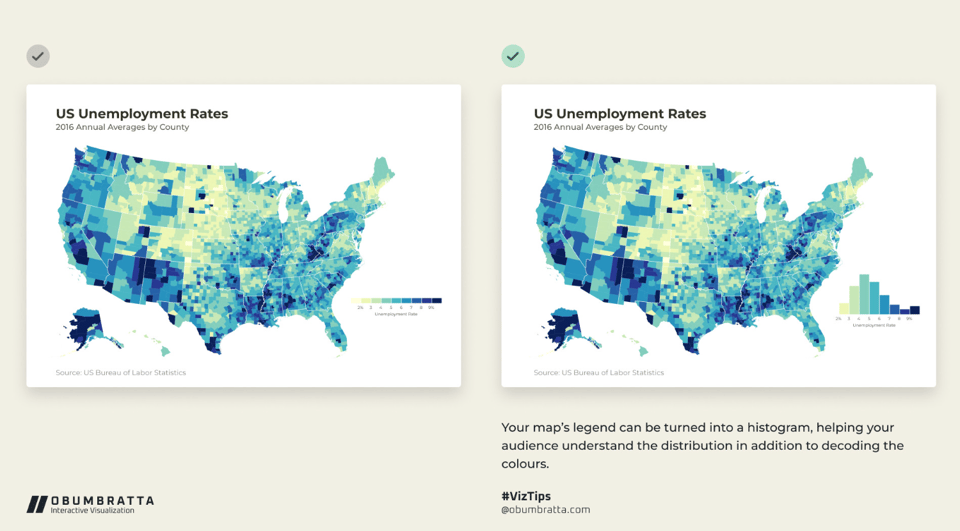
How to use a histogram as a legend in {ggplot2}
GIS R guru Andrew Heiss "Land isn’t unemployed—people are. Here’s how to use R, {ggplot2}, {sf}, and {patchwork} to create a histogram legend in a choropleth map to better see the distribution of values."
mdq
Mdq is "like jq but for Markdown: find specific elements in a md doc".
(Note: this newsletter is edited in Markdown).
Introduction to CUDA Programming for Python Developers
A good, comprehensive GPU programming tutorial.
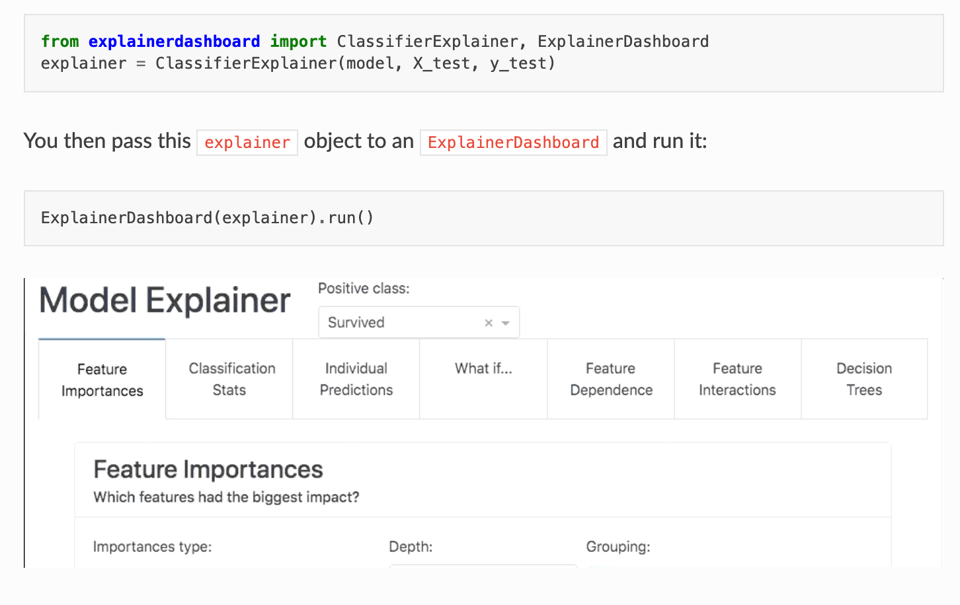
explainerdashboard
"This package makes it convenient to quickly deploy a dashboard web app that explains the workings of a (scikit-learn compatible) machine learning model. The dashboard provides interactive plots on model performance, feature importances, feature contributions to individual predictions, "what if" analysis, partial dependence plots, SHAP (interaction) values, visualization of individual decision trees, etc."
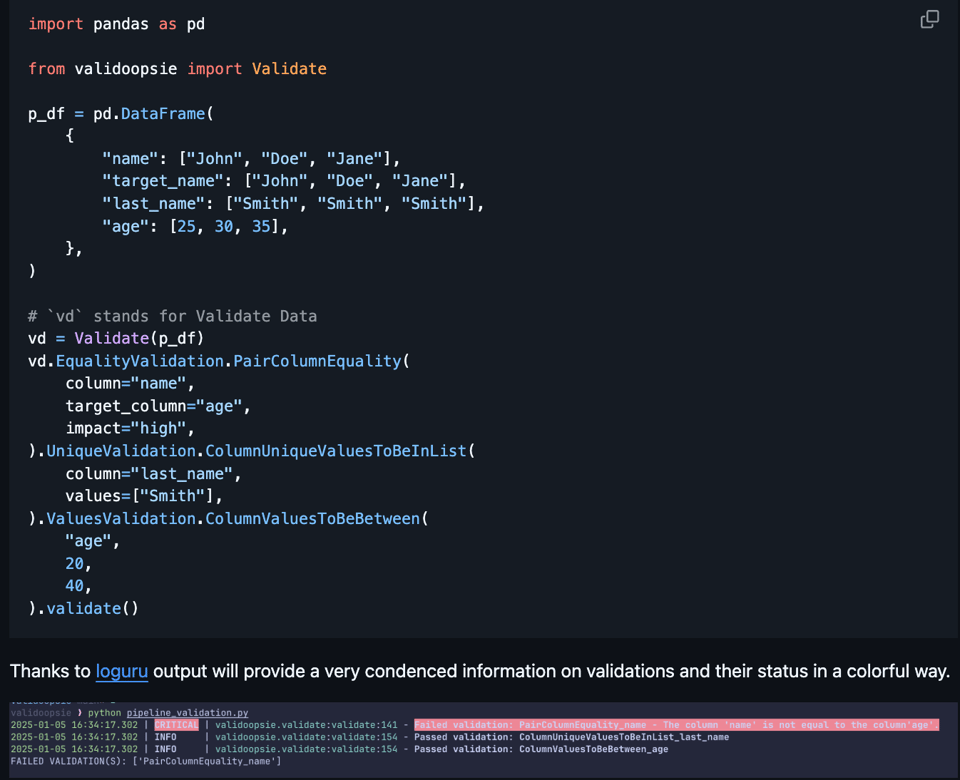
Validoopsie
"A simple and easy to use Data Validation library for Python."
🤯 Data thinking
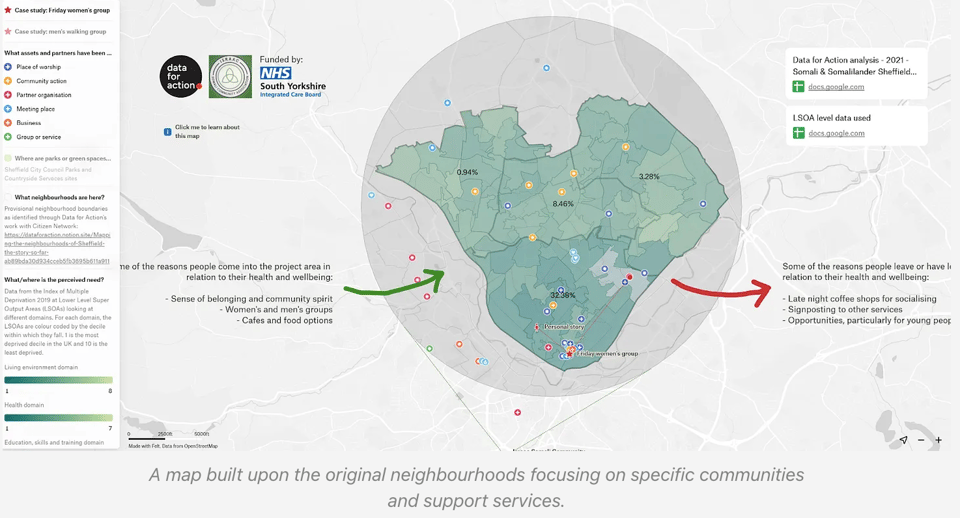
Maps as conversations
Tom Watson and Tom French report on using maps as a way to foster community-driven discussions: "Exploring our citizen-led neighbourhood mapping at Data For Action"
📈Dataviz, Data Analysis, & Interactive
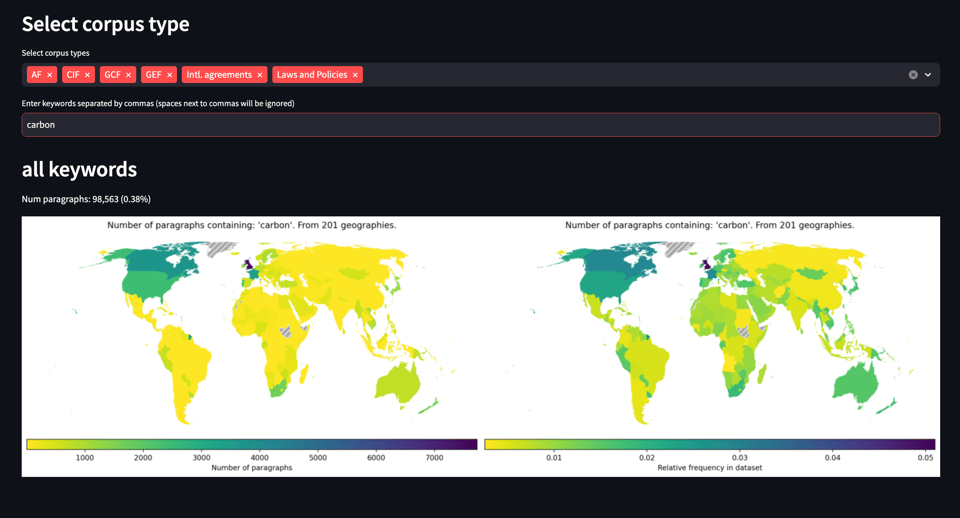
Mapping climate policy: navigating context-specific language (Part I)
Climate Policy Radar's Kalyan Dutia and Anne Jelmar Sietsma built a tool to let users create maps looking at use of different climate terminology across the world in climate policy.
"Finding all climate policies relevant to a particular topic is not a simple task. This is doubly difficult where language and terminology carry political sensitivity. The Climate Policy Radar app already contains these, so selecting text based on keywords is an obvious first step. However, where language is often very context-dependent, we often need to combine multiple keywords in order to gain a representative overview. Even the phrase "most vulnerable" is controversial in and of itself. Some people, including many academics, find it a useful shorthand for a host of different risk factors; others consider it disempowering (even offensive) because of its allusion to "weakness". We need to be very deliberate in choosing our keywords, so we help our users find what they need, without accidentally entrenching historic discrimination or alienating users."
All code and full text data is available.
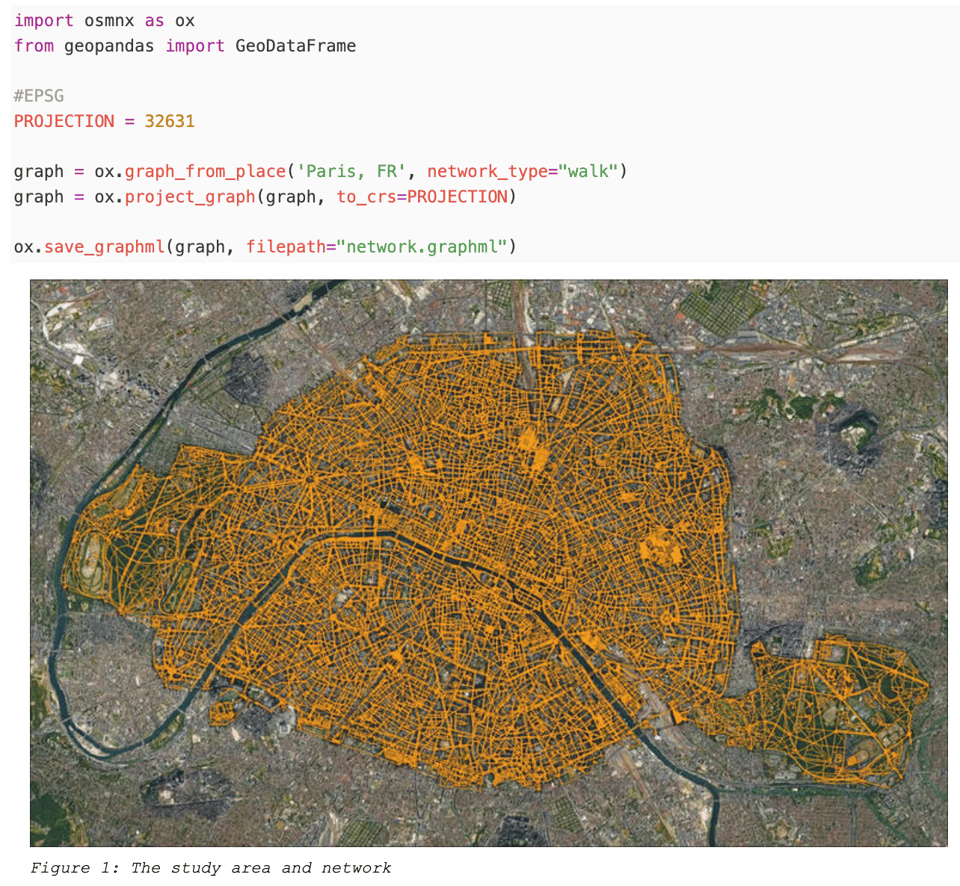
"The closer to the train station, the worse the kebab" - A "Study"
James Pae: "The inner city is dense with dozens of train/metro stations and god knows how many kebab shops."
Notable points: he uses one of my favourite tools OSMnx, to analyse the transport network. While light-hearted, the article has some good ideas of what methodology could be used for similar problems.
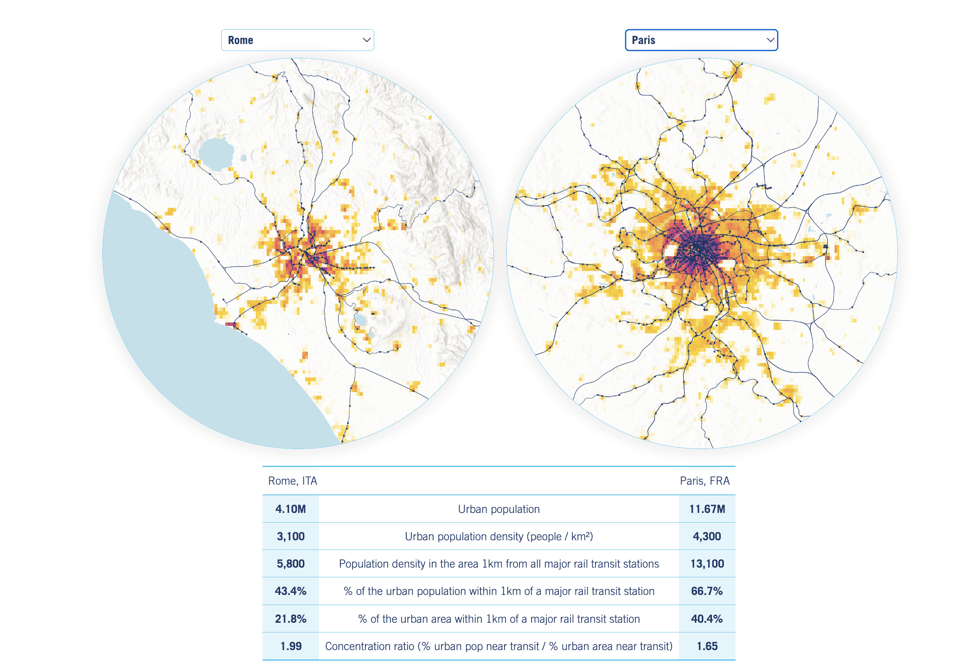
Rail Transit & Population Density
Speaking of train stations, I loved this project "comparing and ranking 250 cities around the world)". All code is available.
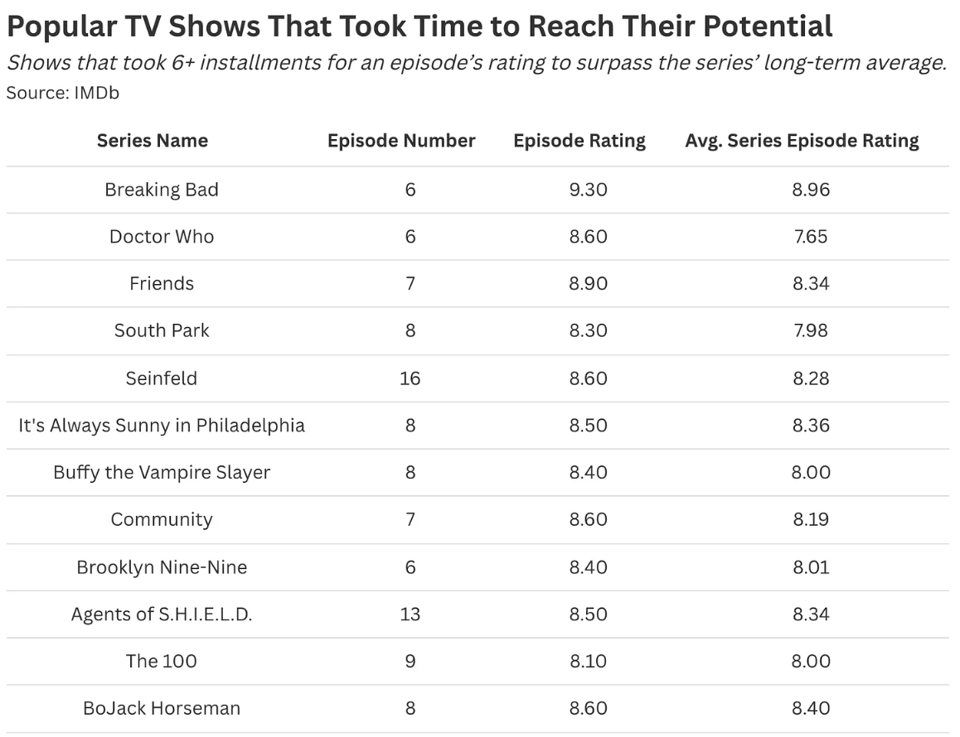
How Many Episodes Should You Watch Before Quitting a TV Show? A Statistical Analysis
"When to quit a subpar TV show, according to the data."
As any long-term Star Trek fan will say, you need to get past season 2 of any show before it gets good.
How much light was that?
"There are ways to measure how much visible light something is giving off. It's not simple."
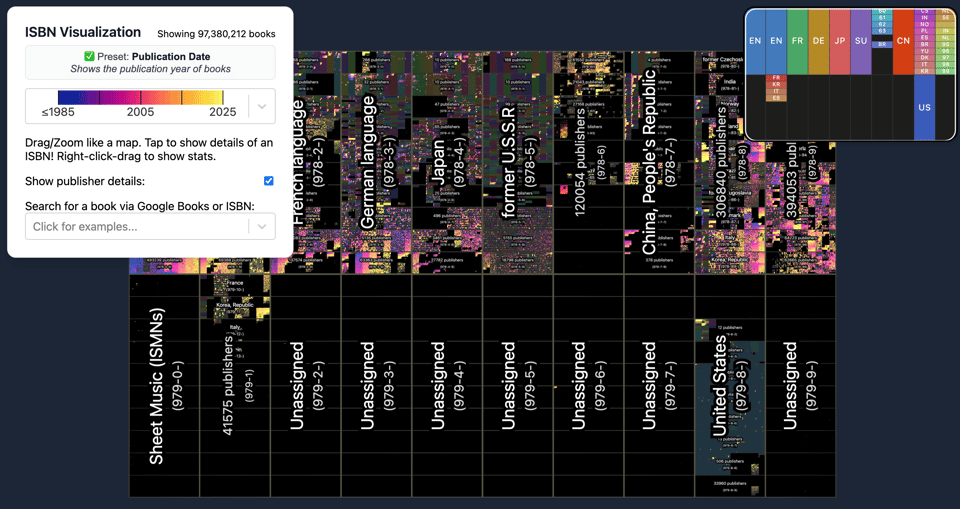
Visualizing all books of the world in ISBN-Space
"How could we effectively visualize 100,000,000 books or more at once?"
🤖 AI
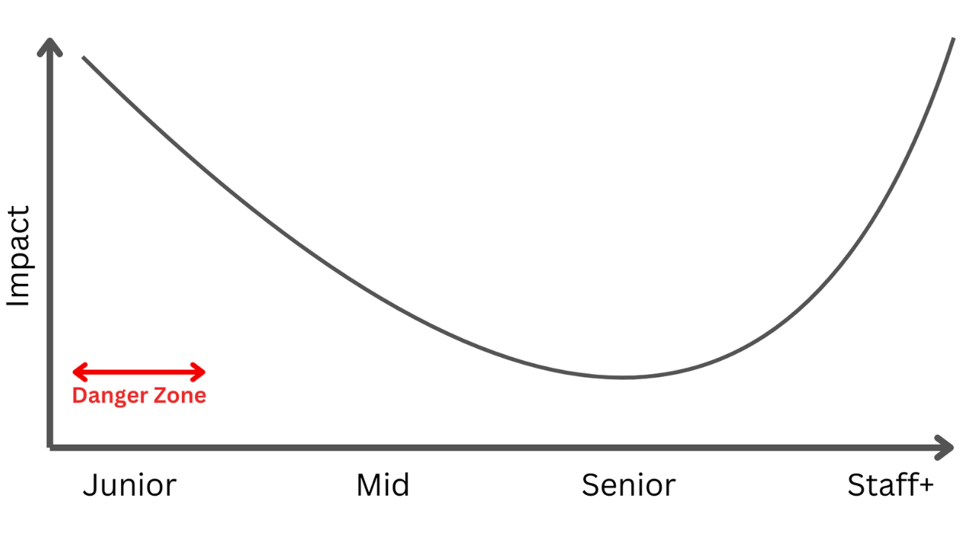
Dear Student: Yes, AI is here, you're screwed unless you take action...
"The steps that you take now will determine your success rate with obtaining a SWE role going forward. If you are a high autonomy person then you're not fucked, as long as you take action."
"...companies don't even know how to hire anymore..."
The Deep Research problem
Benedict Evans: "OpenAI’s Deep Research is built for me, and I can’t use it. It’s another amazing demo, until it breaks. But it breaks in really interesting ways."
When AI breaks, it breaks spectacularly.
|
DID YOU LIKE THIS ISSUE>? → BUY ME A COFFEE! 
You're receiving this email because you subscribed to Quantum of Sollazzo, a weekly newsletter covering all things data, written by Giuseppe Sollazzo (@puntofisso). If you have a product or service to promote and want to support this newsletter, you can sponsor an issue. |
quantum of sollazzo is also supported by Andy Redwood’s proofreading – if you need high-quality copy editing or proofreading, check out Proof Red. Oh, and he also makes motion graphics animations about climate change.
