597: quantum of sollazzo
#597: quantum of sollazzo – 18 February 2025
The data newsletter by @puntofisso.

Hello, regular readers and welcome new ones :) This is Quantum of Sollazzo, the newsletter about all things data. I am Giuseppe Sollazzo, or @puntofisso. I've been sending this newsletter since 2012 to be a summary of all the articles with or about data that captured my attention over the previous week. The newsletter is and will always (well, for as long as I can keep going!) be free, but you're welcome to become a friend via the links below.
The most clicked link last week was the EDJNet's article about growing rents in Europe.
It's AMA o'clock! This is the Quantum of Sollazzo Ask Me Anything section.
AMA – Ask Me Anything by submitting a question via this anonymous Google form. If there are many questions, I'll select a few every 4-5 weeks and answer them on here :-) Don't be shy!

The Quantum of Sollazzo grove now has 25 trees. It helps managing this newsletter's carbon footprint. Check it out at Trees for Life.
'till next week,
Giuseppe @puntofisso.bsky.social
✨ Topical
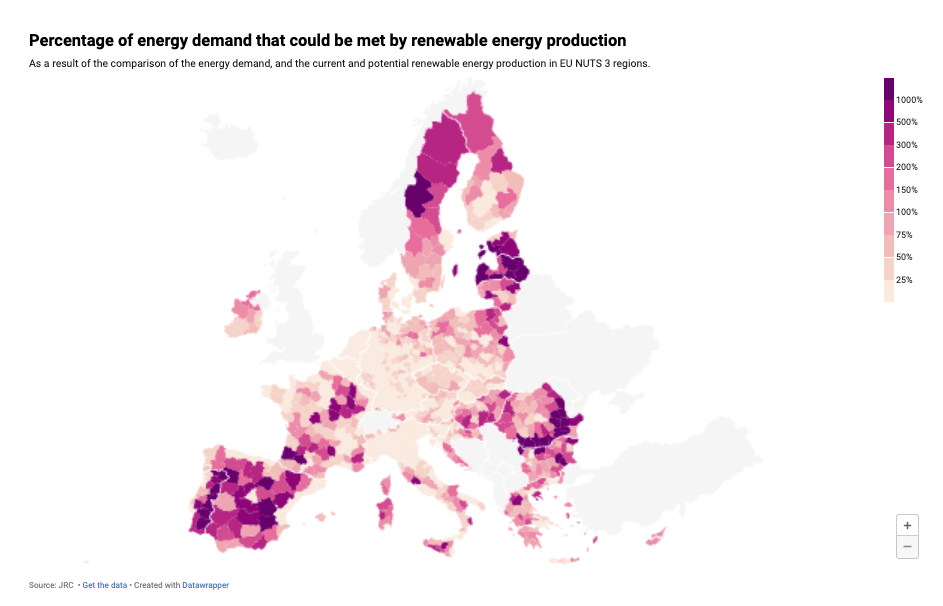
Solar energy in Europe’s countryside: huge potential, complex challenges
Marco Ranocchiari and Ornaldo Gjergji (see Quantum #469 for an interview with Ornaldo) for OBC Transeuropa/EDJnet: "Europe’s rural areas could produce up to 30 times their energy needs with photovoltaics, but technical, environmental and social obstacles complicate their development. Networks, storage and community involvement will be crucial for a sustainable future."
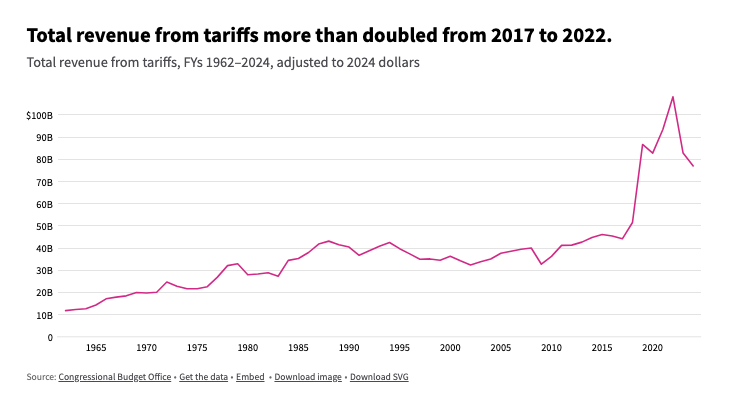
What are tariffs and how do they work?
"Tariffs are taxes paid by firms importing goods internationally. They are used as a tool to control global trade."
Brief USAFacts explainer on tariffs, with some quantification.
Brain food, delivered daily
Every day we analyze thousands of articles and send you only the best, tailored to your interests. Loved by 505,869 curious minds. Subscribe.

🛠️📖 Tools & Tutorials
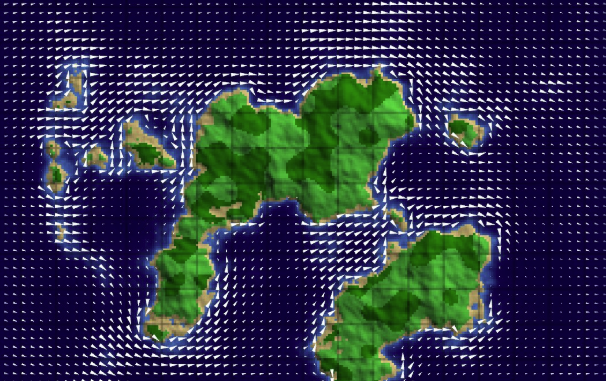
Simulating water over terrain
Simulating water "has problems", says the author. This blog post is about what you can do to simulate water the proper way.
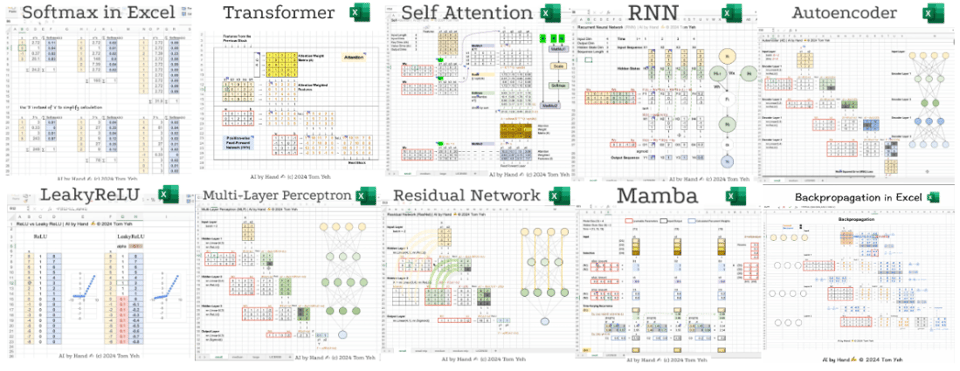
ai-by-hand-excel
A series of AI algorithms to try by hand in... Excel.
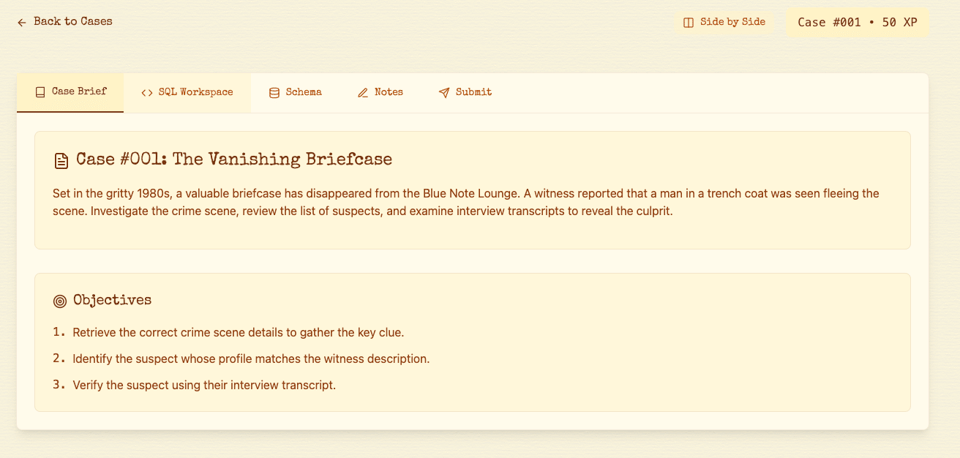
SQL Noir
"Solve mysteries through SQL."
Is Columbo-completeness a property of programming languages?
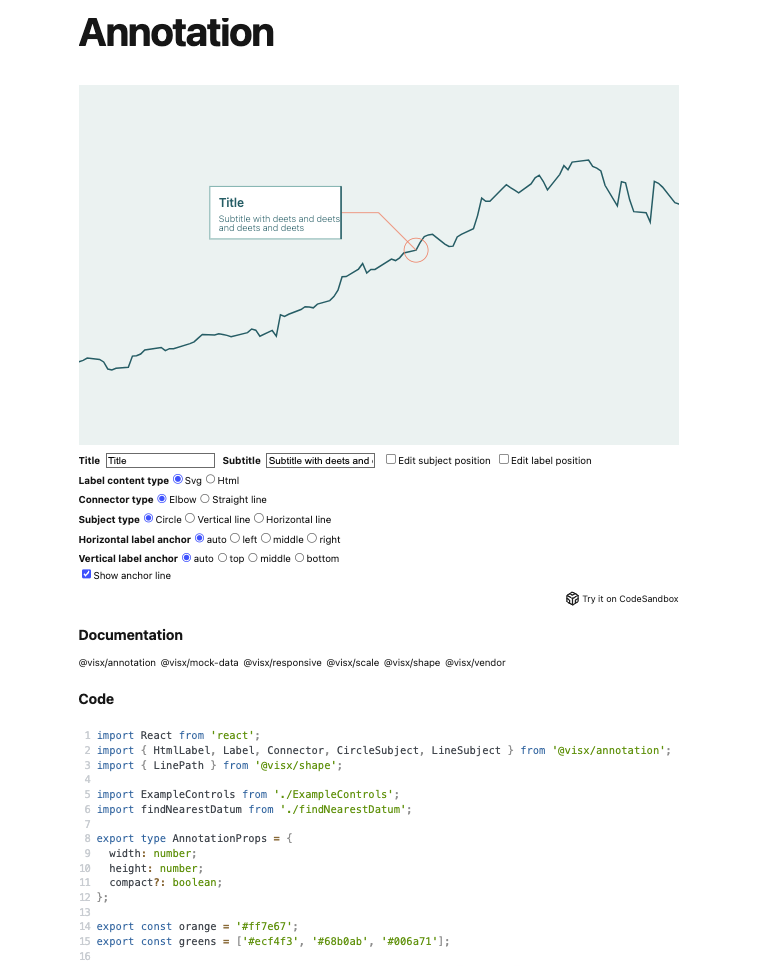
visx a collection of expressive, low-level visualization primitives for React
"At Airbnb, we made it a goal to unify our visualization stack across the company and in the process, we created a new project that brings together the power of D3 with the joy of React."
The docs are pretty well structured and self-explanatory.
(via Guy Lipman)
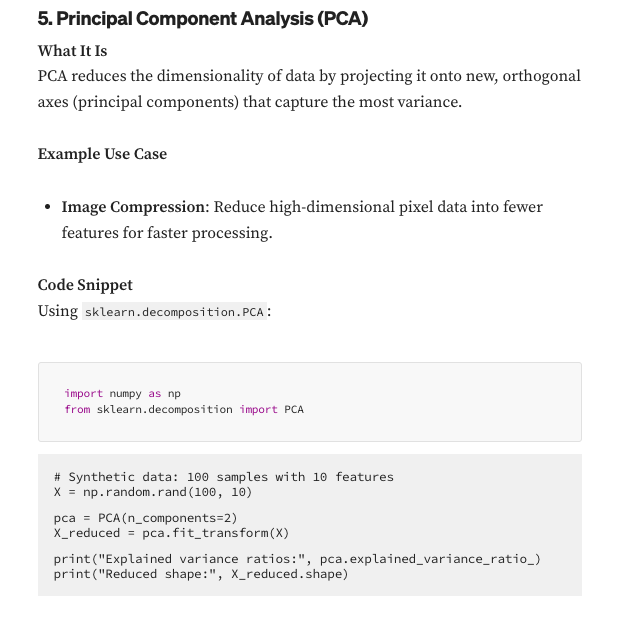
20 Advanced Statistical Approaches Every Data Scientist Should Know
"In this writing, we explore 20 advanced statistical approaches that every data scientist should be familiar with. Each approach includes a brief explanation, an example use case, and a snippet of Python code to illustrate its usage."
How to Train an AI Image Model on Yourself
"Yesterday I had a couple hours to kill and decided to try out a project I’ve been meaning to explore for a long time: training my own AI image model so I can generate pictures of myself that look like..."

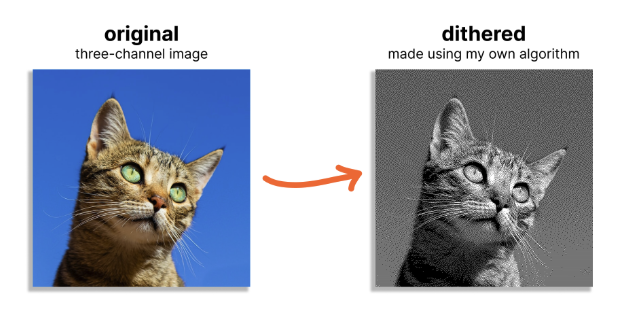
Writing My Own Dithering Algorithm in Racket
While dithering might not be immediately useful, how the author goes about implementing it is interesting.
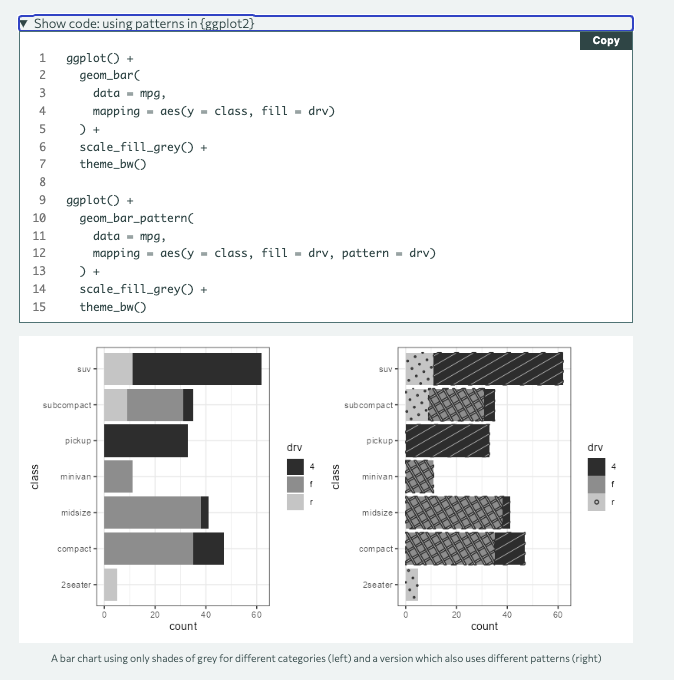
Designing monochrome data visualisations
"In data visualisations, colours are often used to show values or categories of data. However, sometimes you might not be able to or want to use colour. This blog post discusses some tips for designing better visualisations when you're restricted to a monochrome palette."
🤯 Data thinking
Defense Against Dishonest Charts
Flowing Data: "Charts are a window into the world. When done right, we gain an understanding of who we are, where we are, and how we can become better versions of ourselves. However, when done wrong, in the absence of truth, charts can be harmful.
This is a guide to protect ourselves and to preserve what is good about turning data into visual things."
📈Dataviz, Data Analysis, & Interactive
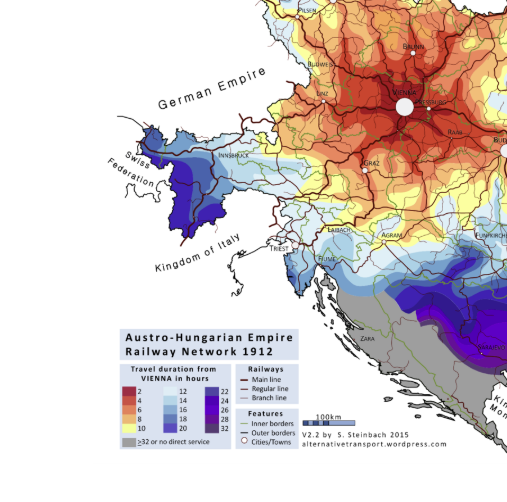
Travel Times From Vienna To The Rest Of The Austro-Hungarian Empire In 1912 (Isochrone Map)
What it says on the tin, by the Brilliant Maps blog. With an explainer.
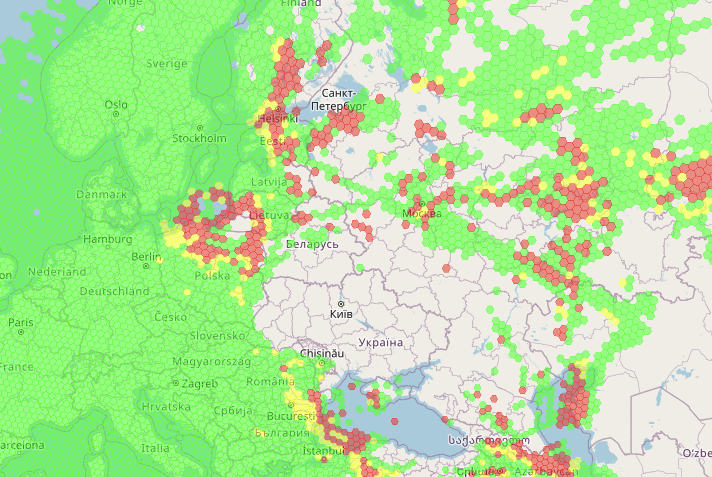
GPS Jam
"The map uses data provided by ADS-B Exchange to generate maps of likely GPS interference, based on aircraft reports of their navigation system accuracy."
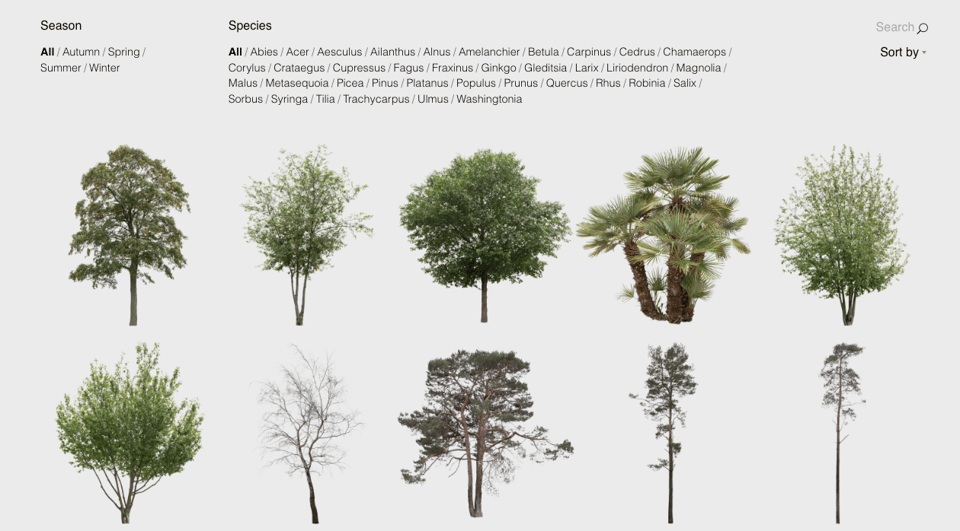
Meye
Not quite data, but interesting to read about the process of photographing a catalogue of trees. The photos are "free cut out PNG trees from all seasons by landscape architect Mikkel Eye".
(via Naive Weekly)
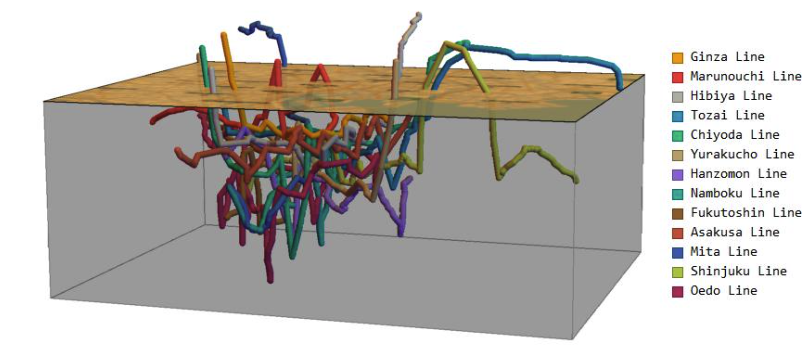
3D visualization of the Tokyo subway system
"There are 13 subways in Tokyo. I gathered the information of latitude, longitude and depth (from the ground) of all stations (287 stations) from web and book." Brilliant map, but most importantly brilliantly available data.
Do People Actually Hate Coldplay? A Statistical Analysis
Daniel Parris is "Examining Coldplay's confusing cultural reputation".
Does Betteridge's Law apply to the question in the headline...?

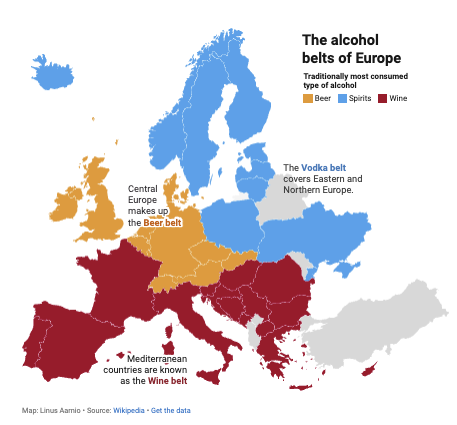
Brewing a new map of Europe
Datawrapper's Linus Aarnio: "Perhaps you’ve heard of the Beer belt, Vodka belt, and Wine belt in Europe? Today we’re taking a look at how relevant they are these days."
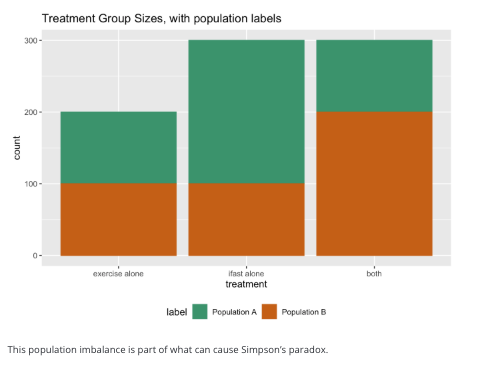
Simpson’s Paradox in a Logistic Regression
"In this post, I show an example of Simpson’s paradox in a logistic regression model of synthetic clinical trial data."
🤖 AI
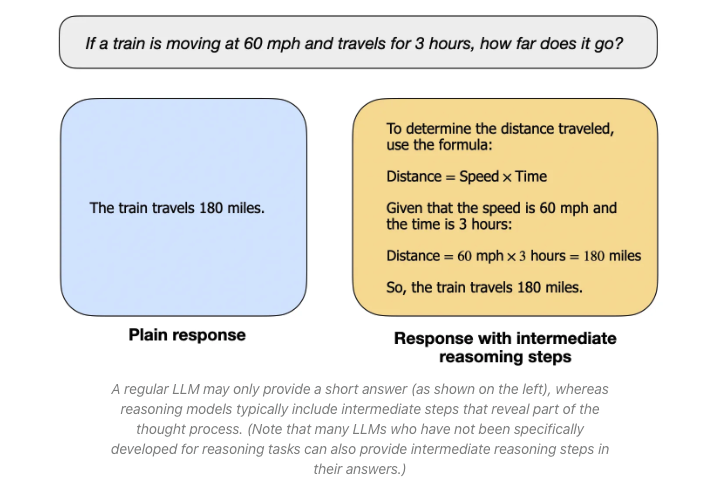
Understanding Reasoning LLMs
"Methods and Strategies for Building and Refining Reasoning Models".
I must admit I didn't know, until recently, about the difference between reasoning and non-reasoning models.
AI and the Missing Mother
Nicholas Carr in quite an extraordinary philosophical piece about the implication of think about AI as born vs made.
"There have been a lot of gothic fantasies about how artificial intelligence will end up supplanting us or turning us into pets or destroying the world while on a quest to fulfill a paperclip order. I’ve never found any of them convincing. But the idea that thinking machines will wipe us out in revenge for our cruelty in creating them makes sense to me. It feels human."
|
DID YOU LIKE THIS ISSUE>? → BUY ME A COFFEE! 
You're receiving this email because you subscribed to Quantum of Sollazzo, a weekly newsletter covering all things data, written by Giuseppe Sollazzo (@puntofisso). If you have a product or service to promote and want to support this newsletter, you can sponsor an issue. |
quantum of sollazzo is also supported by Andy Redwood’s proofreading – if you need high-quality copy editing or proofreading, check out Proof Red. Oh, and he also makes motion graphics animations about climate change.
