596: quantum of sollazzo
#596: quantum of sollazzo – 11 February 2025
The data newsletter by @puntofisso.

Hello, regular readers and welcome new ones :) This is Quantum of Sollazzo, the newsletter about all things data. I am Giuseppe Sollazzo, or @puntofisso. I've been sending this newsletter since 2012 to be a summary of all the articles with or about data that captured my attention over the previous week. The newsletter is and will always (well, for as long as I can keep going!) be free, but you're welcome to become a friend via the links below.
The most clicked link last week was, oddly, the website of my old Live Rugby mobile app. You lot have odd tastes sometimes.
Quantum has a new sponsor for the next few issues! Ed Freyfogle, organiser of geospatial meetup Geomob, co-host of the Geomob podcast, and co-founder of the OpenCage, has offered to introduce a set of points around the topic of geocoding. His first entry starts a few paragraphs below on geocoding at scale.
It's AMA o'clock! This is the Quantum of Sollazzo Ask Me Anything section.
AMA – Ask Me Anything by submitting a question via this anonymous Google form. If there are many questions, I'll select a few every 4-5 weeks and answer them on here :-) Don't be shy!

The Quantum of Sollazzo grove now has 25 trees. It helps managing this newsletter's carbon footprint. Check it out at Trees for Life.
'till next week,
Giuseppe @puntofisso.bsky.social
✨ Topical
End of Term Web Archive – Preserving the Transition of a Nation
The Internet Archive: "The 2024 End of Term crawl has officially begun! The End of Term Web Archive #EOTArchive hosts an initiative named the End of Term crawl to archive U.S. government websites in the .gov and .mil web domains — as well as those harder-to-find government websites hosted on .org, .edu, and other top level domains (TLDs) — as one administrative term ends and a new term begins. "
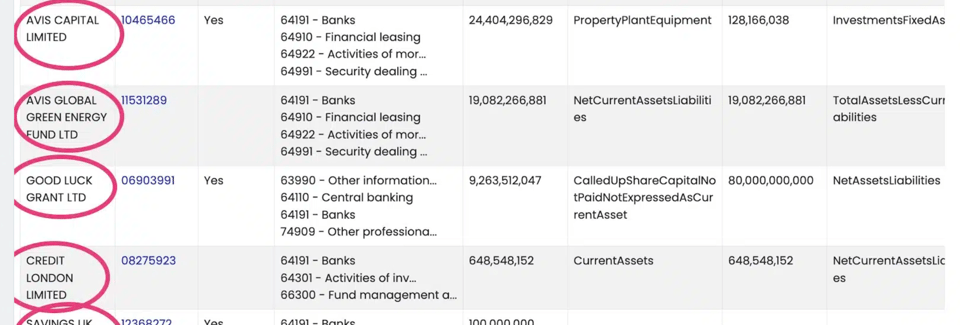
Fraudsters are setting up fake banks on Companies House...
On Threads: "here's how we found 16 in three minutes... using an automated tool we've just made freely available."
Long version and link to the tool on Tax Policy Associates (lawyer Dan Neidle's website).
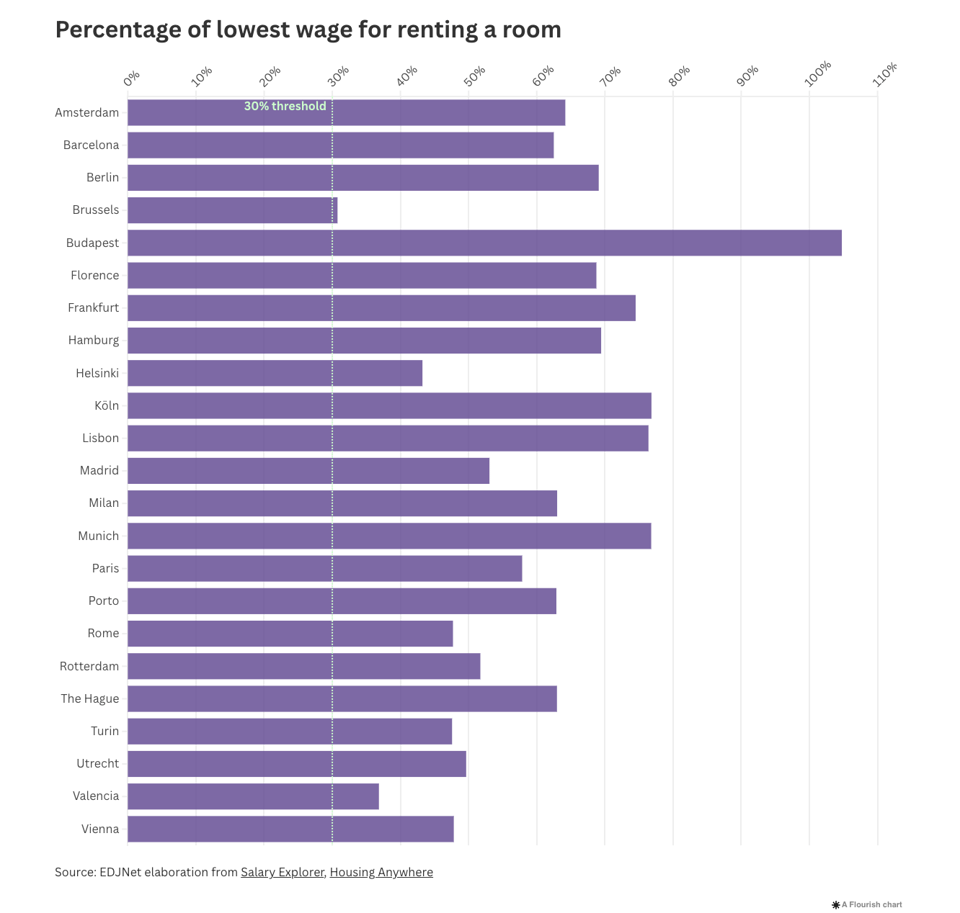
Europe’s rents are on the rise: Who’s hardest hit?
Kata Moravecz – EUrologus/EDJNet: "Rising rents across major European cities are creating a housing crisis, disproportionately affecting low-income earners and those in unstable employment. Contributing factors include tourism, migration, low housing supply, and gentrification. Our investigation, led by EUrologus, highlights the need for policy changes to address these issues and ensure affordable housing for all."
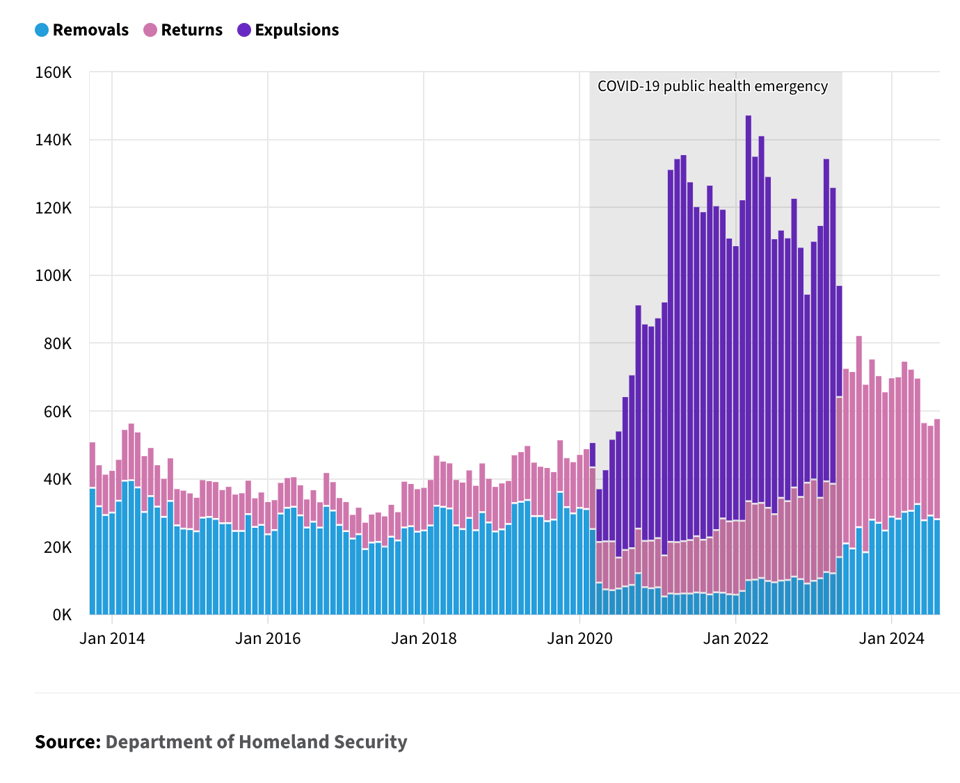
How many people are deported from the US each year?
USAFacts: "The Department of Homeland Security defines deportation as the removal or return of a noncitizen from the United States. However, a broader term can be used, “repatriation”, which also includes COVID-19 related expulsions from the US."
Geocoding at scale
In our final installment in our series about using open data for geocoding we contemplate the challenges of geocoding at scale. What are the issues you face when you have many hundreds of thousands or even millions of coordinates or addresses to work on daily? At OpenCage we serve numerous customers in this category, and a common question that comes up is whether an API based solution can handle that type of scale.
An API-based solution, managed by experts, is almost always the most reliable and most affordable way to develop such an on-going system, as otherwise you will soon be spending a lot of valuable developer time making sure your geodata is staying current. As anyone who has worked with software can confirm: “Building is easy, maintaining is hard”.
Nevertheless, there are challenges that come with depending on any external service, one of course being network availability. At OpenCage we have multiple, fully-redundant data centers, and the availability of our service is independently and publicly monitored by a third party (current and past operational status can be seen at status.opencagedata.com).
Still, even with a highly-available service, some customers worry about the “cost” of crossing the internet to an external service. The fastest API query is the one you don’t even make; a smart caching strategy can go a long way to reducing usage. Because our geocoding API is built on open data you can cache the results as long as you like, and we’ve published a few tips and points to consider.
We hope you’ve enjoyed our series on the issues around geocoding with open data. While we’ve used our service as the example, we believe many of the concepts and considerations will apply regardless of the data processing tools and services you are building on. If you have questions regarding anything we discussed, please get in touch.
Have a project that will need geocoding? See our geocoding buyer's guide for an overview of all the factors to consider when choosing between geocoding services.
![]()
🛠️📖 Tools & Tutorials
Three experiments in LLM code assist with RStudio and Positron
Simon Couch on Tidyverse: "The last few months, I’ve been exploring how AI/LLMs might make my time developing R packages and doing data science more productive. This post will describe three experimental R packages— pal, ensure, and gander—that came out of that exploration, and the core tools underlying them. Taken together, I’ve found that these packages allow me to automate many of the less interesting parts of my work, turning all sorts of 45-second tasks into 5-second ones."
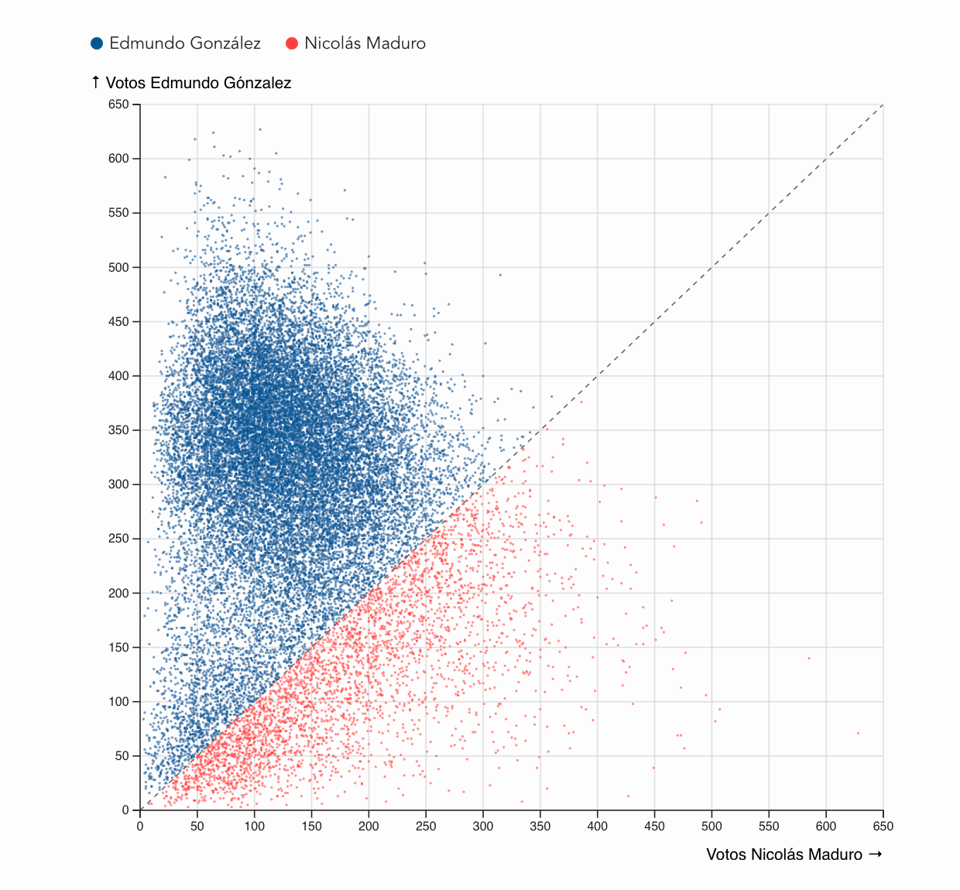
Recreating with D3
Juanchi Parra is doing a great job recreating nice interactive charts that catch his attention, using D3. One of my favourites is the scatterplot below, which shows the results of the Venezuelan presidential elections.
Map-making tools for sci-fi writers
"When it comes to worldbuilding in science fiction, maps can be an essential tool for authors. Not only do they help to visualize and conceptualize the geography of a place, but they can also serve as a reference for consistency and continuity within a story. In the past, authors may have had to rely on hand-drawn maps or simple digital illustrations."
Quite a few tools discussed here, many of which I had never heard of!
(via Geomob)
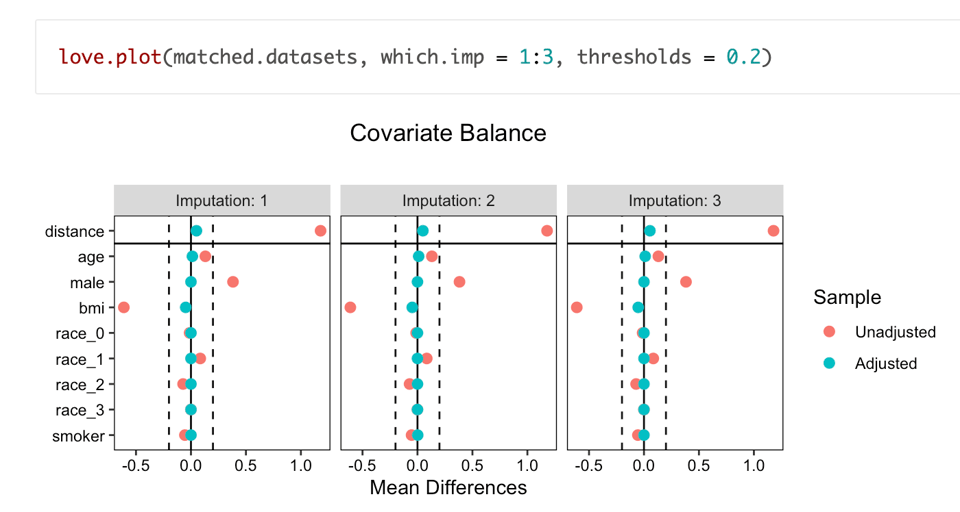
Matching, missing data, a quasi-experiment, and causal inference--Oh my!
Solomon Kurz: "I have a project for work where the goal is to compare two non-randomized groups. One group received an experimental intervention, and we’d like to compare those folks to their peers who were not offered that same intervention. We have easy access to data from folks from the broader population during the same time period, so the goal isn’t so bad as far as quasi-experiments go.1 The team would like to improve the comparisons by using matching, and we have some missing data issues in the matching covariate set. I haven’t done an analysis quite like this before, so this post is a walk-through of the basic statistical procedure as I see it."
Large-scale Generation of Transit Maps from OpenStreetMap Data
Academic Journal klaxon: "We investigate the automatic generation of transit map overlays (either geographically correct or schematic) for the entire planet from OpenStreetMap (OSM) data."
The tool is not quite available (the repo seems offline), but Patric Brosi's other tool TRAVIC is a good starter.
(via Geomob)
gridviz
By Eurostat, "a library for visualizing gridded data".
(via Geomob)
📈Dataviz, Data Analysis, & Interactive
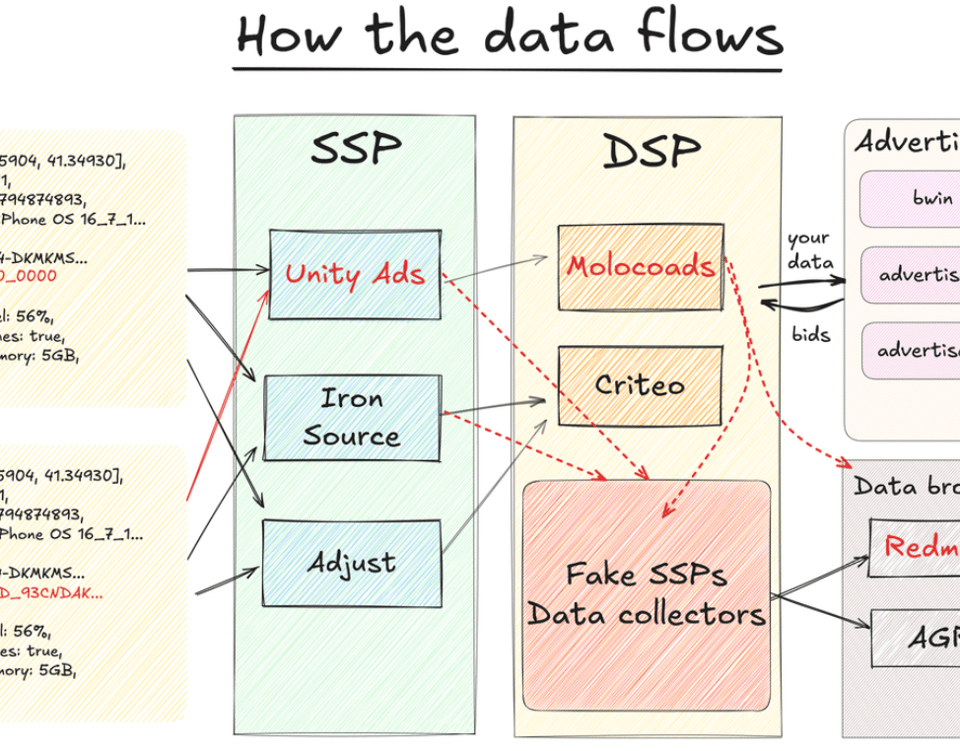
Everyone knows your location: tracking myself down through in-app ads
"...This made me come up with an idea to track myself down externally, e.g. to buy my geolocation data leaked by some application."
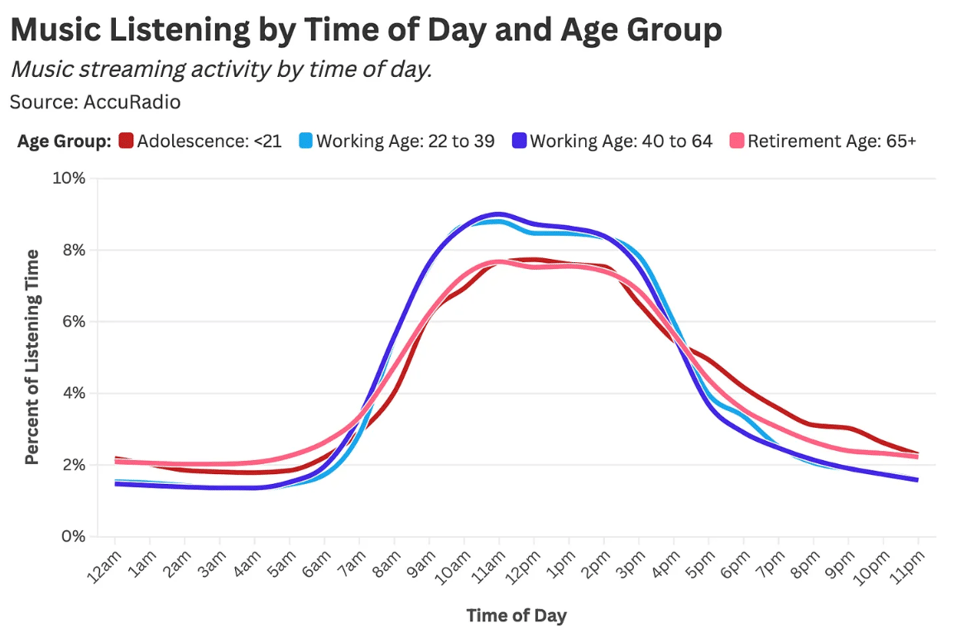
How Do Music Listening Habits Change With Age? A Statistical Analysis
Daniel Parris analyises AccuRadio data and asks: "How does music listening change as we grow older?"
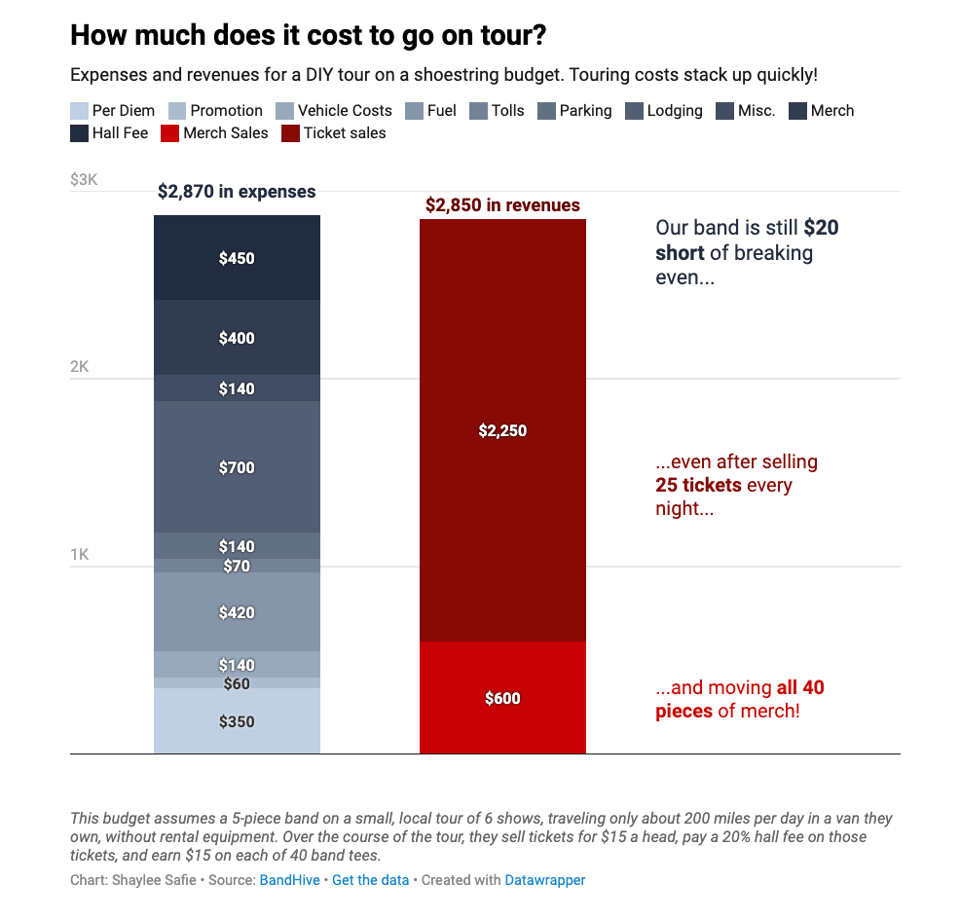
Pay to play
Speaking about music, Shaylee Safie from Datawrrapper looks at the costs faced by music bands on tour
🤖 AI
Why Chatbots Are Not the Future
"When I go up the mountain to ask the ChatGPT oracle a question, I am met with a blank face."
A thought-provoking piece.
AI Forecasting Benchmark Series
Metaculus is running an AI Forecasting competition.
|
DID YOU LIKE THIS ISSUE>? → BUY ME A COFFEE! 
You're receiving this email because you subscribed to Quantum of Sollazzo, a weekly newsletter covering all things data, written by Giuseppe Sollazzo (@puntofisso). If you have a product or service to promote and want to support this newsletter, you can sponsor an issue. |
quantum of sollazzo is also supported by Andy Redwood’s proofreading – if you need high-quality copy editing or proofreading, check out Proof Red. Oh, and he also makes motion graphics animations about climate change.
