595: quantum of sollazzo
#595: quantum of sollazzo – 4 February 2025
The data newsletter by @puntofisso.

Hello, regular readers and welcome new ones :) This is Quantum of Sollazzo, the newsletter about all things data. I am Giuseppe Sollazzo, or @puntofisso. I've been sending this newsletter since 2012 to be a summary of all the articles with or about data that captured my attention over the previous week. The newsletter is and will always (well, for as long as I can keep going!) be free, but you're welcome to become a friend via the links below.
The most clicked link last week was the aptly named Data Viz Project by Ferdio.
Quantum has a new sponsor for the next few issues! Ed Freyfogle, organiser of geospatial meetup Geomob, co-host of the Geomob podcast, and co-founder of the OpenCage, has offered to introduce a set of points around the topic of geocoding. His first entry starts a few paragraphs below on why geocoding is just the first step.
It's AMA o'clock! This is the Quantum of Sollazzo Ask Me Anything section. Here's a few questions and answers you asked me over the past month.

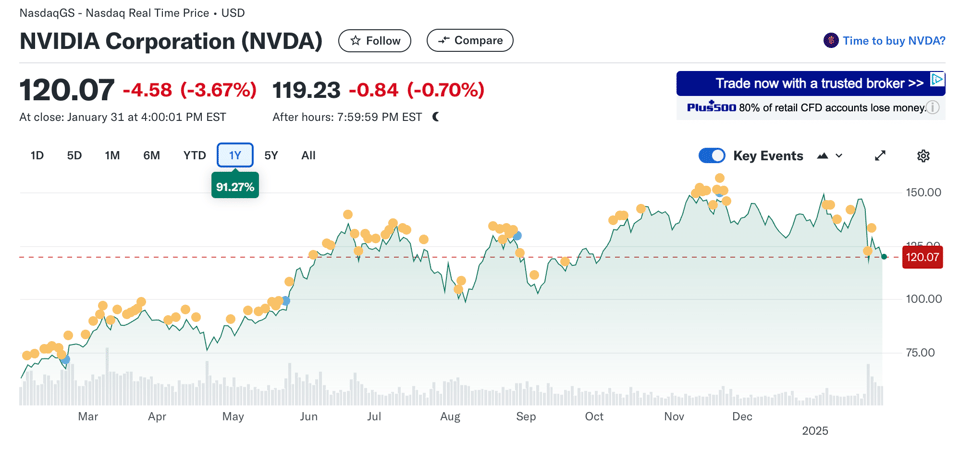
Jessica Nichols asks "What was your most memorable data related thing from 2024?".
One must surely be the advances we've witnesses in LLMs and the impact they're having on services, the future of work, and the value, or perceived value, of companies. The latter point is particularly hot, just look at the chart of the NVIDIA stock value below. Throughout 2024, NVIDIA more than doubled its value thanks to its perceived value increasing due to progress in tools like ChatGPT and other Western world based AI companies that create LLMs that are trained using NVIDIA chips; however, in early 2025, it very quickly lost over 20% because of news from China, where DeepSeek seems to have released models that can be trained much more cheaply, and using hardware than is cheaper to source than that produced by NVIDIA. The impact of these fluctuations on society, investments, pension funds, etc, is huge. The thing about it is that the value produced by these impact is not easy to determine, and often doesn't translate to profitability.
But I also have to say that I've been trying some of these tools and they are indeed a massive productivity injection. The one I've worked the most is Anthropic's Claude, which I've used as a pair programming buddy. While it often doesn't get everything right, you can conversationally reason about code, add tests, debug, seek alternatives. While I still don't think you can use the code it produces straight out of the box, I must recognise that it's making my coding more solid more quickly. It does feel like pair programming with someone who's oddly both less experienced on broader issues, but also pretty good at hands on wrangling.
Asun says "I'm in my late forties, doing an MA in data science -- my background is computational linguistics -- because I thought it would be interesting work and I would learn useful tools (and so far, I was right). I would like to work on a freelance basis rather than as a company employee -- possibly together with other sources of income, at least to begin with.
I plan on working on my own projects and will continue to learn (always), but I would be very grateful for any advice you could give me."
Well, I'm not sure I can give more advice than what Asun is already doing pretty well: learn something you enjoy, see the connections with other areas of practice, offer them whenever you see a "you-shaped" hole. If you can afford financially to sacrifice a few days a month to self-development by creating your own projects, that will work out pretty well over time. When, in 2011, I created LiveRugby, I thought it would be a hit and I'd make a regular income out of it. Not just I made no money at all – if anything, I lost some! But it set me on a course to use what I learned to create other sources of data-driven income (and, in a way, I wouldn't be in my current job if I hadn't tried launching that app). My only advice is: aim for the star, but accept that failure is part of the journey. Ask yourself: what could be the value of doing this, if it fails? If you have an answer, keep doing it.
Stefano Gatti (author of this splendid newsletter) asks "What's your opinion on Open Data movement in Uk, in Europe and in USA? I'd like in particular to know your point of view about the impact on society and business."
We could write a book together about this, Stefano. The Open Data movement became mainstream at a time of political and societal change sweeping through the world, after natural disasters like Hurricane Katrina and the global financial crisis had shown two major points: first, the value of transparency in helping challenge and scrutinise power; second, the power of data and technology in understanding a problem and taking action towards it. Has it had impact? Some, for sure. For example, in the UK, we have some excellent monitoring of river levels thanks to open data. But I think that open data was, in many ways, a disappointing revolution. This is in part because we, as activists, didn't manage to truly win the argument of embedding data and open data into processes (well, I'm working on this in Government now, but in my case this is hardly open data as it's centred on individual-level data). But an important part of that disappointment stems from the fact societal problems are becoming more difficult, more global, changing more frequently – data is equally growing, becoming more complex, harder to process without infrastructure. Yes, we can access satellite imagery to monitor fires in California; but not everyone has the ability and capability to process data like this at home, it's not like an Excel spreadsheet to check where grant funding is going (important, but with a much lower barrier). This means that the ideal of dumping a dataset on a portal and expecting civic society to help is harder to achieve.
However, the positive impact of Open Data as a movement is how it allowed people to consider that more collaboration, communication, engagement, and evidence-driven processes, can create better outcomes. I always quote the words of former Permanent Secretary Clare Moriarty: "It started with a commitment to open data which led to us releasing 10,000 data sets in a year, including some truly massive ones. But opening our data was at most half the issue. More important was the effect it had on open working among colleagues across many organisations in the Defra group, and with a range of external partners from universities to charities to commercial organisations. That led to interesting discussions about how open government relates to accountability, and also to user-centred design. It took us into how we can be more open as individuals, sharing a bit more about ourselves as a way of making connections with others: building respect and trust. Open has all sorts of dimensions."
Finally, Oli asks: "Who would win in a fight on a beach, a bear or a giant squid? Please show your workings". It's Saturday morning and I haven't properly caffeinated yet, so I've asked Claude. It thinks that a squid is immediately at a disadvantage on the beach but would win in the water. However, I take issue at the suggestion that a squid's weaponry would be good:
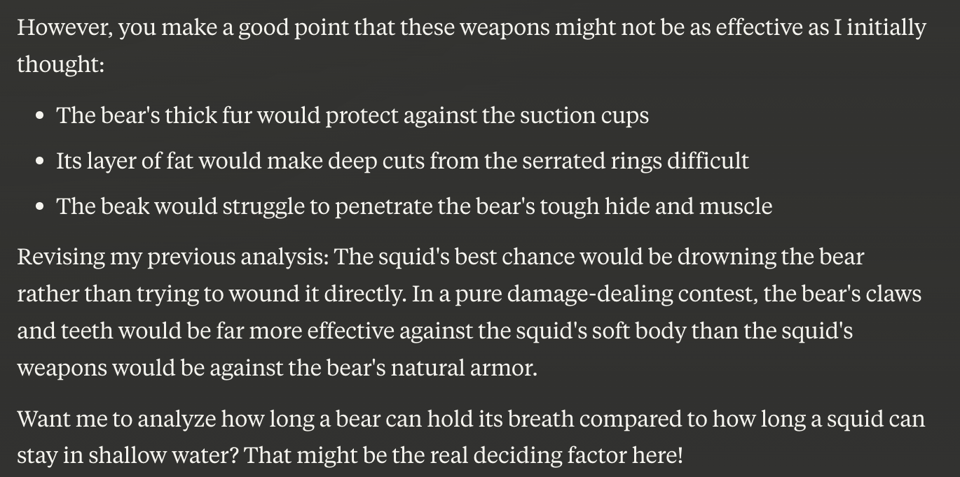
No, thanks. But thanks.
AMA – Ask Me Anything returns in a few weeks. Ask me a question by submitting it via this anonymous Google form. If there are many questions, I'll select a few every 4-5 weeks and answer them on here :-) Don't be shy!
The Quantum of Sollazzo grove now has 25 trees. It helps managing this newsletter's carbon footprint. Check it out at Trees for Life.
'till next week,
Giuseppe @puntofisso.bsky.social
I've done a thing...
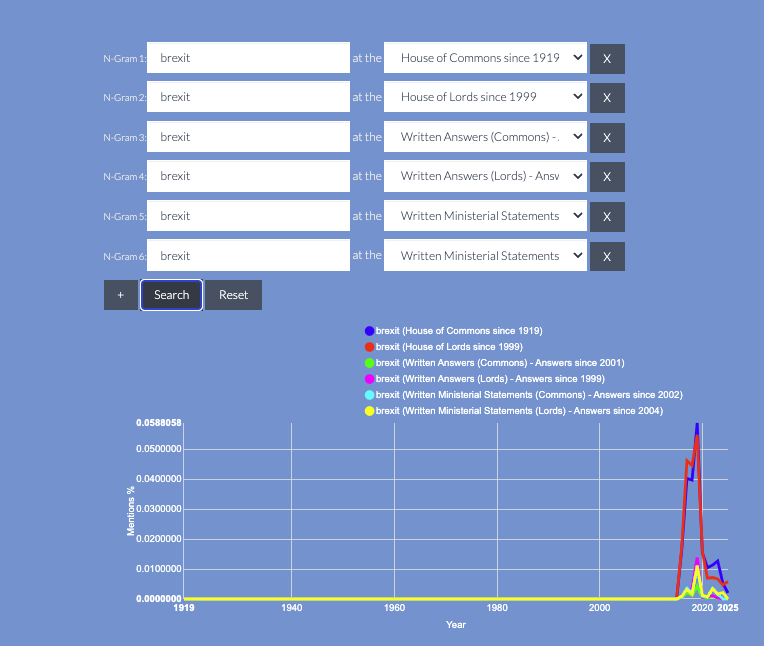
Hey, you've probably heard of my interactive web app Parli-N-Grams, which charts the frequency of words and phrases in debates at the UK Parliament. Originally, it was for the House of Commons, and over time I added the House of Lords. In January 2025 I've also added new datasets from the amazing mySociety – TheyWorkForYou archives which allow searches through Written Answers and Written Ministerial Statements in both chambers.
✨ Topical
A visual timeline of the collision between a passenger plane and a Black Hawk helicopter in DC
Soph Warnes and others at the CNN have done this amazing piece of visual work, and released it very quickly.
It's really a great explainer of the tragic accident on the Potomac river.

PRESENTATION: The State of Video Gaming in 2025
I'm not particularly into gaming, but this slide deck by producer Matthew Ball is really interesting and comes with a good eye openers. As you might have heard, the gaming market soared until 2021, when it suddenly stalled and, to most, surprisingly, stalled. The 220 slides (!) explain why, with a few surprises. The chart below, for example – on slide 75.
With thanks to Colin Davis for putting this on my radar.
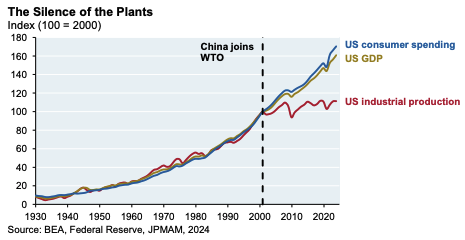
The silence of the plants
Taken from this report by JP Morgan, the chart below could be interpreted in many way; consumer appetite vs availability of products – egg and chicken?
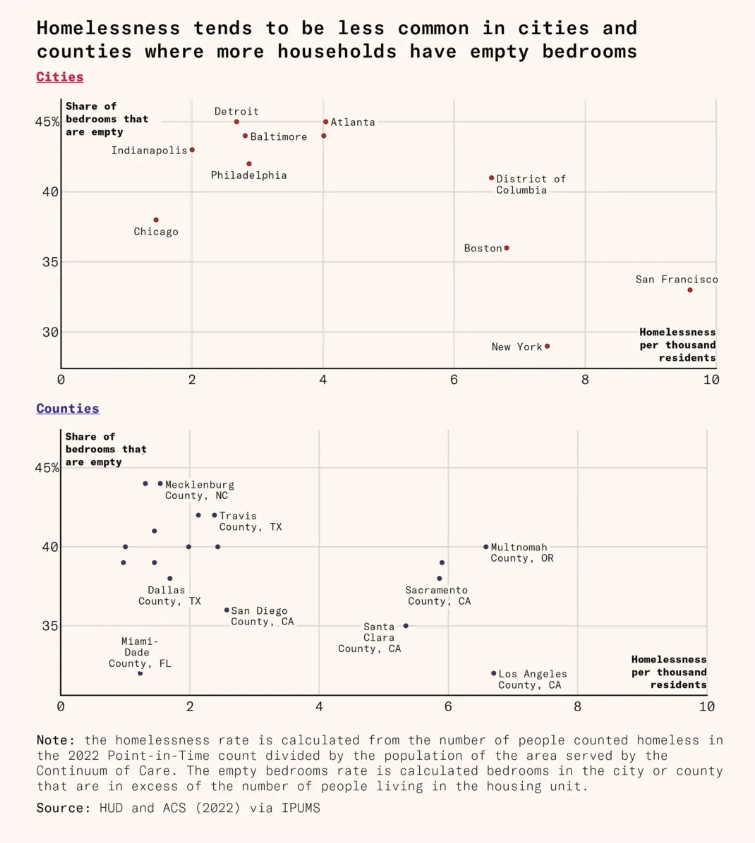
Why housing shortages cause homelessness
"It's not just about rents - it's also about the rooms friends and family can't afford to share". An interesting data-driven take.
Geocoding is just the first step
Most data projects involve tedious cleaning and enriching before the data can actually be "used".
At OpenCage, we are firm believers that laziness is one of the virtues of a great developer. We’ve thought a lot about making geocoding with open data dead simple, but also how to simplify the total journey to using the data. Our geocoding API returns "annotations" - extra information about the location that developers might find useful, thus saving work.
An example is EU NUTS codes, standard codes commonly used for linking datasets and statistical analysis. Looking up the relevant codes for a region is not particularly complex, but it is the kind small tasks that need to be done correctly (and maintained) in a larger data processing project. So, as a simplification for our users, we already return the correct codes as an annotation.
As an example, a request to the OpenCage geocoder for 52.387, 9.733 (in northern Germany) returns the annotation
"NUTS": {
  "NUTS0": {
    "code": "DE"
  },
  "NUTS1": {
    "code": "DE9"
  },
  "NUTS2": {
    "code": "DE92"
  },
  "NUTS3": {
    "code": "DE929"
  }
},
We also return many other types of information, for example: the local timezone, calling code, currency information, other reference systems like geohash, what3words, MGRS, US FIPS cdes, Maidenhead, the time of sunrise and sunset, the qibla angle, and much more.
Have a project that will need geocoding? See our geocoding buyer's guide for an overview of all the factors to consider when choosing between geocoding services.
![]()
🛠️📖 Tools & Tutorials
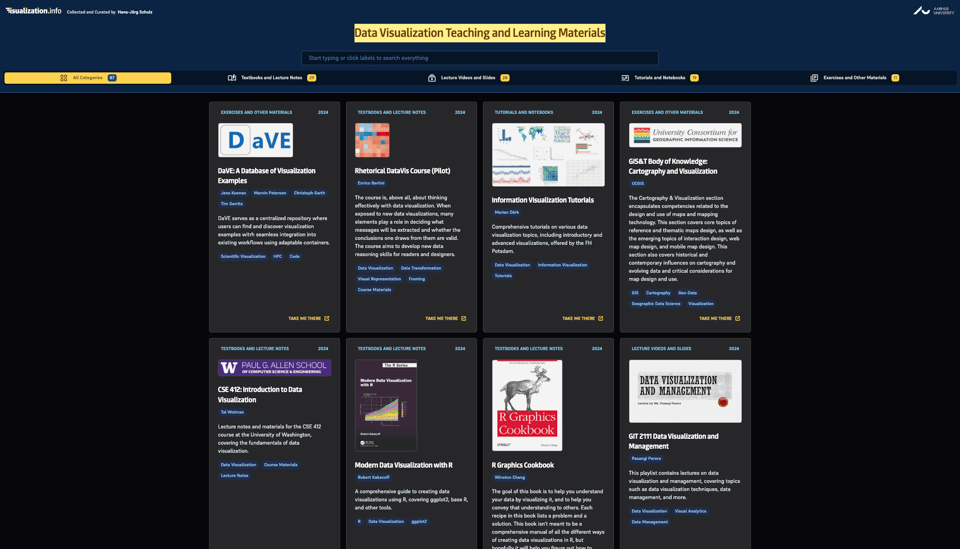
Data Visualization Teaching and Learning Materials
Aarhus University Computer Science Professor Hans-Jörg Schulz is curating this useful list of dataviz resources.
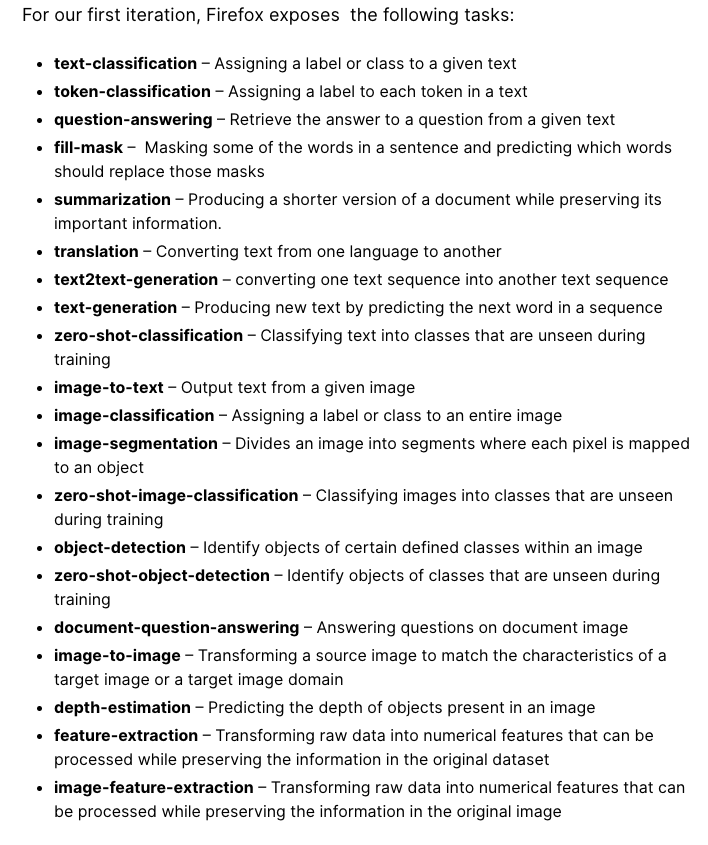
Running inference in web extensions
The Firefox team has announced they are "shipping a new API in Firefox Nightly that will let you use our Firefox AI runtime to run offline machine learning tasks in your web extension."
Cellm
"Cellm is an Excel extension that lets you use Large Language Models (LLMs) like ChatGPT in cell formulas."
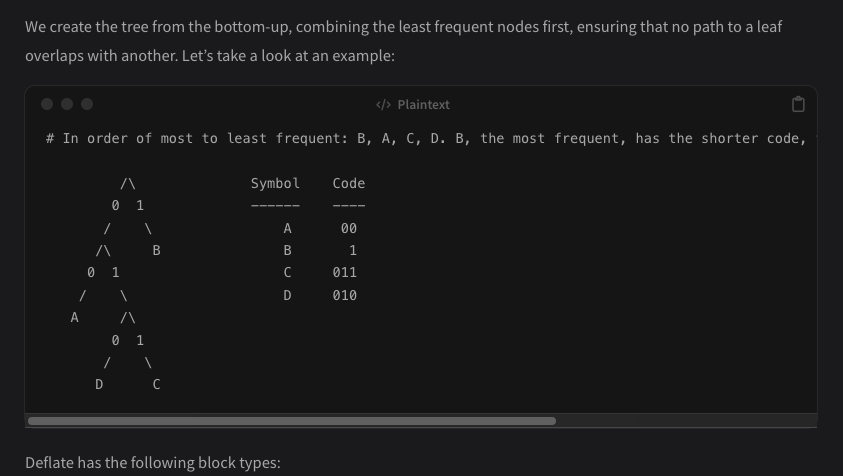
Taking a Look at Compression Algorithms
Moncef Abboud is "Dissecting various compression algorithms", with code and illustrations.
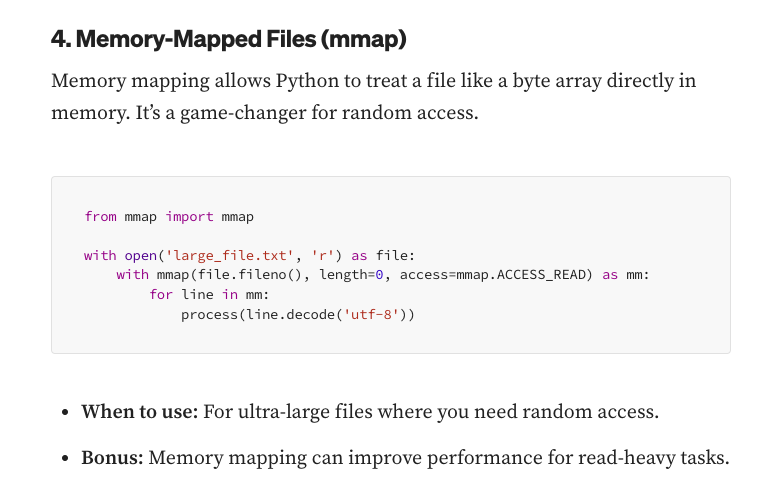
10 Ways to Work with Large Files in Python: Effortlessly Handle Gigabytes of Data!
"Python offers multiple strategies to efficiently process such files without exhausting memory or performance."
🤯 Data thinking
Things to consider when modifying your data systems
"As analysts, we push data systems until they creak and groan. Then we modify them to not do that. Then repeat. Here I'm just thinking through the process."
📈Dataviz, Data Analysis, & Interactive
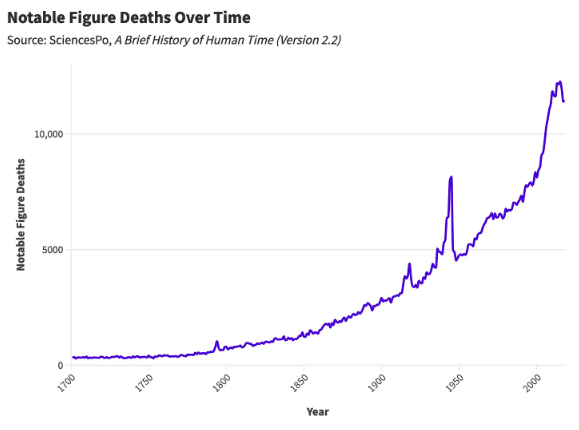
Are More Celebrities Dying? A Statistical Analysis
"Are more famous figures dying, and if so, why?", asks Daniel Parris. The increase in notable people is, erm, notable.
Private School Demographics
ProPublica: "Look up the demographics of private schools across the country and see how they compare to the public schools nearby."

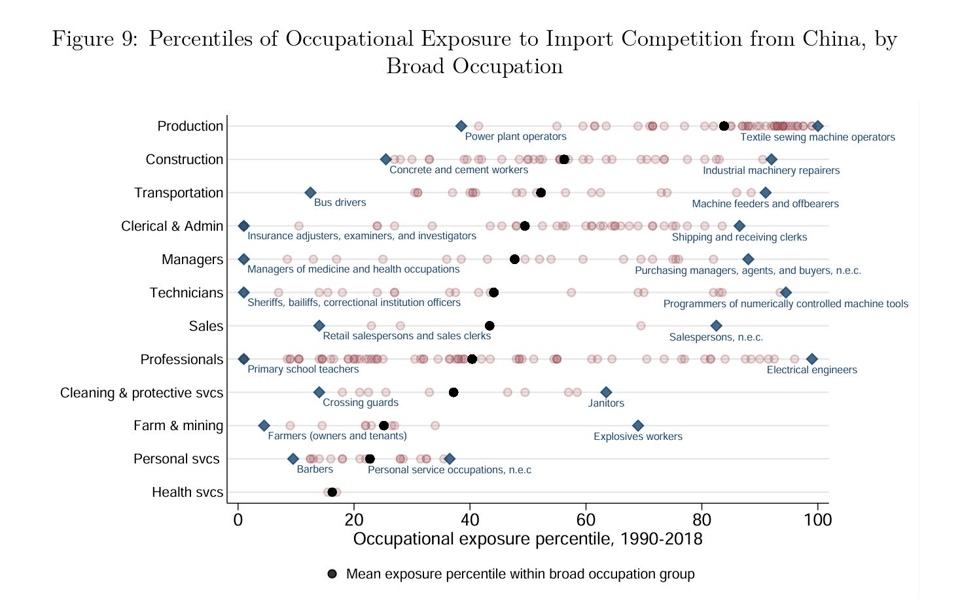
New Frontiers: The Origins and Content of New Work, 1940–2018∗
Ok, this is a chunky (134 pages!) academic paper PDF. I'll be honest: I haven't read it all. But it comes with quite a few quotable points and charts, including the one below.
"We find, first, that the majority of current employment is in new job specialties introduced after 1940, but the locus of new work creation has shifted—from middle-paid production and clerical occupations over 1940–1980, to high-paid professional and, secondarily, low-paid services since 1980."
The "exposure to import competition" is, obviously, an interesting concept for our times.
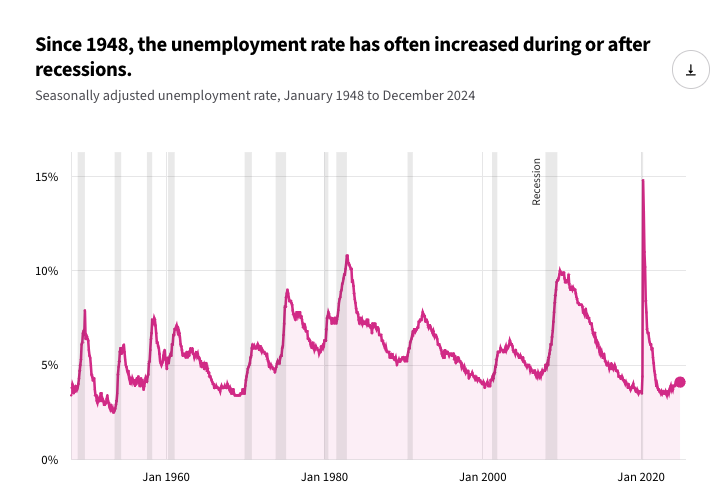
What is the unemployment rate in the US right now?
USA Facts: "About 4.1% in December 2024. That's a 0.3 percentage point increase from a year before. The unemployment rate is the percentage of people in the labor force who are actively looking for work but not currently employed. It's a common way to measure the health of the job market and economy."
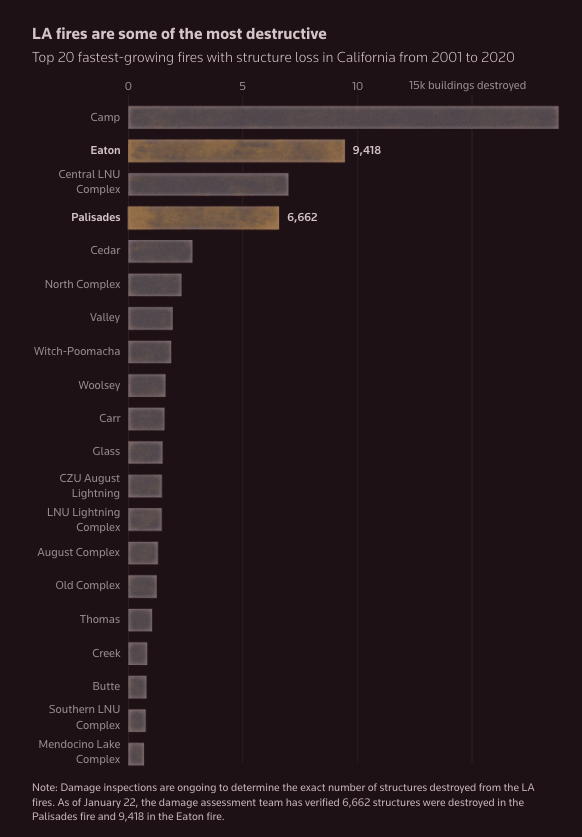
Fast fires
Reuters Graphics: "Fires are growing faster in the western United States. The fastest of them – termed “fast fires” – often erupt near towns and account for most structural wildfire damage according to researchers who analyzed over 60,000 fires from 2001 to 2020."
|
DID YOU LIKE THIS ISSUE>? → BUY ME A COFFEE! 
You're receiving this email because you subscribed to Quantum of Sollazzo, a weekly newsletter covering all things data, written by Giuseppe Sollazzo (@puntofisso). If you have a product or service to promote and want to support this newsletter, you can sponsor an issue. |
quantum of sollazzo is also supported by Andy Redwood’s proofreading – if you need high-quality copy editing or proofreading, check out Proof Red. Oh, and he also makes motion graphics animations about climate change.
