591: quantum of sollazzo
#591: quantum of sollazzo – 7 January 2025
The data newsletter by @puntofisso.

Hello, regular readers and welcome new ones :) This is Quantum of Sollazzo, the newsletter about all things data. I am Giuseppe Sollazzo, or @puntofisso. I've been sending this newsletter since 2012 to be a summary of all the articles with or about data that captured my attention over the previous week. The newsletter is and will always (well, for as long as I can keep going!) be free, but you're welcome to become a friend via the links below.
Happy new year, folks! The most clicked link last week was my chart on Datawrapper, looking at life expectancy vs common retirement age.
It's AMA o'clock! This is the Quantum of Sollazzo Ask Me Anything section.
AMA – Ask Me Anything by submitting a question via this anonymous Google form. If there are many questions, I'll select a few every 4-5 weeks and answer them on here :-) Don't be shy!

The Quantum of Sollazzo grove now has 20 trees. It helps managing this newsletter's carbon footprint. Check it out at Trees for Life.
Last but not least, Quantum has a new sponsor for the next few issues! Ed Freyfogle, organiser of geospatial meetup Geomob, co-host of the Geomob podcast, and co-founder of the OpenCage, has offered to introduce a set of points around the topic of geocoding. His first entry starts a few paragraphs below on "What is geocoding?".
'till next week,
Giuseppe @puntofisso
✨ Topical
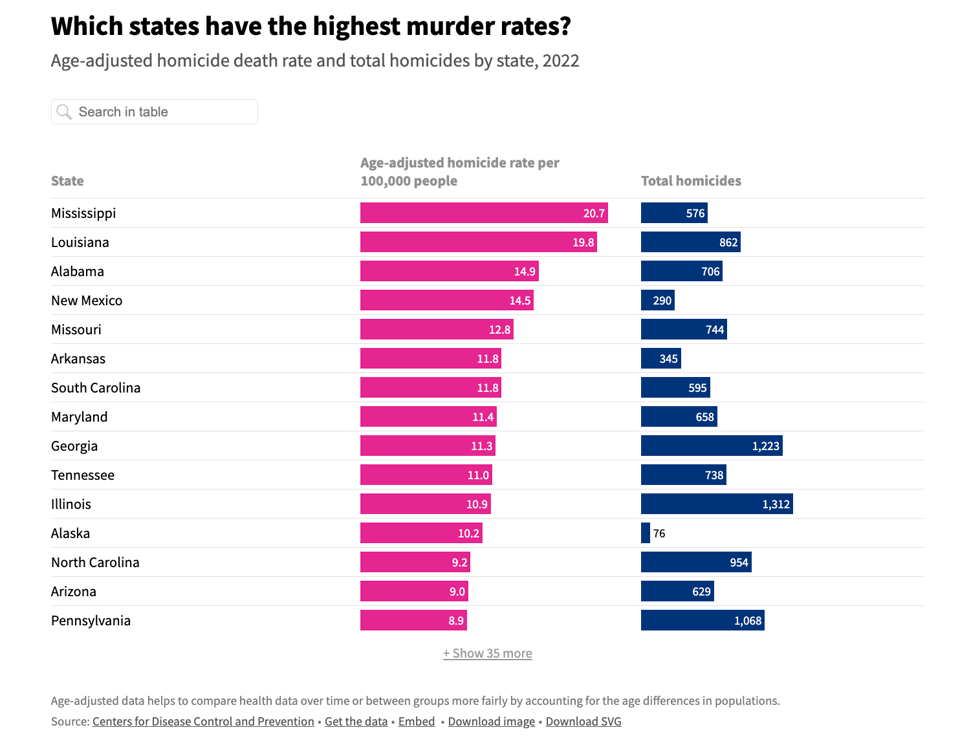
USAFacts’ top 10 articles of 2024
"Foreign aid, election data, border security, and the standard of living in America were among readers’ favorite articles."
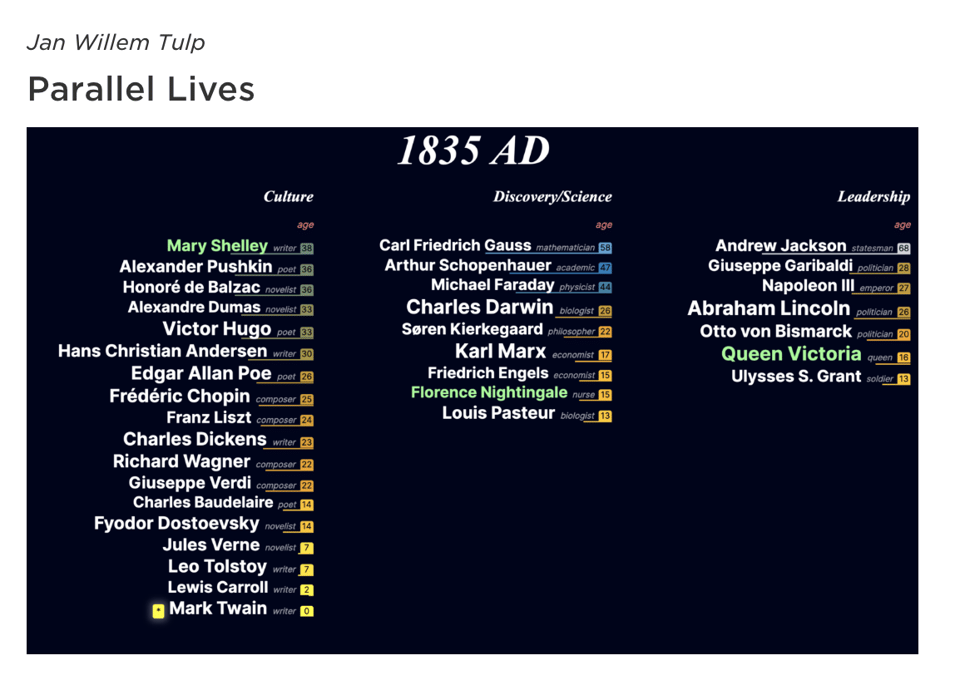
Best Data Visualization Projects of 2024
Another "best of", this time by Flowing Data's Nathan Yau. Some of them were in Quantum.
What is geocoding?
Geocoding is translating between geo coordinates (latitude, longitude) and human place descriptions (addresses, placenames, etc). There are two kinds of geocoding:
- Forward geocoding: address to coordinates
- Reverse geocoding: coordinates to address
More smart phones and tracking devices means more geodata is being created than ever before. Geocoding is a first step in processing that data into useful information. In the coming weeks this series will look at the challenges around geocoding.
At OpenCage we run a highly available, simple to use, worldwide, geocoding API based on open datasets like OpenStreetMap. Have a project that will need geocoding? See our geocoding buyer's guide for an overview of all the factors to consider when choosing between geocoding services.

🛠️📖 Tools & Tutorials
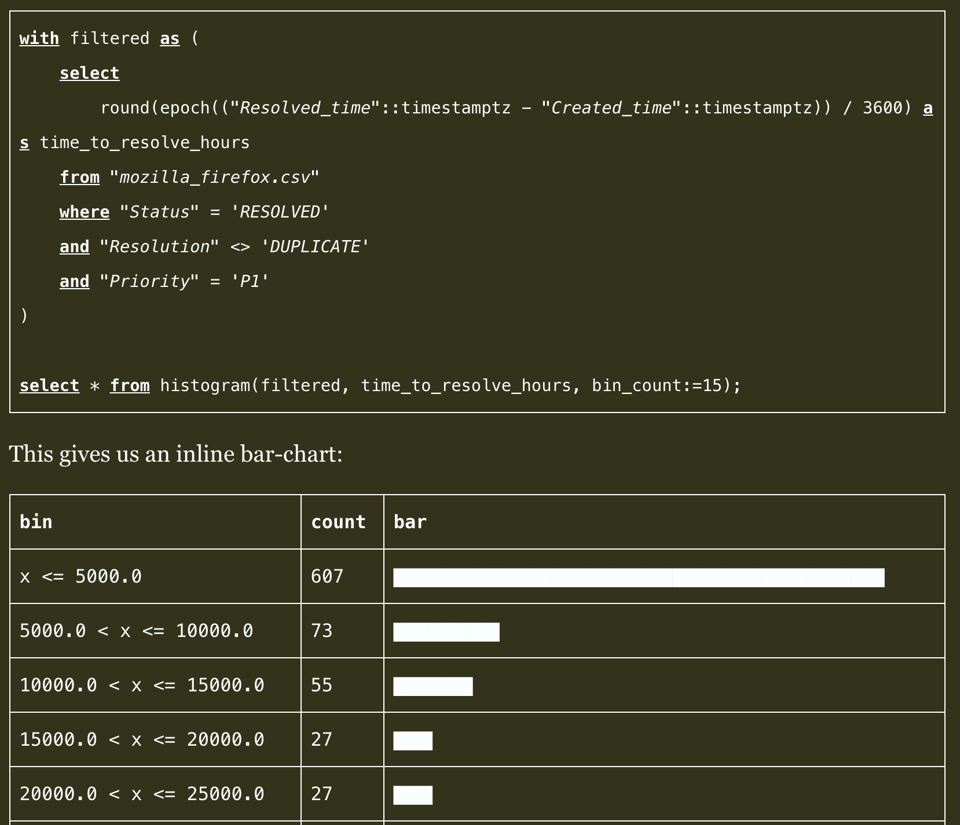
Leadership Power Tools: SQL and Statistics
"A common pattern I’ve seen over the years have been folks in engineering leadership positions that are not super comfortable with extracting and interpreting data from stores, be it databases, CSV files in an object store, or even just a spreadsheet. We’re going to cover SQL & DuckDB, then some useful statistical tools: summary stats, distributions, confidence intervals and Bayesian reasoning."
Collection of insane and fun facts about SQLite
"SQLite is the most deployed and most used database. There are over one trillion (1000000000000 or a million million) SQLite databases in active use."
And many more. Some of them are truly insane, such as the fact it is maintained by 3 people who don't allow any external contribution.
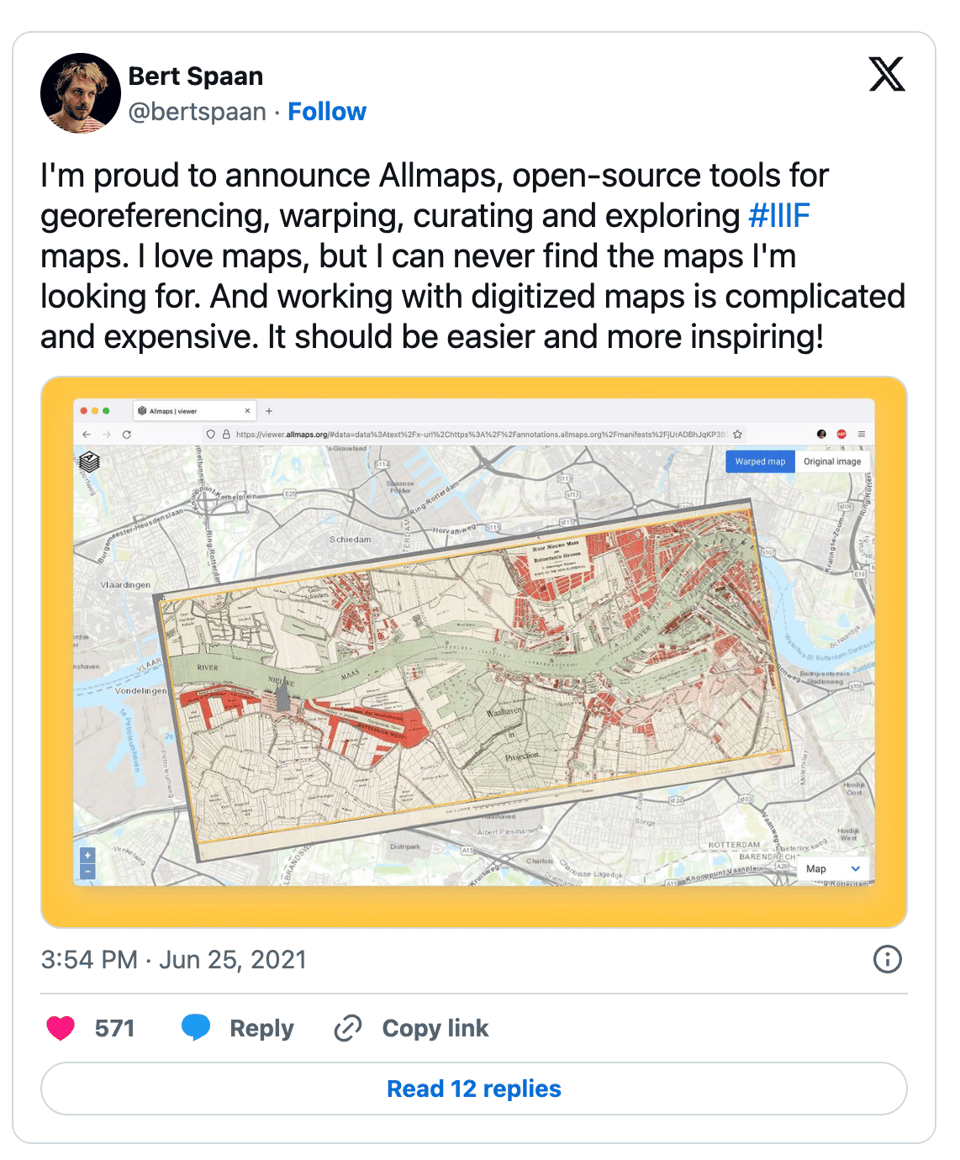
Using GPS in the year 1565
"There’s a wonderful web app (“Allmaps Here”) that shows your GPS location on old maps." This blog post gives a few hints on how to use it.
(via Geomob)
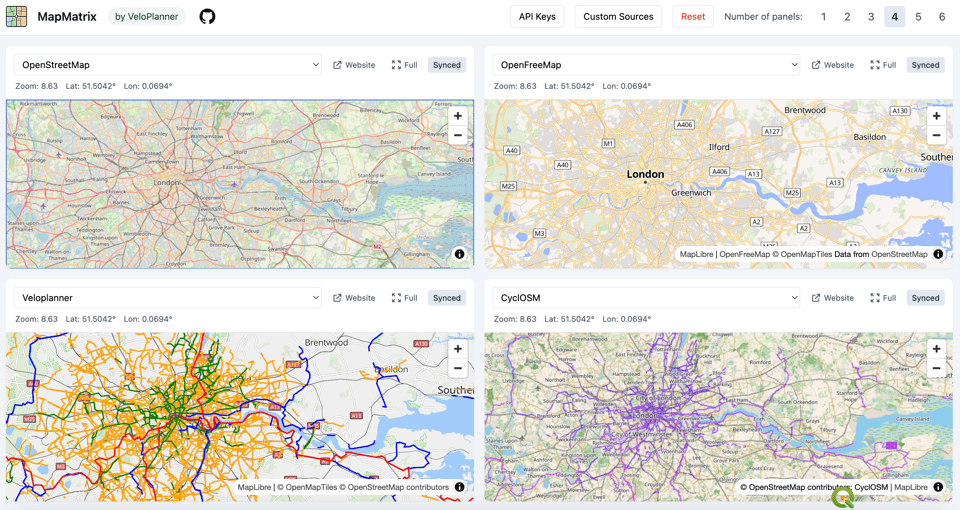
MapMatrix
A simple website allowing users to create synchronised grids of maps. Here's London.
(via Geomob)
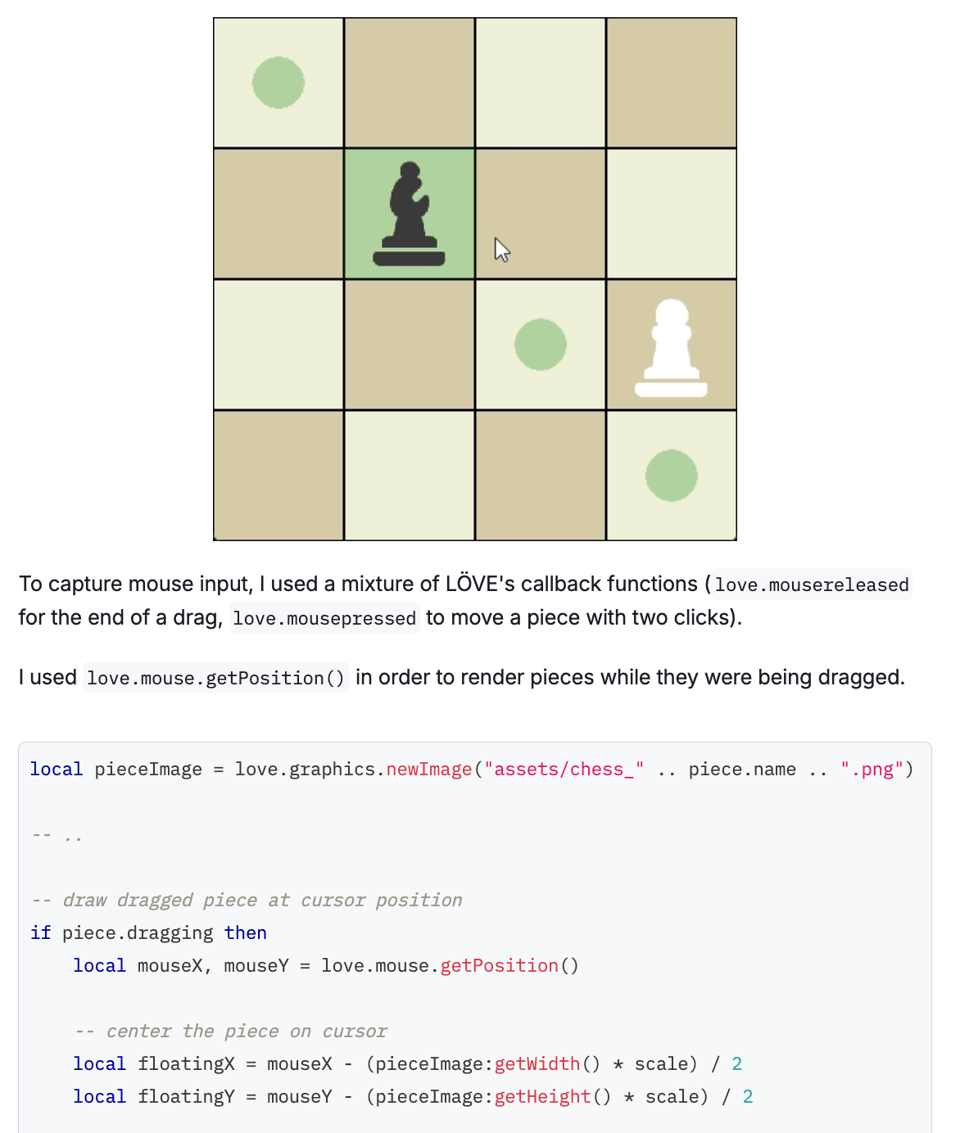
Building Game Prototypes with LÖVE
Software engineer Andrew Healey: "One of my goals for 2025 is to build a complete game. Complete as in, you can buy it on Steam or the App Store for $2.99 or so. I've made little games before but completing and shipping a game would probably be my largest side project yet (aside from this blog).
Over the winter break, I spent some time building game prototypes with LÖVE — a framework for making 2D games in Lua. My goal was to research which game making tools fit my skillset, and to find where my strengths lie so that I can be efficient with my time in 2025."
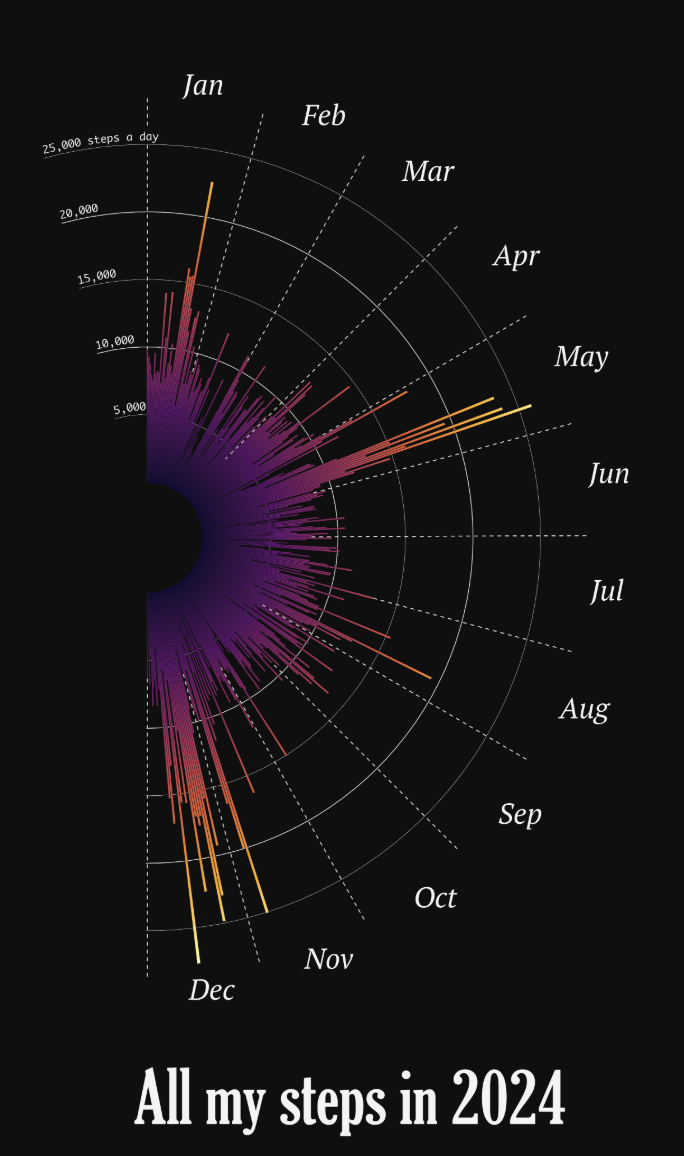
Visualizing all my steps
"Today I’ll write a bit about a visualization that’s not a map. It’s the beginning of the new year (happy new year, everyone!) and I’ve been playing with data from my Fitbit tracker. Here’s a glance at all the 3.2 million steps I’ve taken in 2024."
With code to make a radial chart in R.
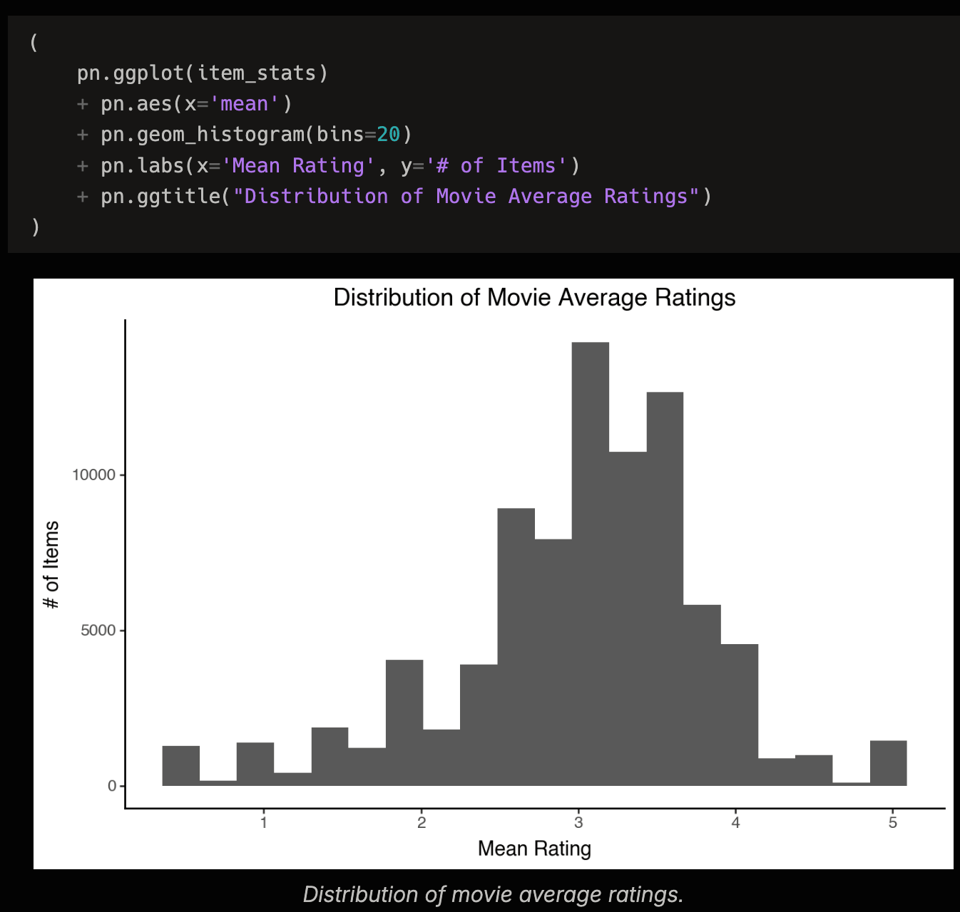
Describing Distributions
Academic Michael Ekstrand: "In various data analyses, we often need to visualize distributions of various quantative varibles. There are quite a few ways to do this, and I often find myself needing to explain them, so I thought I’d write them down for future reference and hopeful general usefulness."
The article also mentions a Jupyter notebook, but the link is broken at the time I'm writing this.
📈Dataviz, Data Analysis, & Interactive
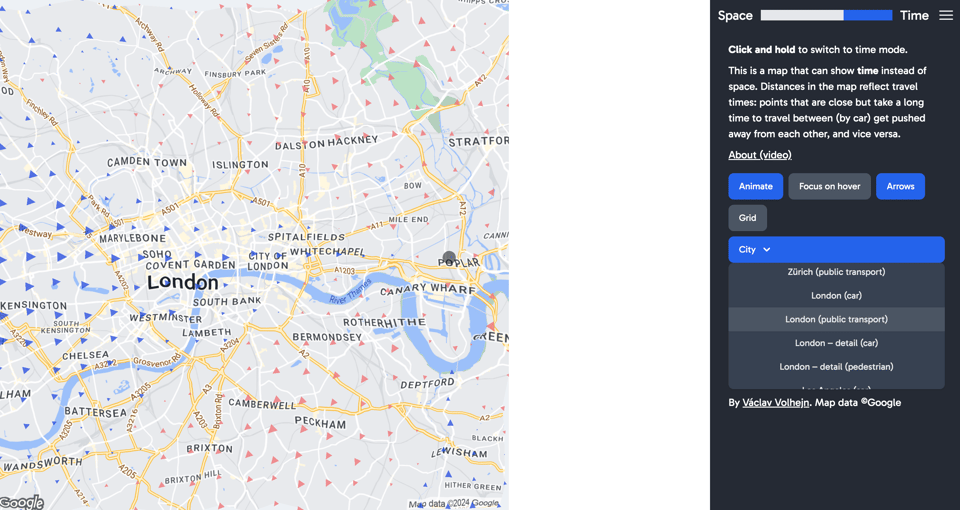
I made maps that show time instead of space
The maps are here and here's a video explaining how he made them.
(via Durand D'souza)
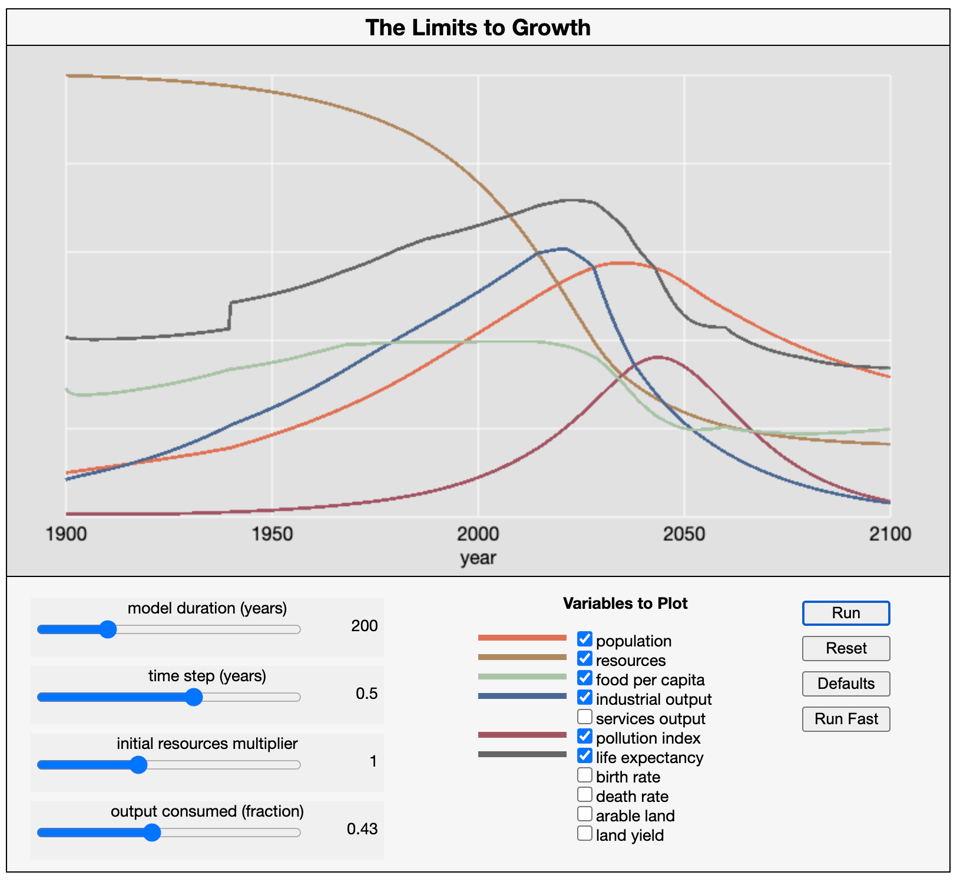
The Limits to Growth
With some caveats (see Wikipedia), this is Brian Hayes' web-based version of "The Limits to Growth" 1972 model.
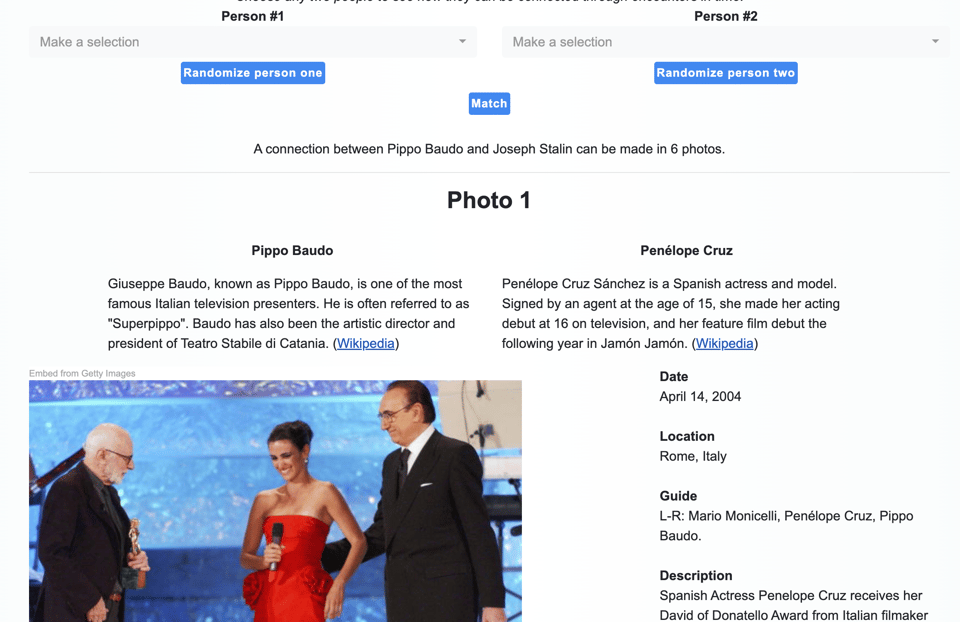
The Network Of Time
"The Network Of Time is an idea proposed on this website: the largest network of people who appear together in photos that currently exist which can be connected through peoples' recurring appearances in different photos."
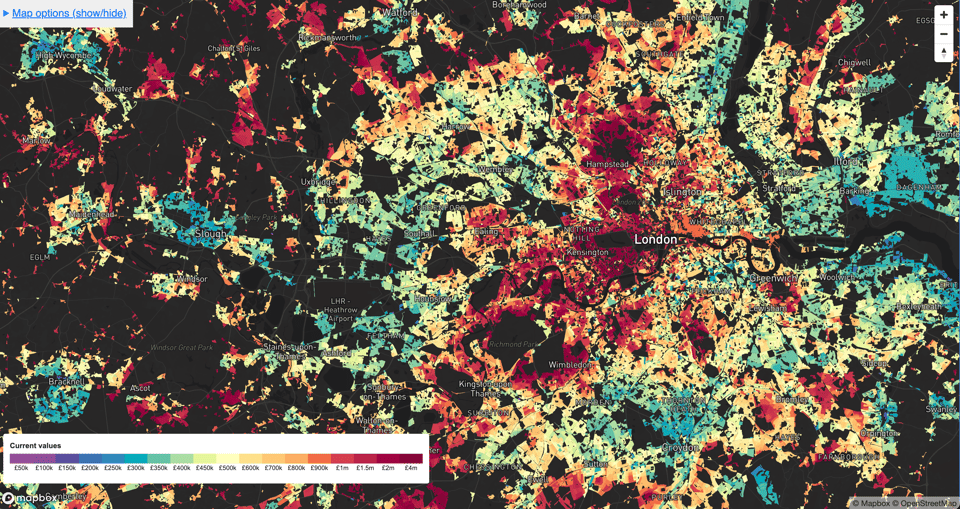
Housemetric
A great tool to visualize hows prices in England and Wales. To get the square meter level data you have to register, but it's pretty good, going down to individual house sales.
🤖 AI
Things we learned about LLMs in 2024
Simon Willison, who's quickly becoming my go-to guru on how to use effectively LLMs: "A lot has happened in the world of Large Language Models over the course of 2024. Here’s a review of things we figured out about the field in the past twelve months, plus my attempt at identifying key themes and pivotal moments."
|
DID YOU LIKE THIS ISSUE>? → BUY ME A COFFEE! 
You're receiving this email because you subscribed to Quantum of Sollazzo, a weekly newsletter covering all things data, written by Giuseppe Sollazzo (@puntofisso). If you have a product or service to promote and want to support this newsletter, you can sponsor an issue. |
quantum of sollazzo is also supported by Andy Redwood’s proofreading – if you need high-quality copy editing or proofreading, check out Proof Red. Oh, and he also makes motion graphics animations about climate change.
