583: quantum of sollazzo
#583: quantum of sollazzo – 12 November 2024
The data newsletter by @puntofisso.

Hello, regular readers and welcome new ones :) This is Quantum of Sollazzo, the newsletter about all things data. I am Giuseppe Sollazzo, or @puntofisso. I've been sending this newsletter since 2012 to be a summary of all the articles with or about data that captured my attention over the previous week. The newsletter is and will always (well, for as long as I can keep going!) be free, but you're welcome to become a friend via the links below.
The most clicked link last week was Yan Holtz's very useful gallery of React-based charts.
The next answers to my AMA – Ask Me Anything sessions is in a couple of weeks. Enter your questions via this anonymous Google form. Don't be shy!

The Quantum of Sollazzo grove now has 15 trees. It helps managing this newsletter's carbon footprint. Check it out at Trees for Life.
This week I'm in Madrid to speak at TRGCON! More to follow on this in the next issue.
Meanwhile, if you're in London on Wednesday, 4th December, I will be on a panel about the future of data with two data celebrities – Number 10's Data Science Director Dr Laura Gilbert and London's Chief Digital Officer Theo Blackwell. Let the impostor syndrome begin...
Also, take a look at The Pudding cup, their yearly competition about dataviz, and maybe consider submitting something!
'till next week,
Giuseppe @puntofisso
✨ Topical (yes, there was an election)
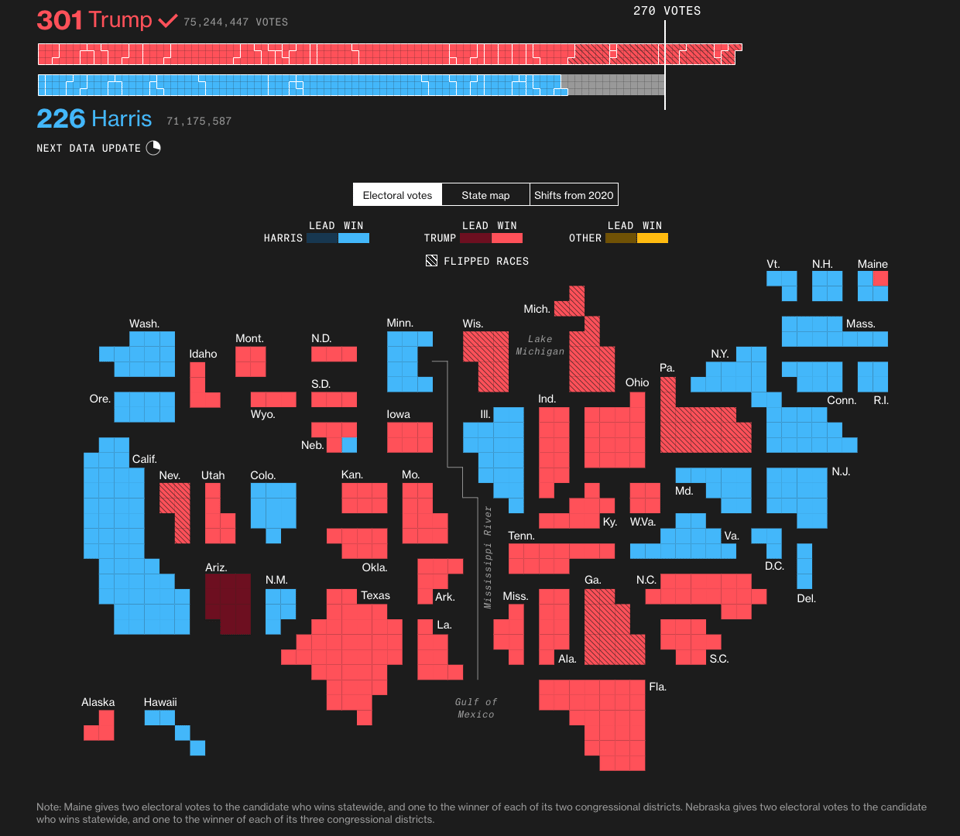
US Presidential Election Results
"Bloomberg News is reporting live election results in the presidential race between Democratic Vice President Kamala Harris and her Republican challenger, former President Donald Trump."
Some pretty good charts.
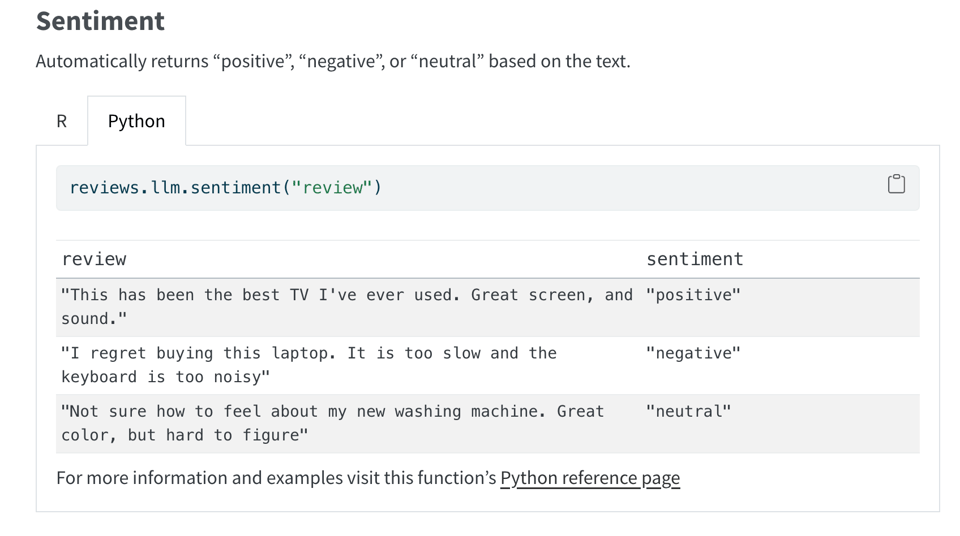
Partisan Investing
Not quite my usual source, but I found this article rather interesting and well argued: "In today’s polarized climate, partisan politics pose a major challenge for investors, especially around elections. We identify “Democratic” and “Republican” stocks based on their political contributions. While such contributions generally represent profitable “investments in influence,” highly partisan donations, particularly from executives, have generated limited shareholder returns. In contrast, “nonpartisan stocks,” which invest in diversified portfolios of candidates from both parties, have delivered excess returns with lower political risk."
It also offers a historical perspective.
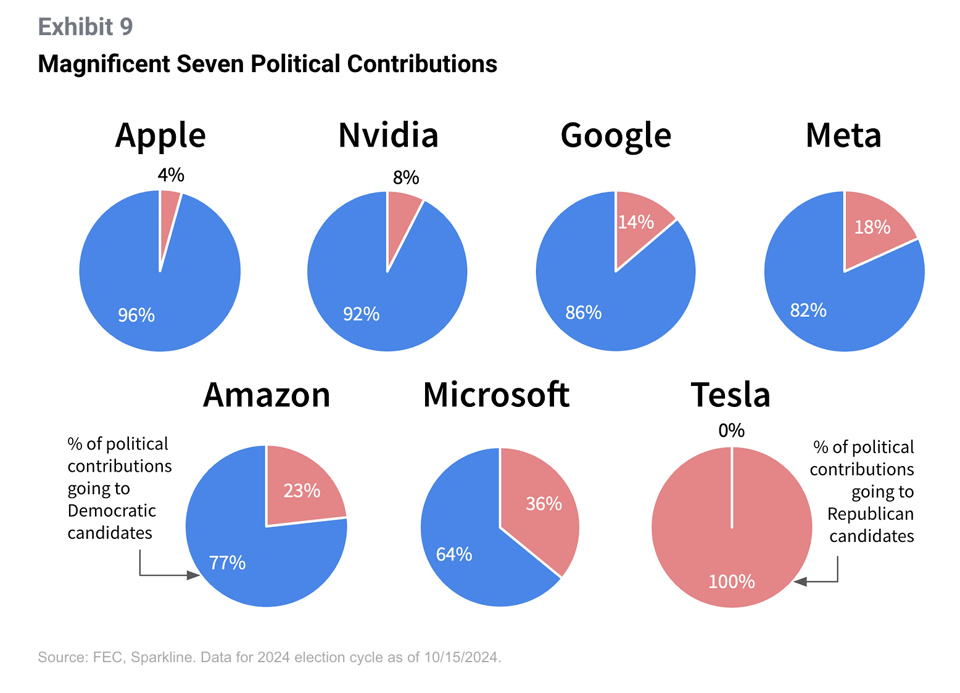
How early risers, gossip-spreaders, UFO-seers and more lean in the presidential election
YouGov: "YouGov's extensive compilation of polls from recent months captures the expected and unexpected ways that Americans are split over the 2024 election. Harris does better with atheists, renters, and people with college degrees — and also with people who like to see movies in theaters or to sleep in. Trump does better with people who are Protestant, married, or live in rural areas — and also with people who have been in a car crash or think they've seen a UFO."
And I'm a total sucker for a good log odds chart.
Climate Policy Radar Open Data
London-based Charity Climate Policy Radar have released the full text data of all their documents as open data.
Principal Data Scientist Kalyan Dutia: "This is all of the laws, policies and international agreements (including NDCs). I've been working on figuring out how to load and efficiently query this dataset too - link to notebook in comments."
Bluesky is going viral
Well, not quite – but the communities I'm in have started to pick up pace. For example, Dominic Royé, who is one of my gurus in geospatial stuff, has created a starter pack of accounts to follow. Catherine Breslin has one of women in AI, while Randy Au has launched one about folks in data.
Join The Rest
Algorithms keep giving you more of the same. Our weekday newsletter is dedicated to the rest. A song and an interesting story about it, every weekday. Refreshing, insightful and snackable.

🛠️📖 Tools & Tutorials
Project: VERDAD—tracking misinformation in radio broadcasts using Gemini 1.5
The actual tool is here but this link chronicles Simon Willison's interview to Martina Guzmán, the project lead.
mall
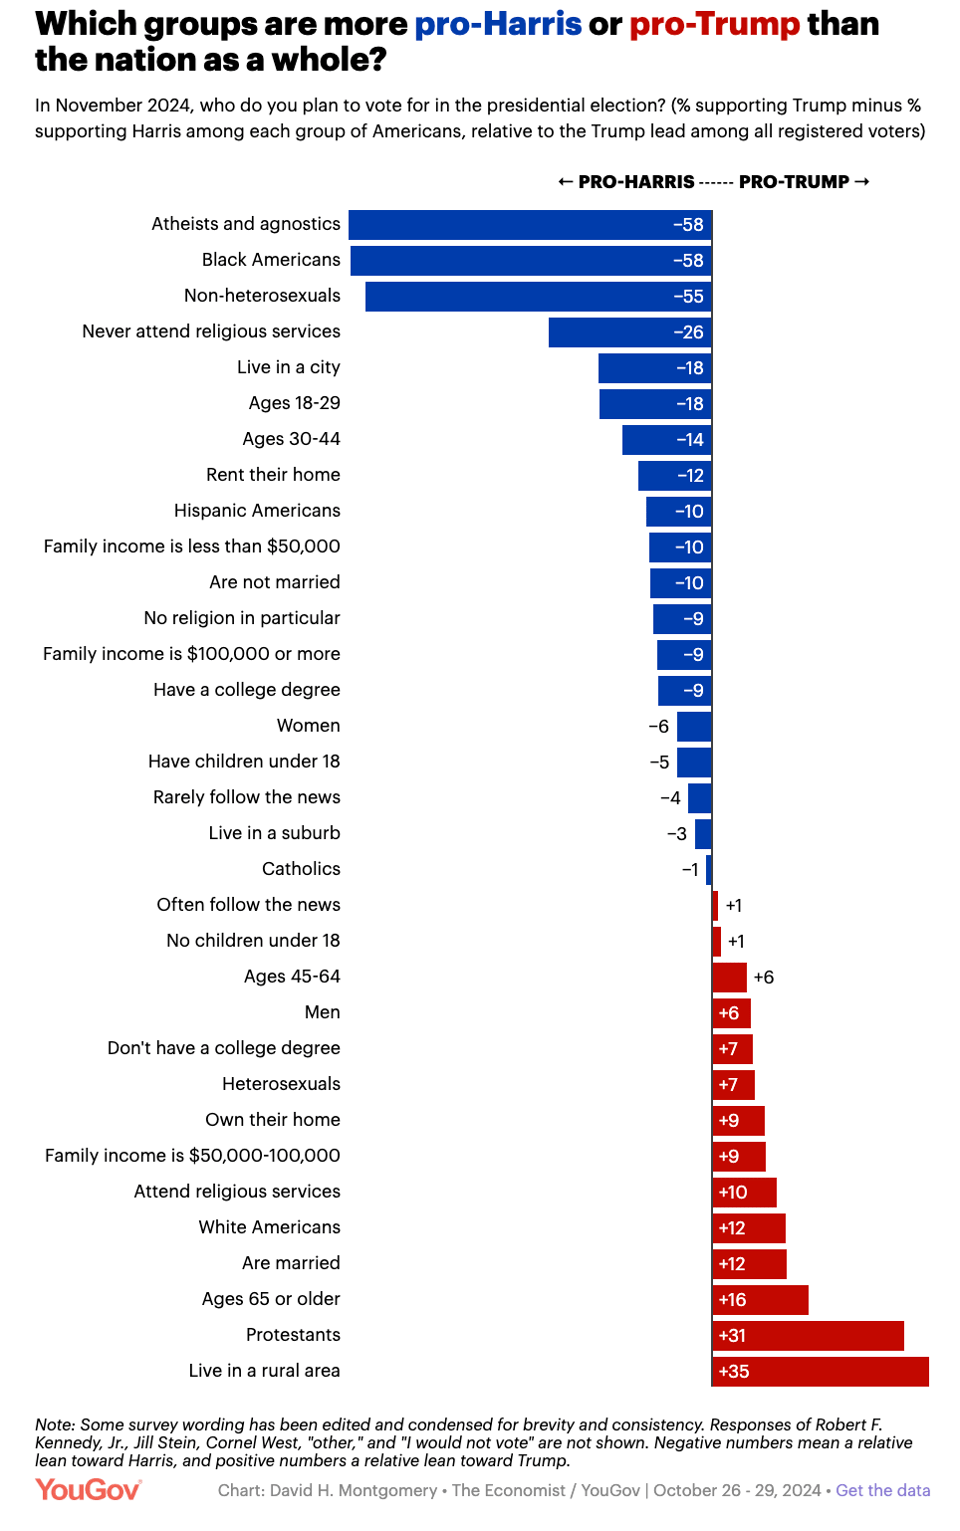
"Run multiple LLM predictions against a data frame. The predictions are processed row-wise over a specified column. It works using a pre-determined one-shot prompt, along with the current row’s content. mall has been implemented for both R and Python. mall will use the appropriate prompt for the requested analysis.
Currently, the included prompts perform the following:
-Sentiment analysis
-Text summarizing
-Classify text
-Extract one, or several, specific pieces information from the text
-Translate text
-Verify that something it true about the text (binary)
-Custom prompt"
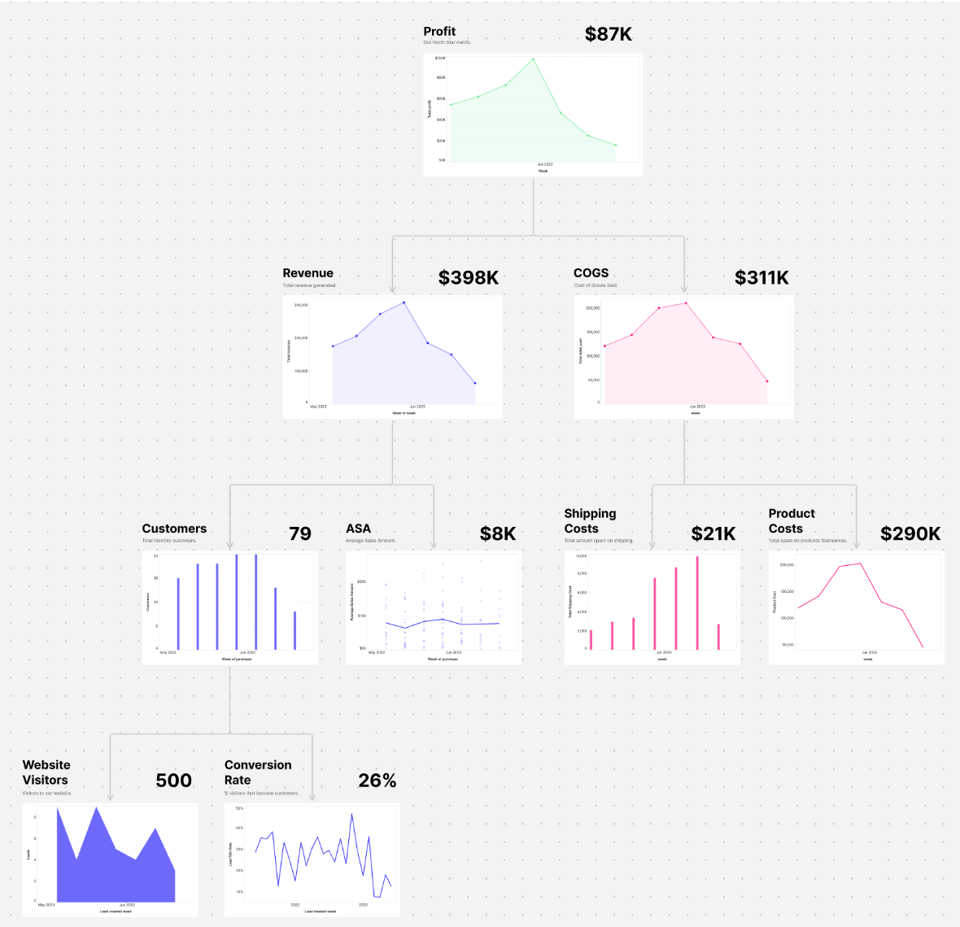
An Introduction to Metric Trees
Taylor Brownload (Count): "In a metric tree, each node represents a metric. Each metric contains a business definition, and a data definition (usually as a formula). You can include other info like the units, timeframe, and source systems as well."
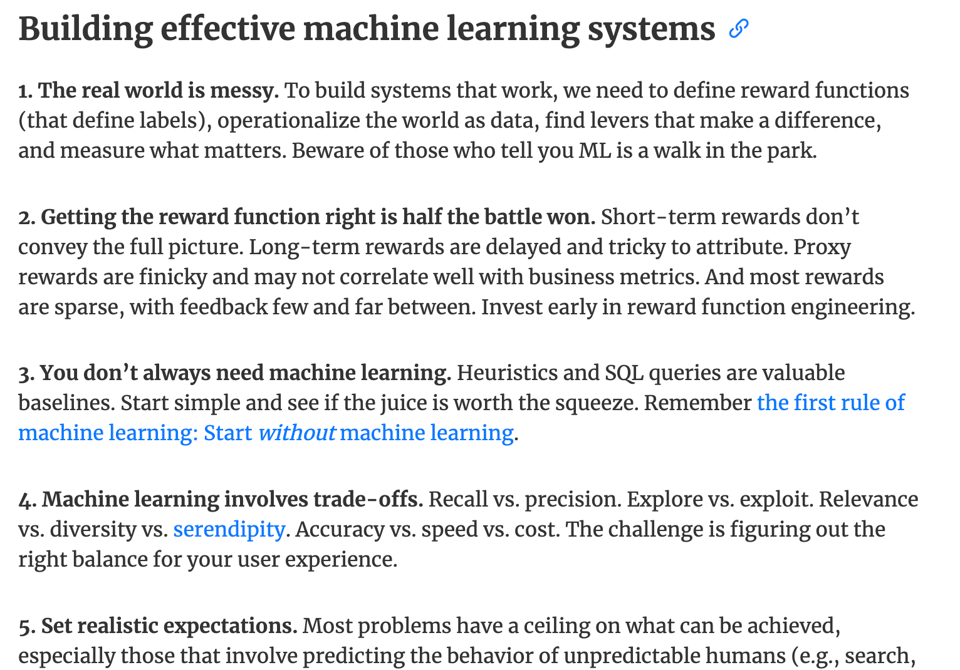
39 Lessons on Building ML Systems, Scaling, Execution, and More
Eugene Yan: "Here are my notes from ML conferences in 2024.". There's quite a few actionable ideas in here.
🤯 Data thinking
📈Dataviz, Data Analysis, & Interactive
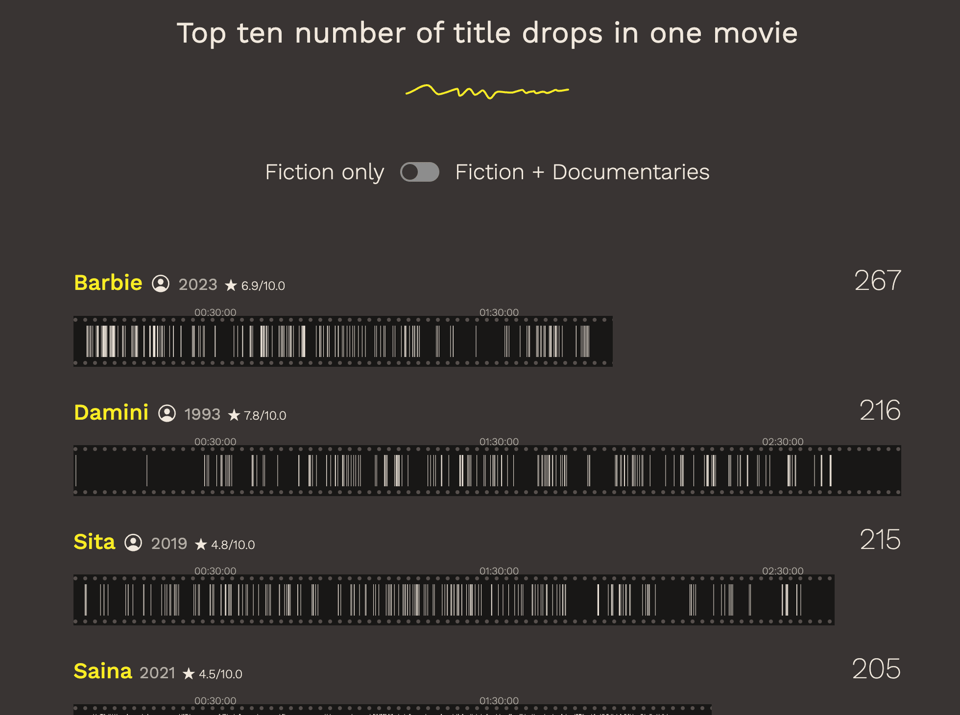
Full Of Themselves
Dominikus Baur and Alice Thudt present this amazing "analysis of title drops in movies".
"A title drop is when a character in a movie says the title of the movie they're in" – I've just realised that I have this obviously wrong memory that in the "Back to the Future" series the title was only ever mentioned at the end of the third film...
The website shows the results of the analysis of 73,931 movies, it's interactive, and shares all the data.
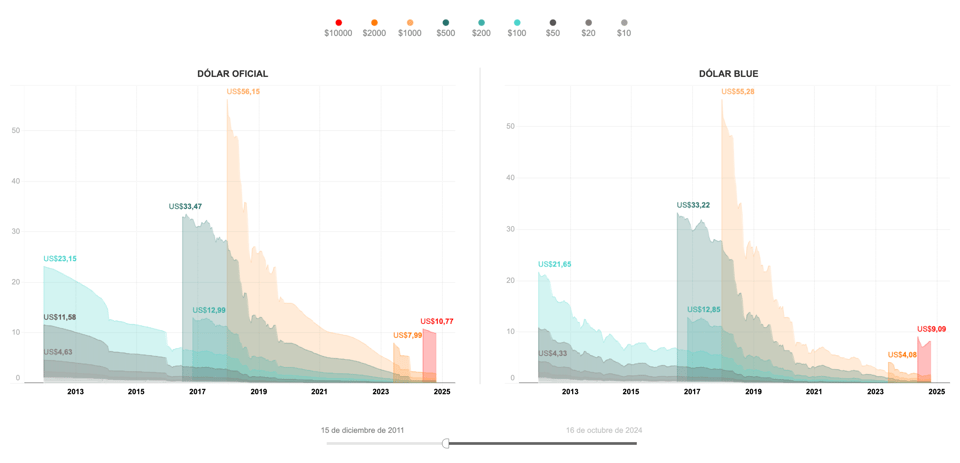
PESOS ARGENTINOS
"¿Cuántos billetes y monedas hay hoy en el país?"
Argentinian newspaper La Nacion looks at how many banknotes are incirculation in the hyperinflation-stricken country. For some reason, I can't get it to automatically translate, but a chart is worth 1000 words and there's quite a few on here.
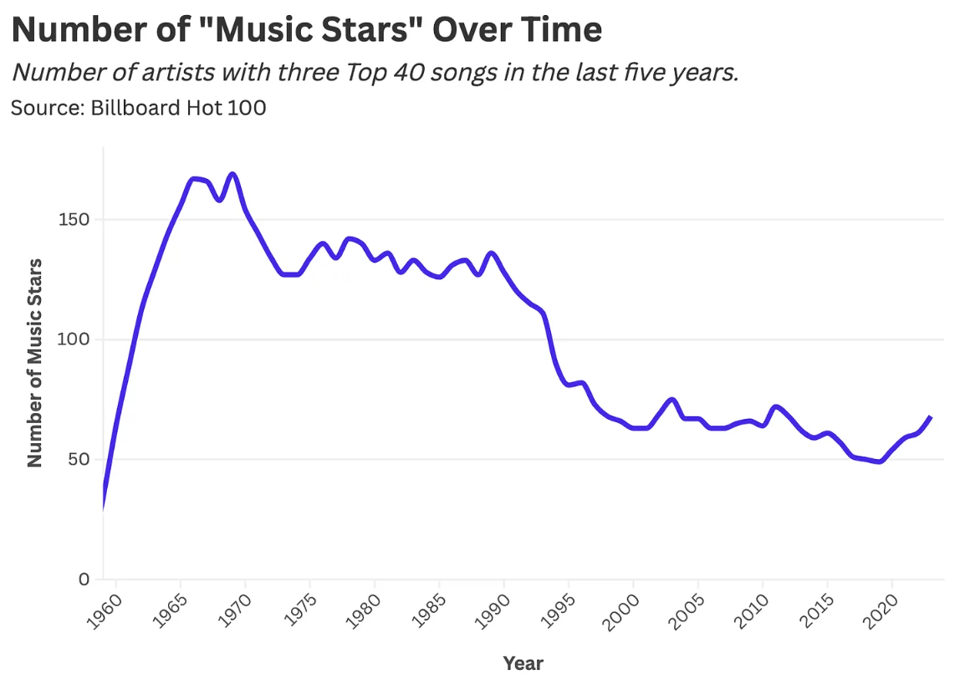
Is Music Stardom in Decline? A Statistical Analysis
Daniel Parris of Stat Significant asks: "Is music stardom dying?"
He follows an interesting approach where he gives a definition of "stardom" that can be traced in the data (and my talk at TRGCON talks extensively about the importance about being clear about the definition of concepts that we use in all forms of data processes).
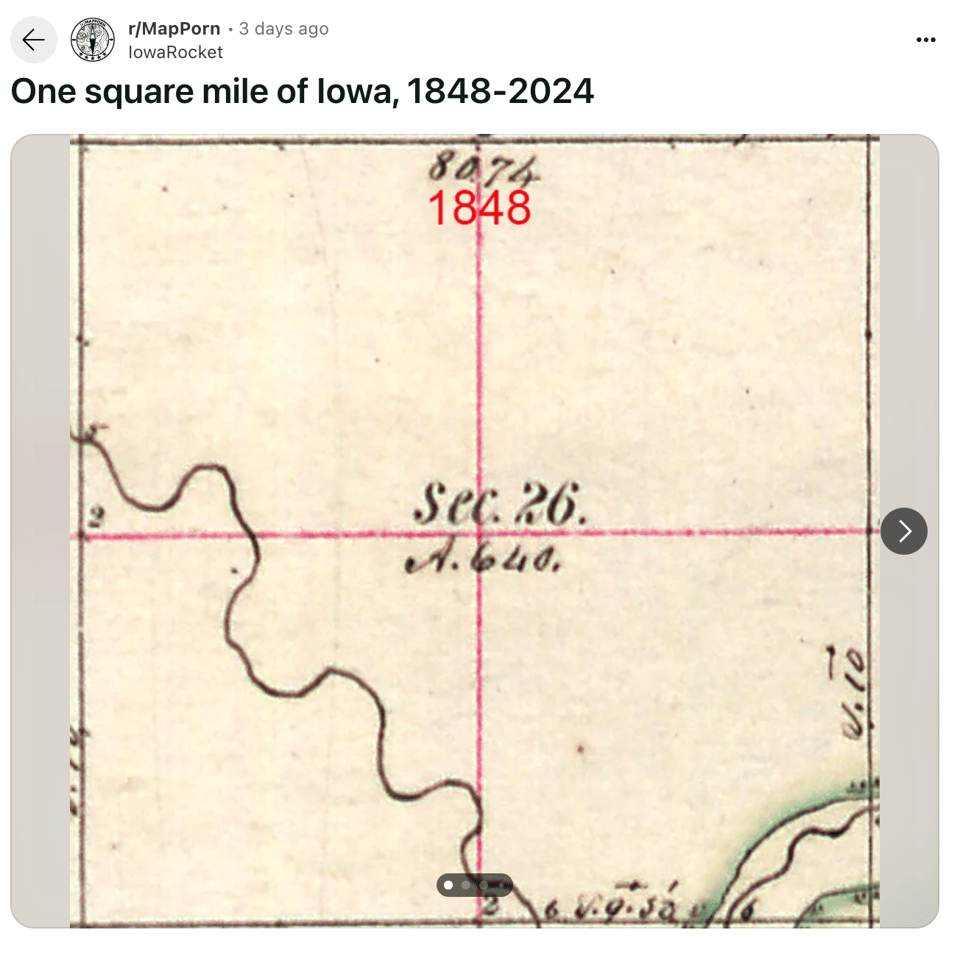
One square mile of Iowa, 1848-2024
With historical map and satellite views.
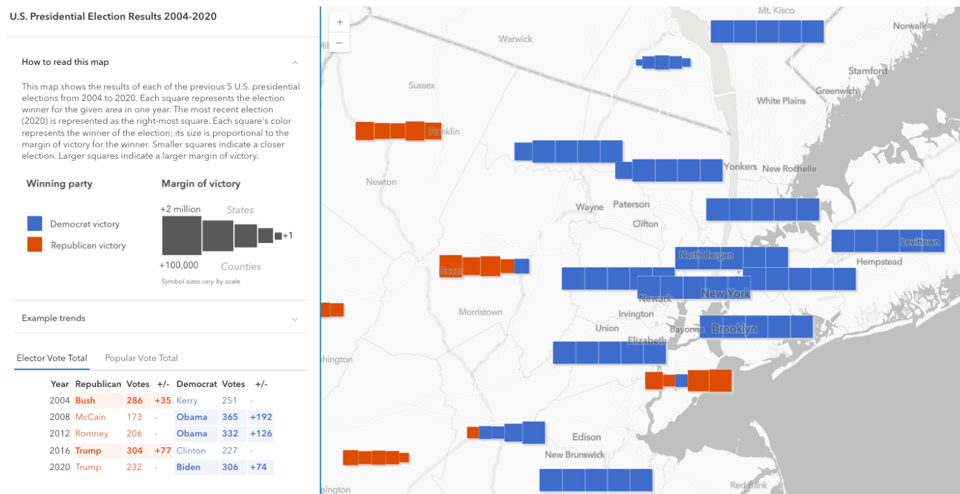
Visualize voting trends in 20 years’ worth of U.S. election data
Christian Ekenes (ESRI): "At the 2023 Esri Developer Summit, I demonstrated various ways to visualize data as it changed over time in this technical session. The session covered common approaches for visualizing change including animations, composite multivariate symbology, and small multiples. Many of these examples used election data to illustrate the advantages and disadvantages of each technique. After the session, an attendee approached me with an idea she had sketched on a piece of paper. The idea was to visualize the results of multiple elections using square symbols where each square represented the winner of an election using color. The sketch looked something like the following."
🤖 AI
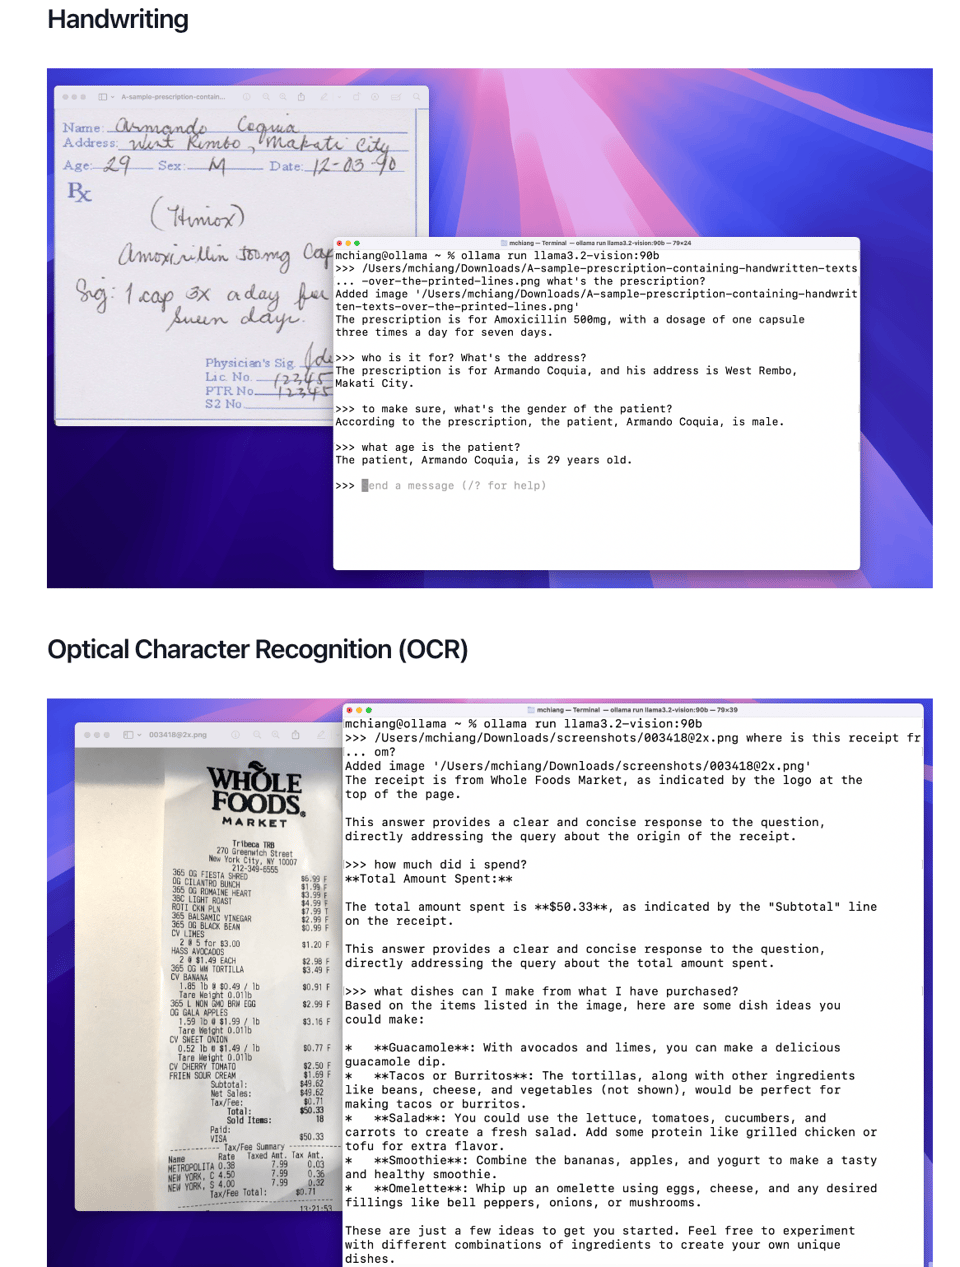
Ollama - Meta Llama 3.2 vision models (11B & 90B) are now available
These models are pretty interesting and open source. They can be used for a variety of tasks.
|
DID YOU LIKE THIS ISSUE>? → BUY ME A COFFEE! 
You're receiving this email because you subscribed to Quantum of Sollazzo, a weekly newsletter covering all things data, written by Giuseppe Sollazzo (@puntofisso). If you have a product or service to promote and want to support this newsletter, you can sponsor an issue. |
quantum of sollazzo is also supported by Andy Redwood’s proofreading – if you need high-quality copy editing or proofreading, check out Proof Red. Oh, and he also makes motion graphics animations about climate change.

Brain food, delivered daily
Every day we analyze thousands of articles and send you only the best, tailored to your interests. Loved by 505,869 curious minds. Subscribe.

