580: quantum of sollazzo
#580: quantum of sollazzo – 22 October 2024
The data newsletter by @puntofisso.

Hello, regular readers and welcome new ones :) This is Quantum of Sollazzo, the newsletter about all things data. I am Giuseppe Sollazzo, or @puntofisso. I've been sending this newsletter since 2012 to be a summary of all the articles with or about data that captured my attention over the previous week. The newsletter is and will always (well, for as long as I can keep going!) be free, but you're welcome to become a friend via the links below.
The most clicked link last week was Daniel Parris' excellent look at the Kevin Bacon number.
It's AMA o'clock!
Some of you have come to me suggesting this, so let's give it a try. AMA – Ask Me Anything by submitting a question via this anonymous Google form. If there are many questions, I'll select one each couple of weeks and answer it on here :-)
Don't be shy!

I'll put this advert on repeatedly as I'm collecting a few questions. I'll start answering them soon!
The Quantum of Sollazzo grove now has 15 trees. It helps managing this newsletter's carbon footprint. Check it out at Trees for Life.
'till next week,
Giuseppe @puntofisso
✨ Topical
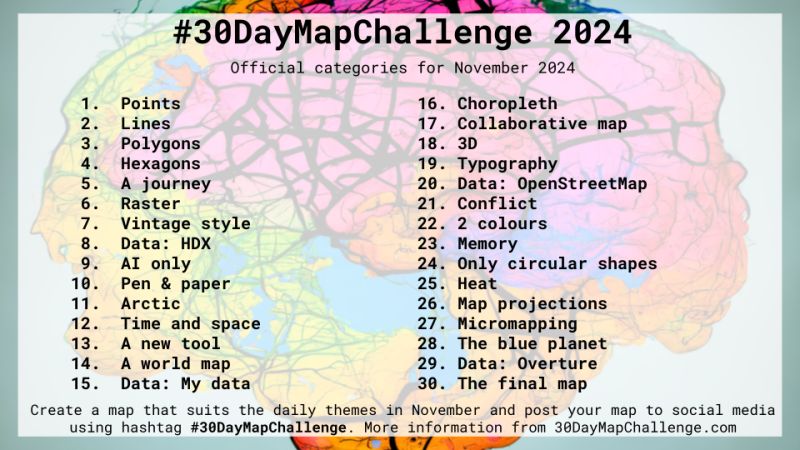
Topi Tjukanov launches 30 day map challenge 2025
As per usual tradition, geospatial visualization guru Topi Tjukanov has launched the 2025 edition of his much appreciated 30-day map challenge. Do it, and keep an eye on it.
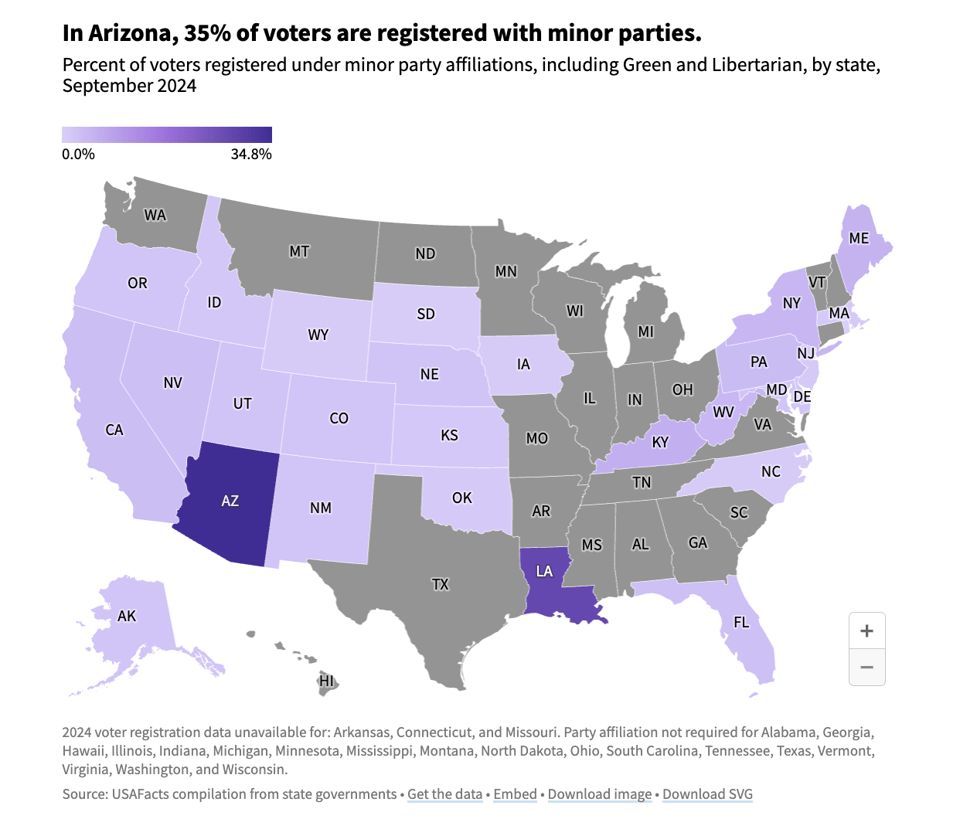
How many voters have a party affiliation?
USAFacts: "Of registered voters, 47% have declared a party affiliation. As of September 2024, 36 million voters are registered Republicans and 45.1 million are registered Democrats."
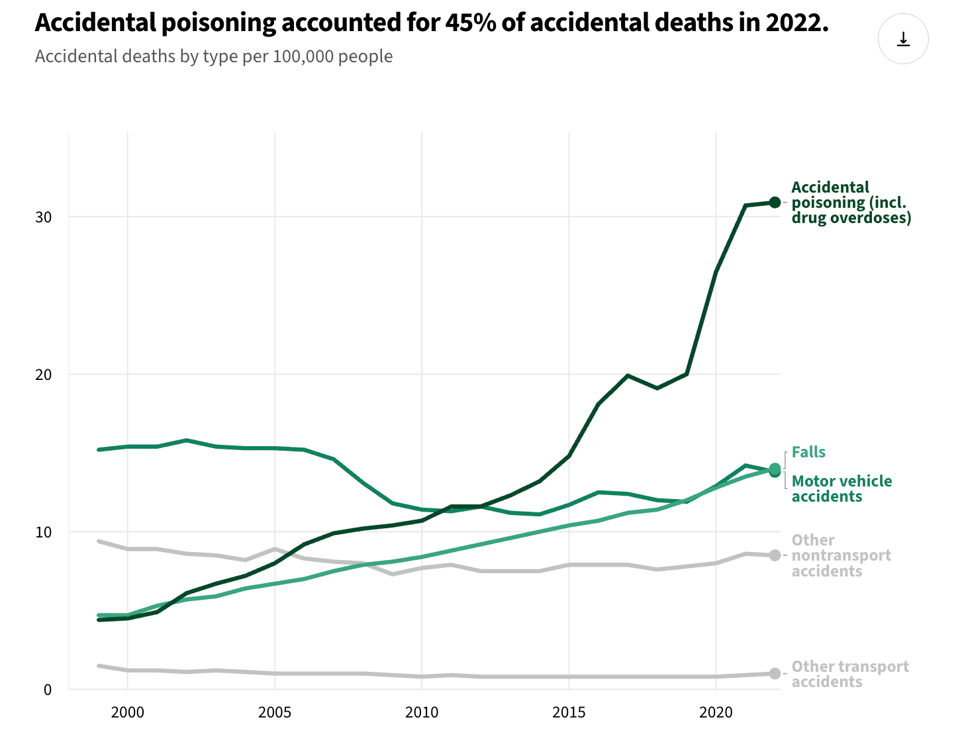
What are the leading causes of death in the US?
Another USAFacts article, mostly because of the mind-boggling chart below.
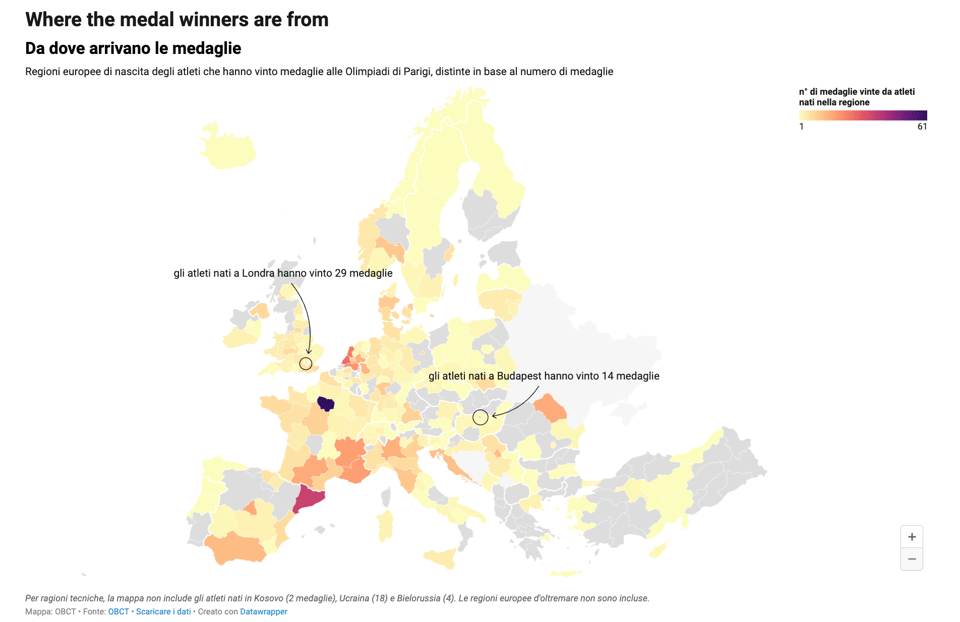
All the Paris Olympics medals won by South-East Europe, in data
"Water polo, combat sports, and men tended to dominate. But the data on the Paris Olympics also indicates some curious cases, from the Romanian female rowing team to Turkey's female athletes, as well as stories of migration."
Interesting chart below, with Catalunya and Ile-de-France being amazing outliers.
Join The Rest
Algorithms keep giving you more of the same. Our weekday newsletter is dedicated to the rest. A song and an interesting story about it, every weekday. Refreshing, insightful and snackable.

🛠️📖 Tools & Tutorials
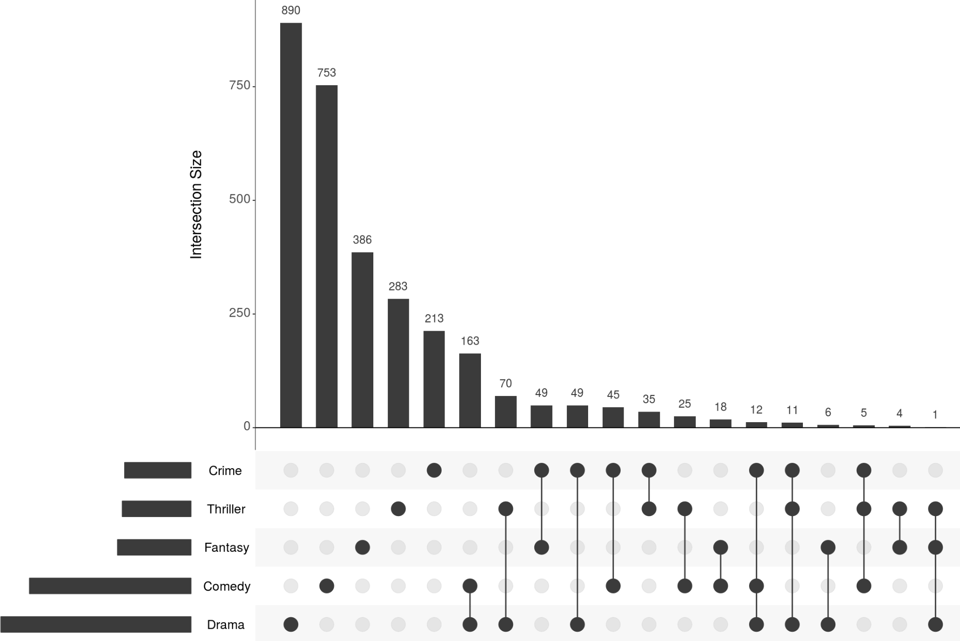
UpSet plots
I might have heard of them before, then forgot but this LinkedIn post allowed me to rediscover this incredibly useful chart type that captures intersections. Here is also a D3 version in Observable.
🤯 Data thinking
Veridical Data Science
"Rather than simply being a toolbox of algorithms (which is how many people think of “data science”), veridical data science spans the entire data science life cycle (DSLC)."
📈Dataviz, Data Analysis, & Interactive
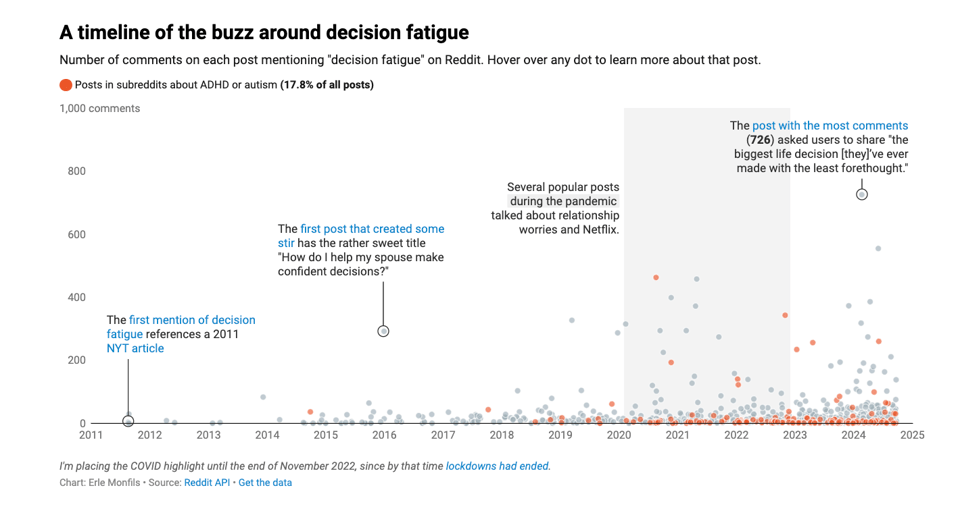
My first Weekly Chart… about what?!
Datawrapper's dataviz developer Erle Monfils: "I’m excited to share with you my first Weekly Chart, on a topic you might relate to: decision fatigue."
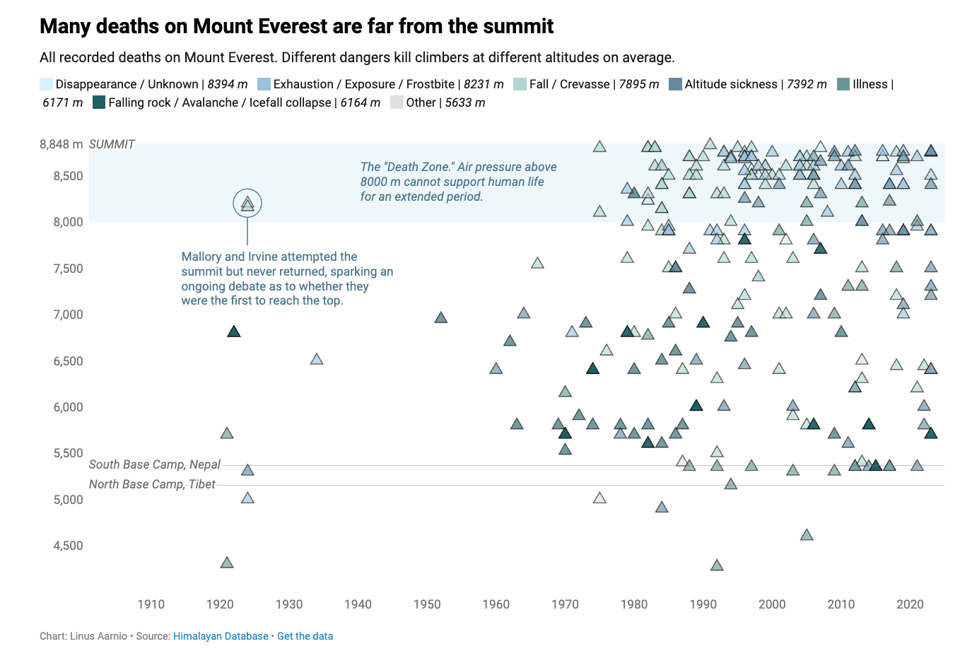
Into the Death Zone
Ok, let me link a second Datawrapper Weekly Chart! This time, developer Linus Aarnio looks at the dangers of Mount Everest.
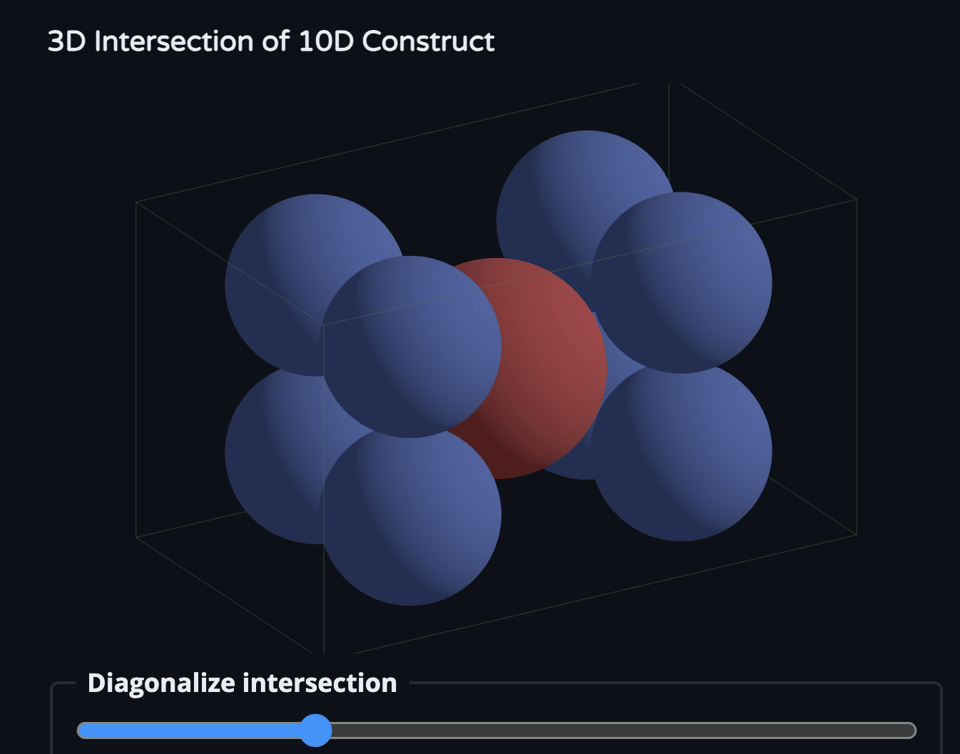
An n-ball Between n-balls
"There is a geometric thought experiment that is often used to demonstrate the counterintuitive shape of high-dimensional phenomena. This article is an interactive visual journey into the construct in the thought experiment, and the mathematics behind it."
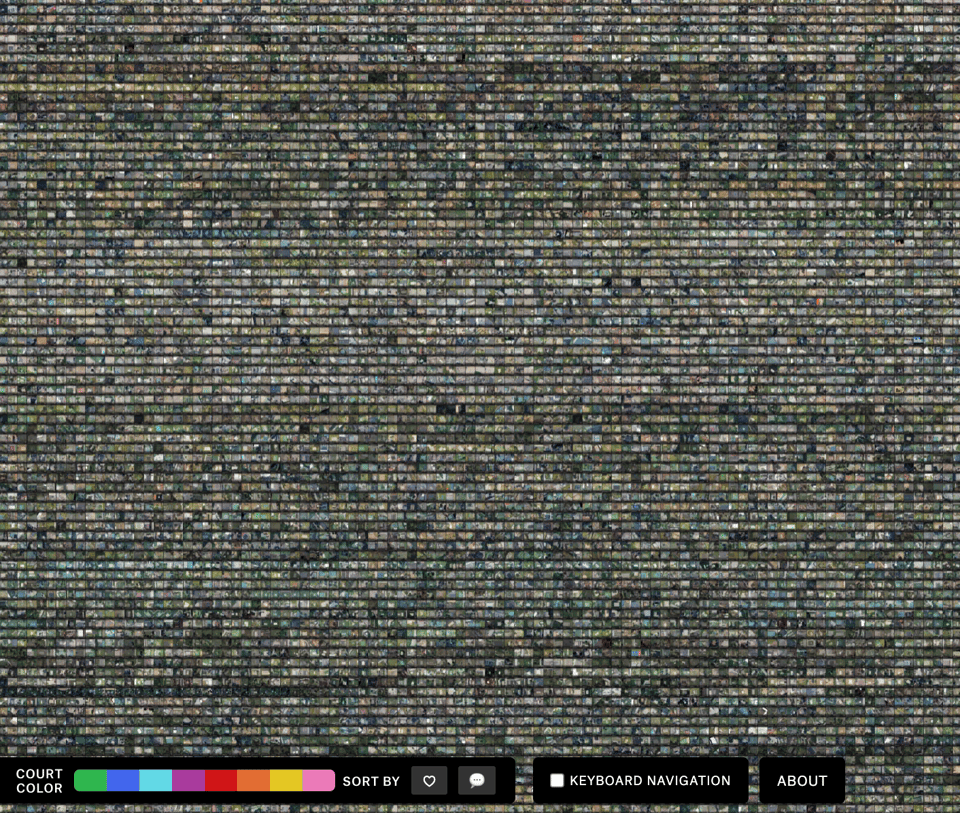
Every Outdoor Basketball Court in the U.S.A.
The Pudding: "Help us document the stories behind the 59,507 outdoor courts in America."
Also take a look at this (unrelated) Pudding article about baseball, though.
🤖 AI
My commons roller coaster / 2024-10-10
Luis Villa's regular newsletter/blog, last week, opened with this intriguing sentence: "This week an open data set won the Nobel Prize in chemistry".
Machines of Loving Grace
Dario Amodei (Anthropic's CEO): "How AI Could Transform the World for the Better".
|
DID YOU LIKE THIS ISSUE>? → BUY ME A COFFEE! 
You're receiving this email because you subscribed to Quantum of Sollazzo, a weekly newsletter covering all things data, written by Giuseppe Sollazzo (@puntofisso). If you have a product or service to promote and want to support this newsletter, you can sponsor an issue. |
quantum of sollazzo is also supported by Andy Redwood’s proofreading – if you need high-quality copy editing or proofreading, check out Proof Red. Oh, and he also makes motion graphics animations about climate change.
