577: quantum of sollazzo
#577: quantum of sollazzo – 24 September 2024
The data newsletter by @puntofisso.

Hello, regular readers and welcome new ones :) This is Quantum of Sollazzo, the newsletter about all things data. I am Giuseppe Sollazzo, or @puntofisso. I've been sending this newsletter since 2012 to be a summary of all the articles with or about data that captured my attention over the previous week. The newsletter is and will always (well, for as long as I can keep going!) be free, but you're welcome to become a friend via the links below.
The most clicked link last week was the Atlas of Intangibles.
The Quantum of Sollazzo grove now has 15 trees. It helps managing this newsletter's carbon footprint. Check it out at Trees for Life and feel free to add trees to it.
'till next week,
Giuseppe @puntofisso
✨ Topical
Yes Prime Minister, questionnaire design matters
They did it for real!
"An Ipsos poll asking the same series of questions asked in the BBC comedy series Yes Prime Minister, series 1, episode 2, "The Ministerial Broadcast" as posed by Sir Humphrey Appleby to Bernard Woolley." The findings are interesting: "You can see that it is indeed true that you get different results on the level of support for the reintroduction of national service based on the way you ask the question and the questions you ask before it.".
Also: see this pre-print: "Response to a poll can be manipulated by means of a series of leading questions. We show that such phenomena cannot be explained by use of classical probability theory, whereas quantum probability theory admits a possibility of offering an explanation."
(via Daniele Marinazzo)

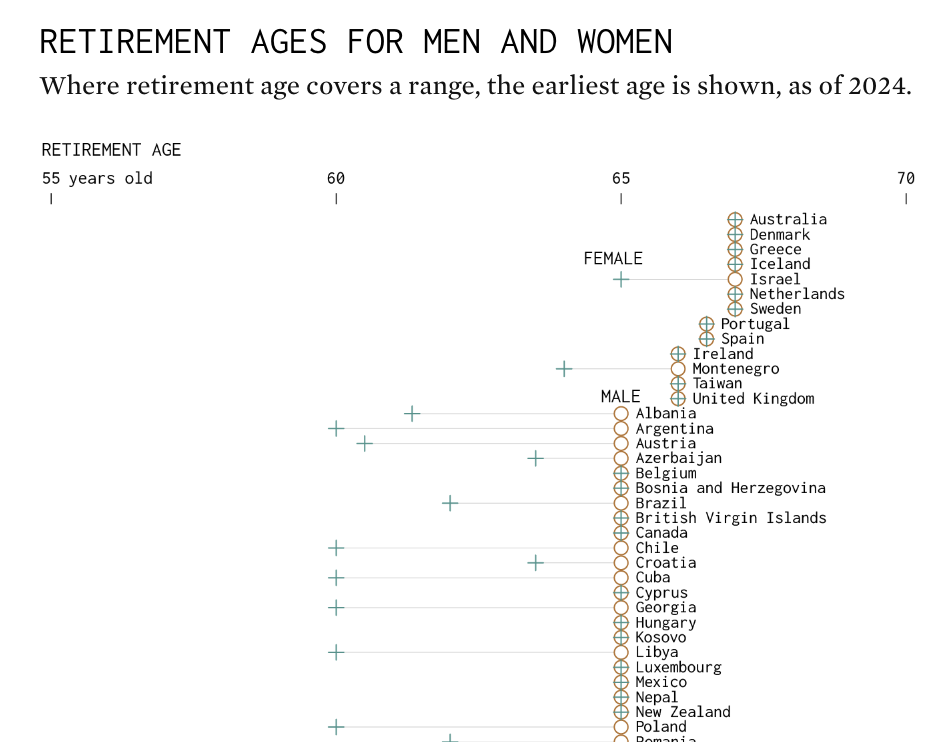
Retirement ages by country
Flowing data takes a look at retirement ages.
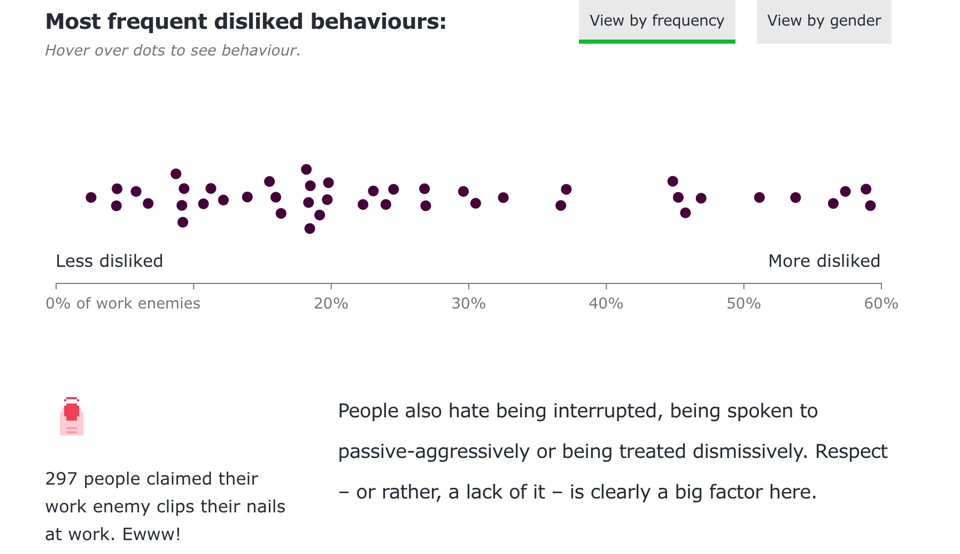
The world of… work enemies
"They pinch our desk snacks. Talk over us in meetings. Sometimes they even stand in the way of our career progression. A new Totaljobs survey found that 6 in 10 UK workers feel they have a ‘work enemy’. So why do our working relationships turn sour? How does this affect us? And what can we do to put things right?"
Brilliant dataviz essay by Beyond Words Studio for TotalJobs.
🛠️📖 Tools & Tutorials
Dataviz Project Boilerplate
A handy GitHub repository by dataviz guru Yan Holtz. His From Data to Viz website, which includes the decision tree below, is also pretty cool.

Code review for statisticians, data scientists & modellers
"Software developers have some really good approaches to code review. Here’s a data scientist’s plea to listen to the software developers!".
Written by fellow civil servant an UKHSA Senior Data Scientist Jack Kennedy.
20 Super Useful CSS Animation Libraries
"A hand-picked collection of the best 20 CSS animations curated from various sources around the web. Most of them will generate pure CSS code without requiring any external libraries."
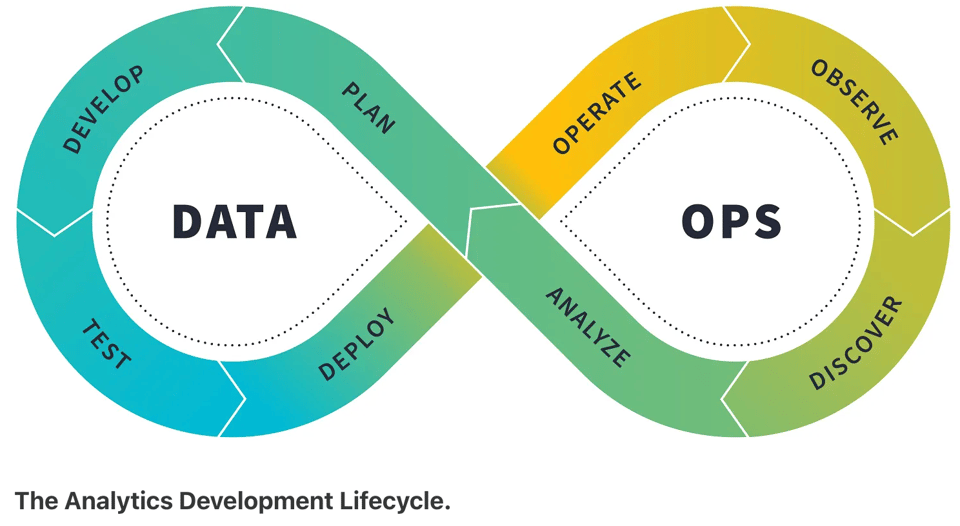
Announcing: The Analytics Development Lifecycle (ADLC)
"... we propose a specific workflow designed to accelerate data velocity while improving data maturity: the Analytics Development Lifecycle (ADLC). We believe that implementing the ADLC is the best path to building a mature analytics practice within an organization of any size."
A useful tutorial/whitepaper.
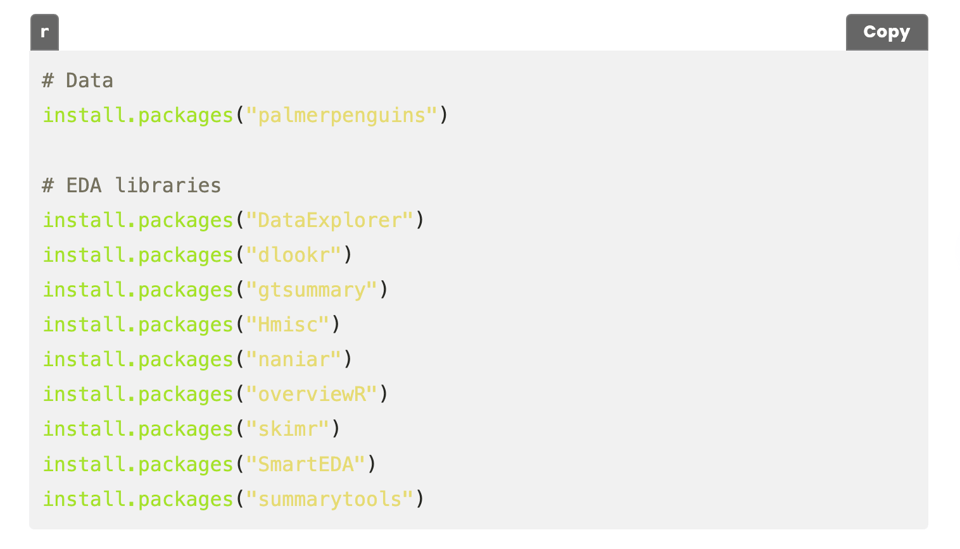
Exploratory Data Analysis tutorials...
...in Python and R, written by the same author.
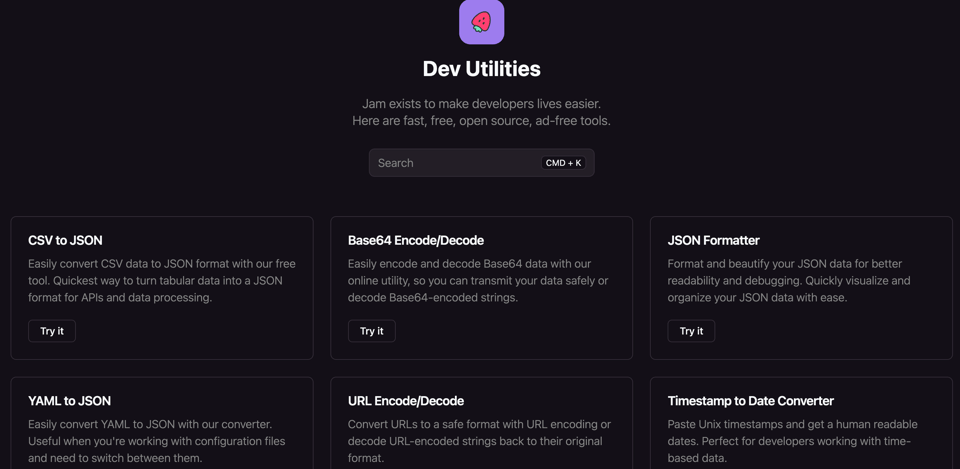
Dev Utilities
"Jam exists to make developers lives easier. Here are fast, free, open source, ad-free tools."
Some of them cover niche uses. It could be useful to many on this list.
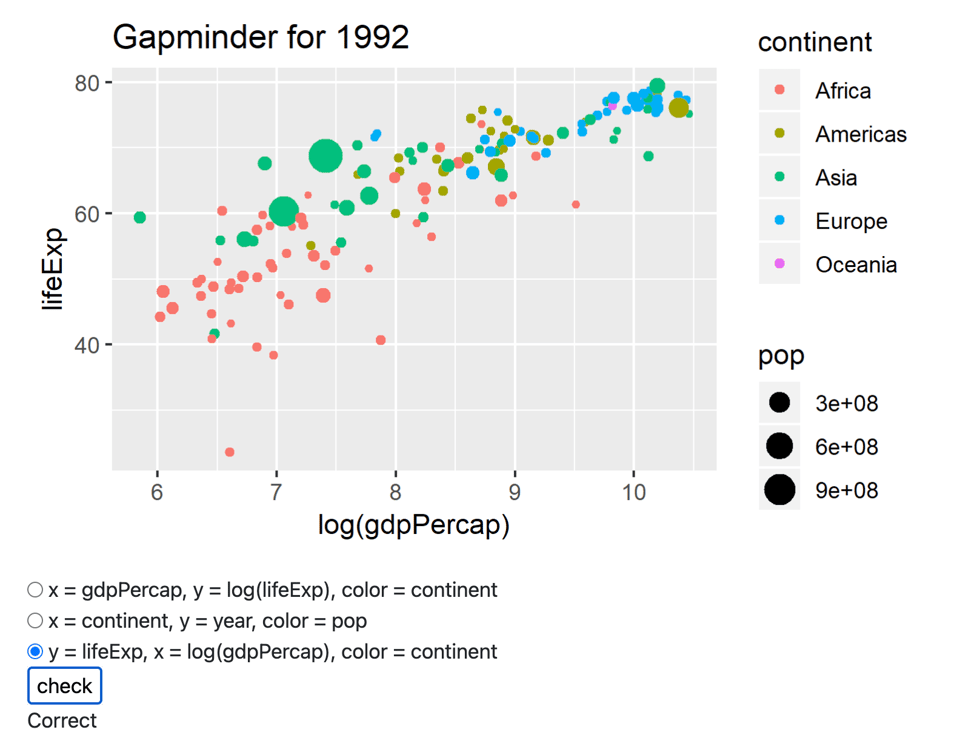
R Bootcamp
Another tutorial: "Learn to clean and visualize data." Using webr in order to allow the user to interact with the code in the browser.
Brain food, delivered daily
Every day we analyze thousands of articles and send you only the best, tailored to your interests. Loved by 505,869 curious minds. Subscribe.

📈Dataviz, Data Analysis, & Interactive
How to date a recording using background electrical noise
Rather geeky and tangentially data, but really worth a read, by Robert Heaton. The key concept to understand is that the mains electricity, which provides AC – Alternate Current – alternates between different voltages at a given frequency. While this is usually reported as 50 Hz, it is in fact oscillating between different frequencies in an established pattern which varies from time to time. This can give a hint as to when a recording was made, if it did capture the "hum" of electric interference. Source code is also provided here.
Oh, and by the way, Fourier Transforms are an amazing tool.
(via Guy Lipman)
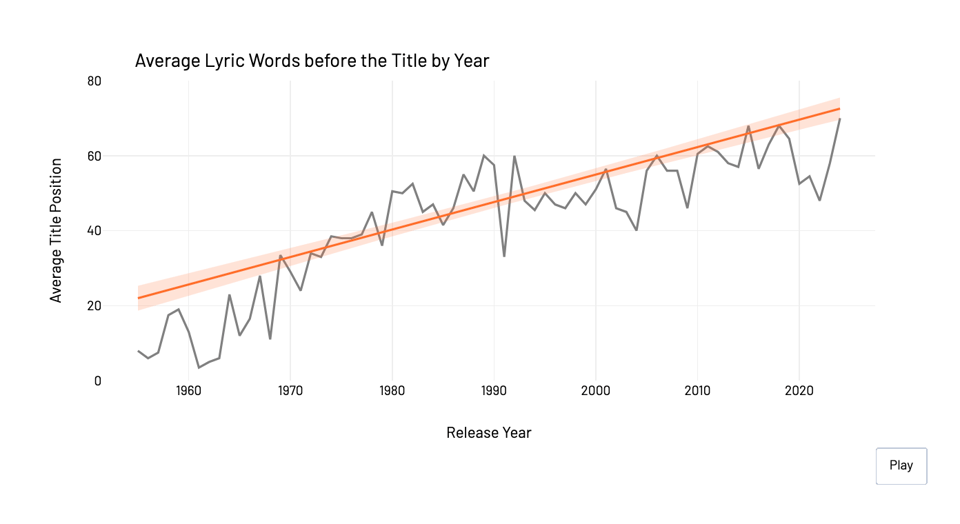
Hey Jude, do song titles show up later than they used to?
Well, yes. The phrase "Hey Jude" appears in the first verse of the song "Hey Jude". Compare it with, say, "Back to Black".
(via Alex Wrottesley)
Square Deal: London’s property costs per square foot
Slightly outdated variation on the London tube map, but a new reflection on this is that I love that it uses a recognisable visualization that, while not a standard way to display data statistically, is immediately understandable and recognisable.
(via Peter Wood)

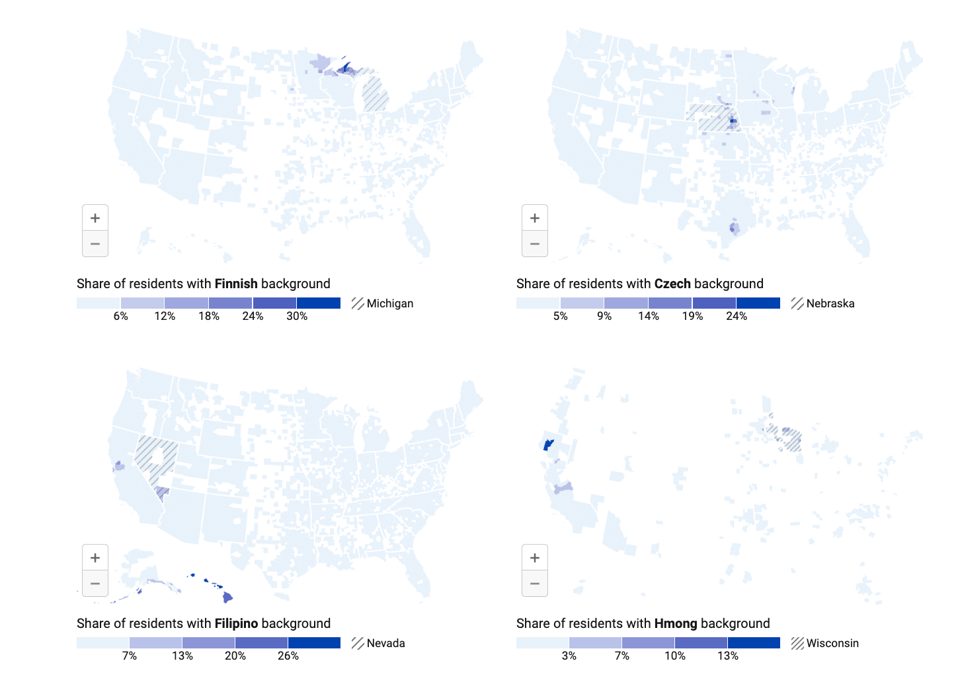
Poles (and others) at the polls in Pennsylvania
Rose Mintzer-Sweeney of Datawrapper: "Playing to ethnic blocs is a time-honored move in U.S. politics, and the issues can be very real."
🤖 AI
Durably reducing conspiracy beliefs through dialogues with AI
Science: "Costello et al. investigated whether dialogs with a generative artificial intelligence (AI) interface could convince people to abandon their conspiratorial beliefs."
Have we finally found a good use for LLMs?
The state of open AI
A slide deck about recent advances of open AI (NO, not Open AI).
|
DID YOU LIKE THIS ISSUE>? → BUY ME A COFFEE! 
You're receiving this email because you subscribed to Quantum of Sollazzo, a weekly newsletter covering all things data, written by Giuseppe Sollazzo (@puntofisso). If you have a product or service to promote and want to support this newsletter, you can sponsor an issue. |
quantum of sollazzo is also supported by Andy Redwood’s proofreading – if you need high-quality copy editing or proofreading, check out Proof Red. Oh, and he also makes motion graphics animations about climate change.
