576: quantum of sollazzo
#576: quantum of sollazzo – 17 Sep 2024
The data newsletter by @puntofisso.

Hello, regular readers and welcome new ones :) This is Quantum of Sollazzo, the newsletter about all things data. I am Giuseppe Sollazzo, or @puntofisso. I've been sending this newsletter since 2012 to be a summary of all the articles with or about data that captured my attention over the previous week. The newsletter is and will always (well, for as long as I can keep going!) be free, but you're welcome to become a friend via the links below.
The most clicked link last week was a PDF! This Research Briefing from the House of Commons about Indoor Air Quality.
The Quantum of Sollazzo grove now has 15 trees. It helps managing this newsletter's carbon footprint. Check it out at Trees for Life.
'till next week,
Giuseppe @puntofisso
✨ Topical
What are the top energy production sources in the US?
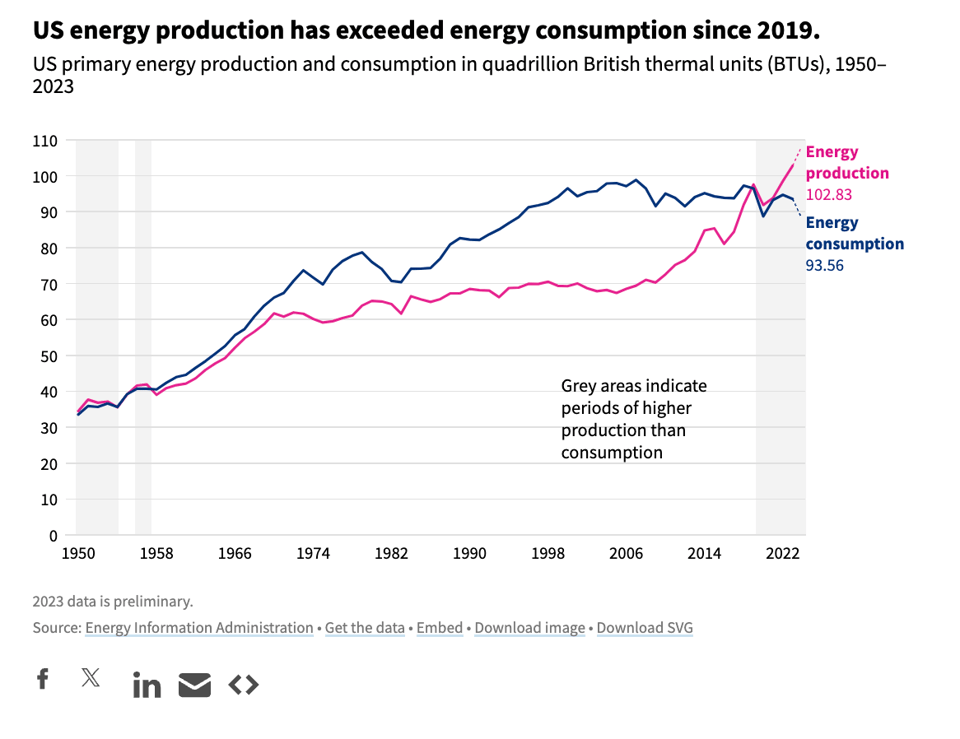
"Three quarters of US energy production is from fossil fuels, and one quarter is from renewable energy, nuclear energy, and natural gas plant liquids."
Typically great data analysis from USAFacts, which include the interesting chart below – it's only the third time in about 70 years that US energy production has surpassed consumption.
Buildings wrapped in solid gasoline
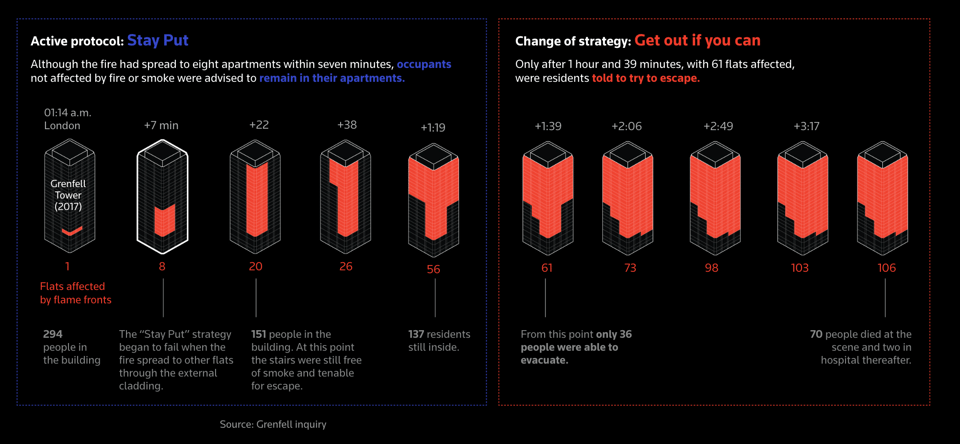
This is a highly visual take on dangerous cladding, by Reuters: "Despite scores of deaths, building codes in many countries don’t require the removal of flammable polymers from cladding".
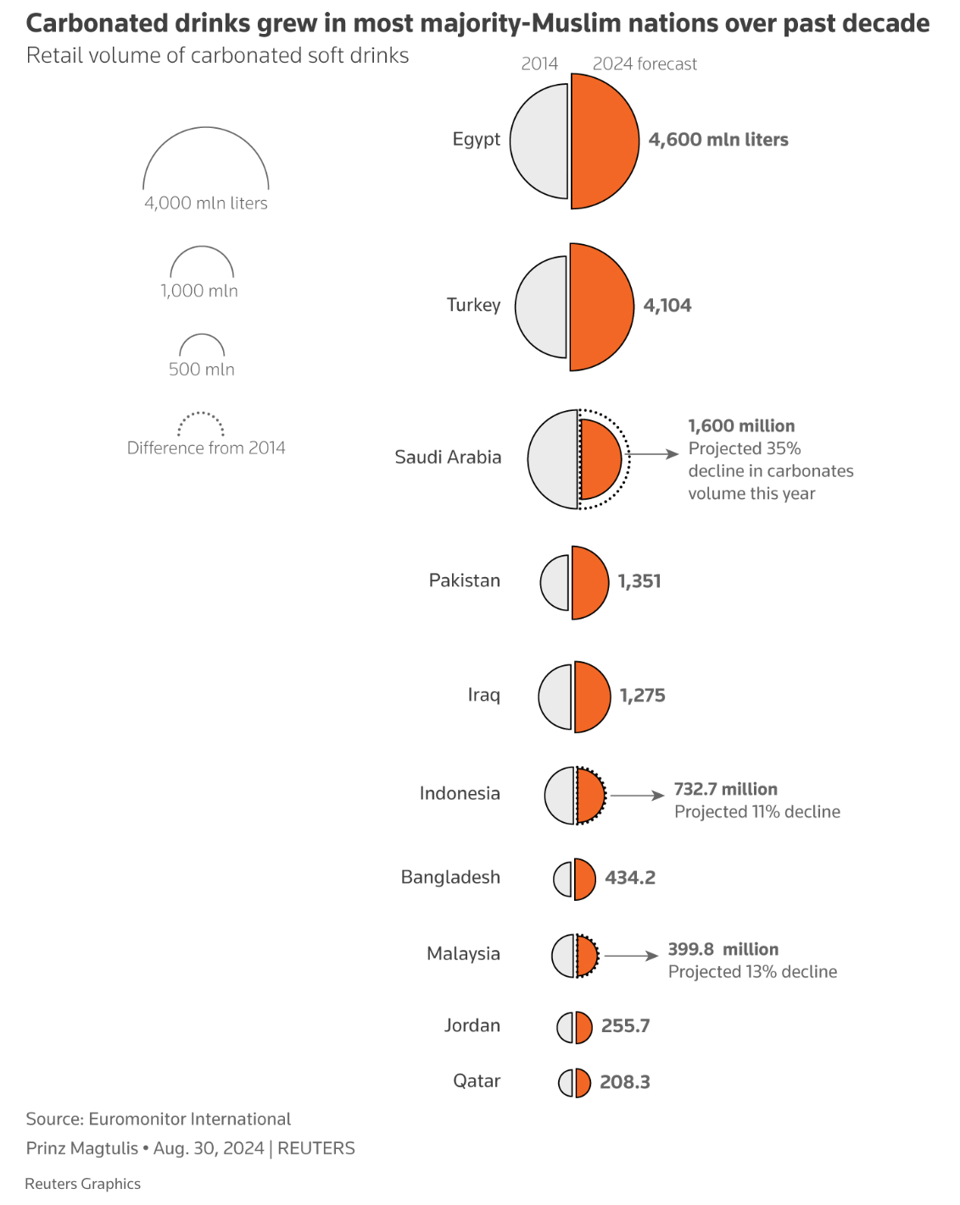
Coke and Pepsi boycott over Gaza lifts Muslim countries' local sodas
"Coca-Cola (KO.N), and rival PepsiCo (PEP.O), spent hundreds of millions of dollars over decades building demand for their soft drinks in Muslim-majority countries including Egypt to Pakistan.
Now, both face a challenge from local sodas in those countries due to consumer boycotts that target the globe-straddling brands as symbols of America, and by extension Israel, at a time of war in Gaza."
Brain food, delivered daily
Every day we analyze thousands of articles and send you only the best, tailored to your interests. Loved by 505,869 curious minds. Subscribe.

🛠️📖 Tools & Tutorials
Exploring Complex Survey Data Analysis Using R
"A Tidy Introduction with {srvyr} and {survey}."
A full book, with exercises and solutions.
Tetris-SQL
"A complete implementation of Tetris in a SQL query."
Fairly useless, obviously, but it does show the expressive power of SQL so it could help people to learn some advanced concepts.

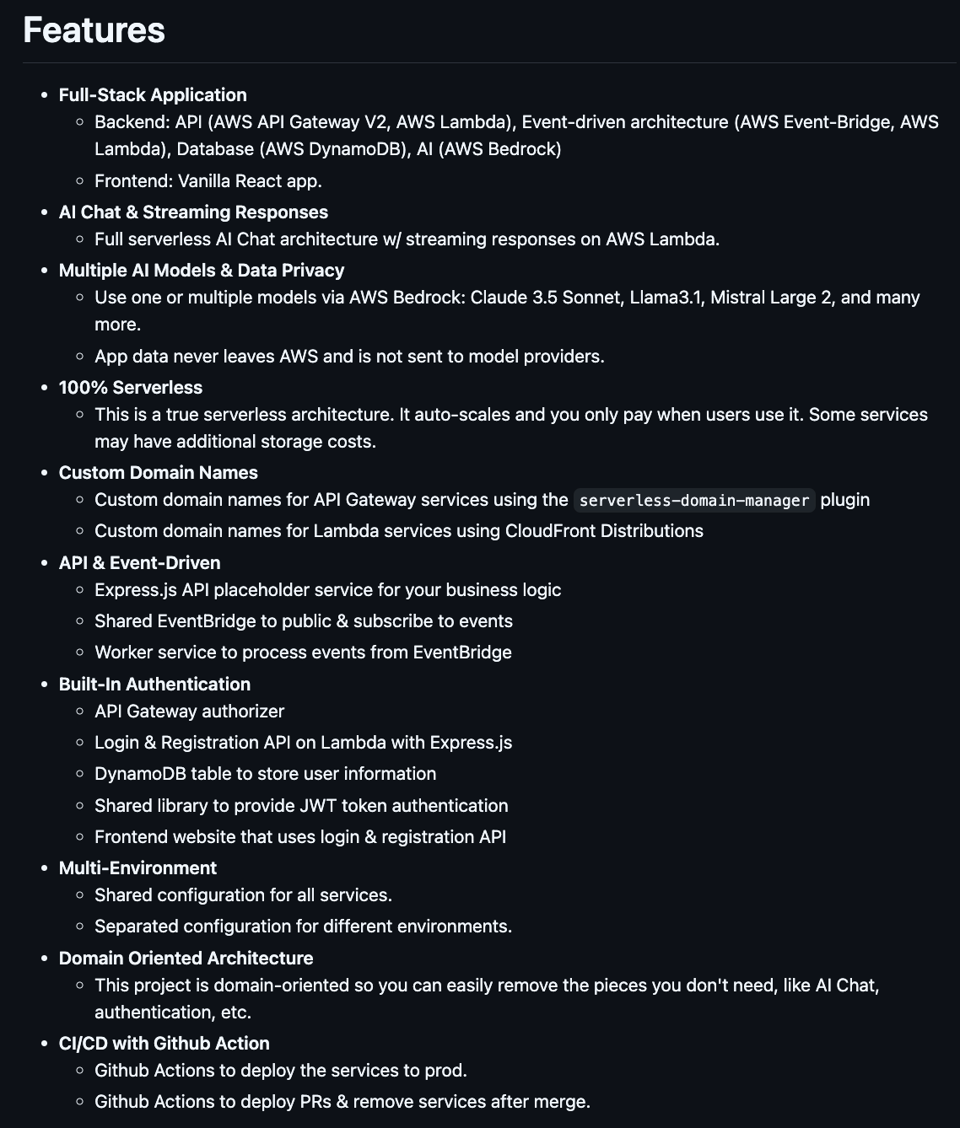
AWS AI Stack
"A ready-to-use, full-stack boilerplate project for building serverless AI applications on AWS."
essentia.js
"Essentia.js is a JavaScript (JS) library for music/audio signal analysis and processing developed at the Music Technology Group, UPF, Barcelona. The core of the library is powered by Essentia C++ library back-end using WebAssembly built via Emscripten along with a high-level JS and TypeScript API and add-on utility modules. ie, You can run an extensive collection of music/audio processing and analysis algorithms/models on your web browser or Node.js runtime applications. It supports both real-time and offline audio analysis use-cases."
🤯 Data thinking
Mastering Dashboard Design: From Good to Unmissable Data Visualizations
"If you’ve ever struggled with deciphering complex data reports or wading through an endless sea of charts, you know the frustration of working with poorly designed dashboards. A well-crafted dashboard should simplify your work, not complicate it."
Timely Advice: How Long Does Dataviz Take?
"Visualizing 3iap timesheets for 10 dataviz client projects. How much time goes into researching, data-wrangling, designing, and building different types of data visualizations?"

📈Dataviz, Data Analysis, & Interactive
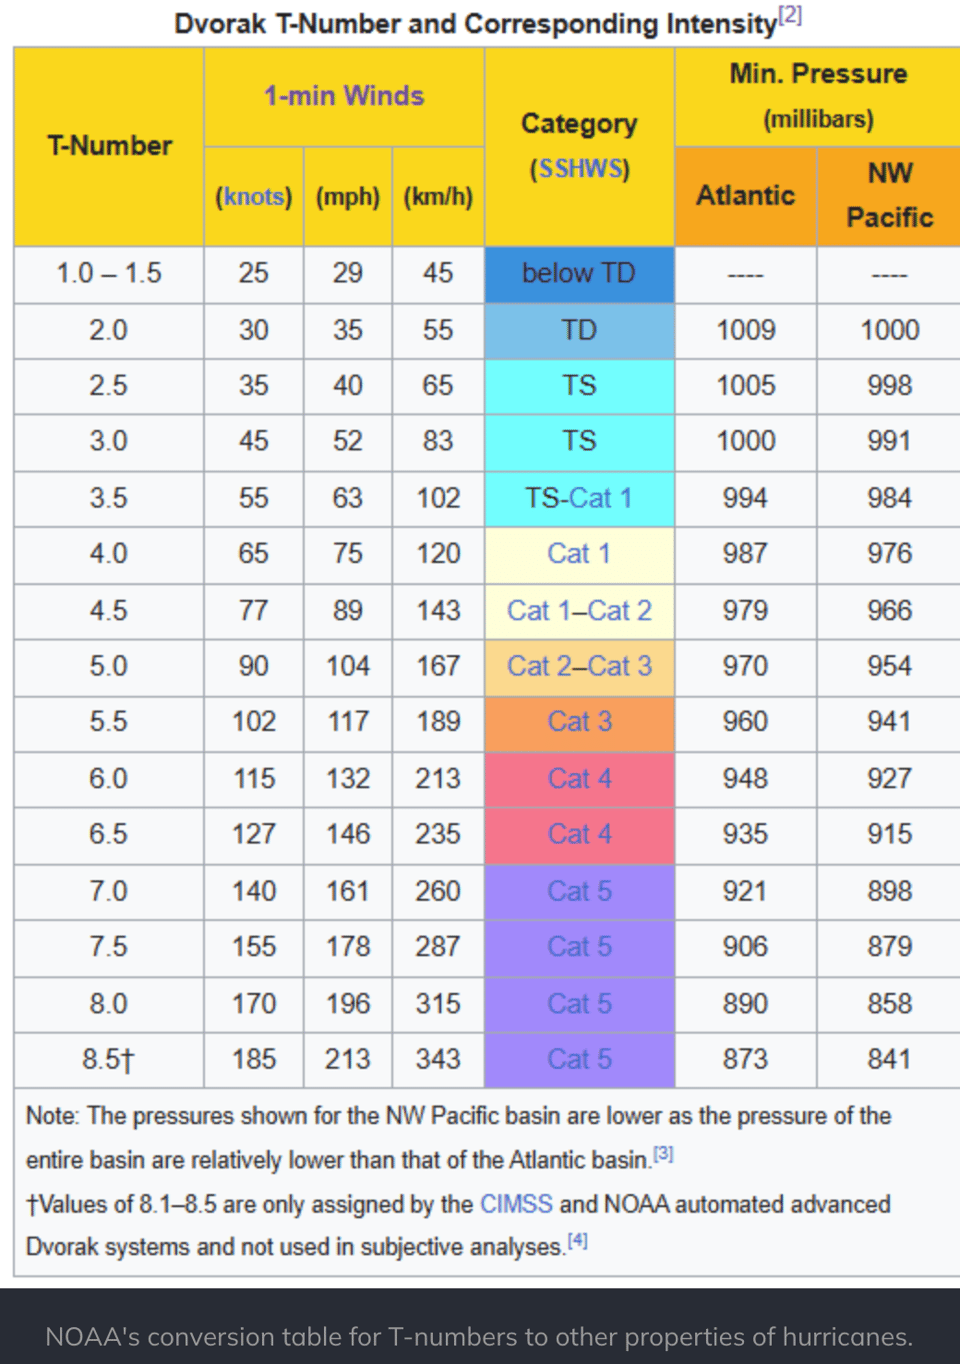
Peculiar measurements: Accumulated Cyclone Energy
"Meteorologists have a curious little metric called "accumulated cyclone energy" that they use to compare hurricanes and entire hurricane seasons. This is a dive into what that's about."
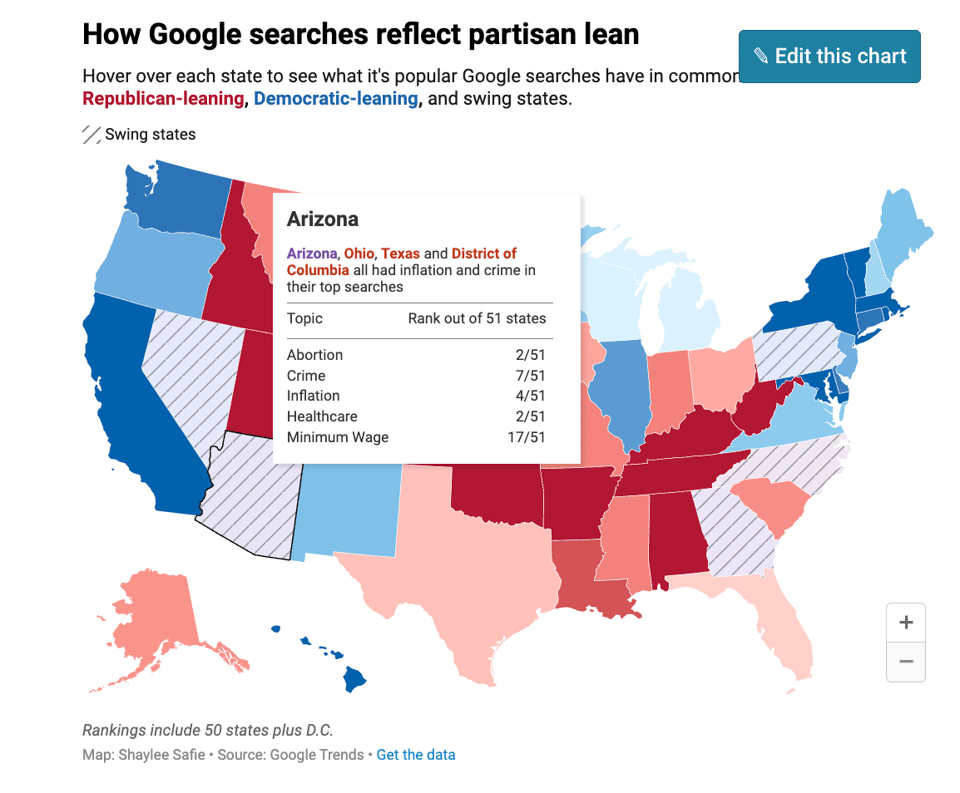
Google searching for election outcomes
Datawrapper's Shaylee Safie looks at a different approach to simulating elections: "one way to guess what voters are thinking is to look at the topics they search for online. Are red and blue states googling the same topics, or are they thinking about totally different issues? Do swing states follow any patterns, and if so, can we use them to predict election outcomes?".
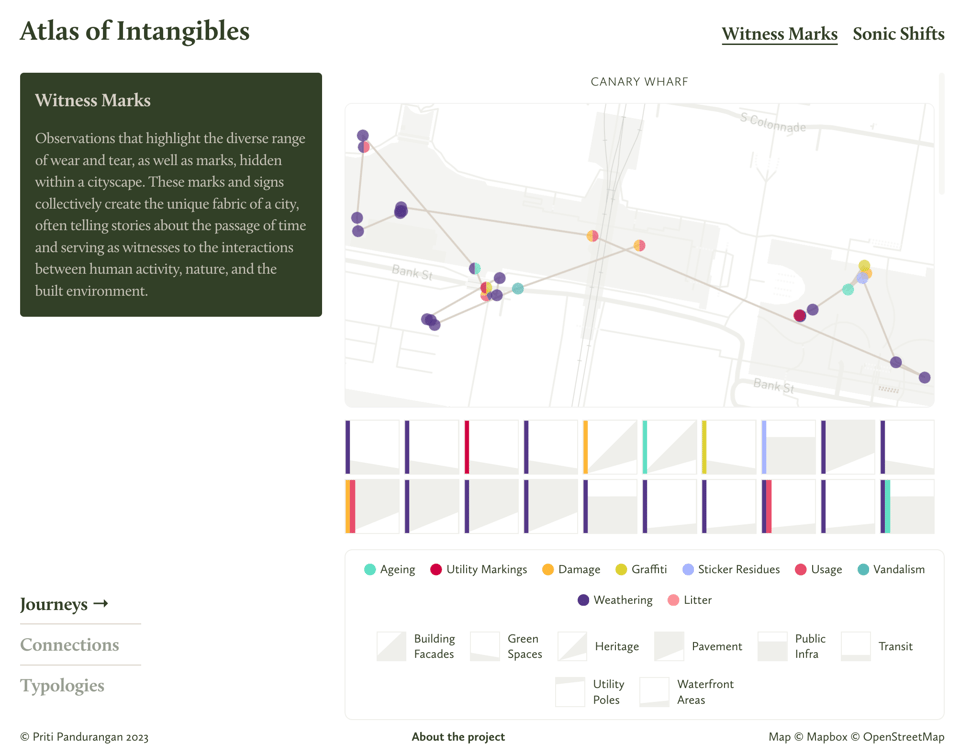
Atlas of Intangibles
"Atlas of Intangibles is a data experience designed to highlight the rich, interconnected web of sensory information that lies beneath our everyday encounters. Showcasing sensory data collected by me around the city of London through score-based data walks, the digital experience allows viewers to choose specific themes and explore related data as views — journeys, connections, and typologies. Each data point is rich in context, encompassing images and audio recordings."
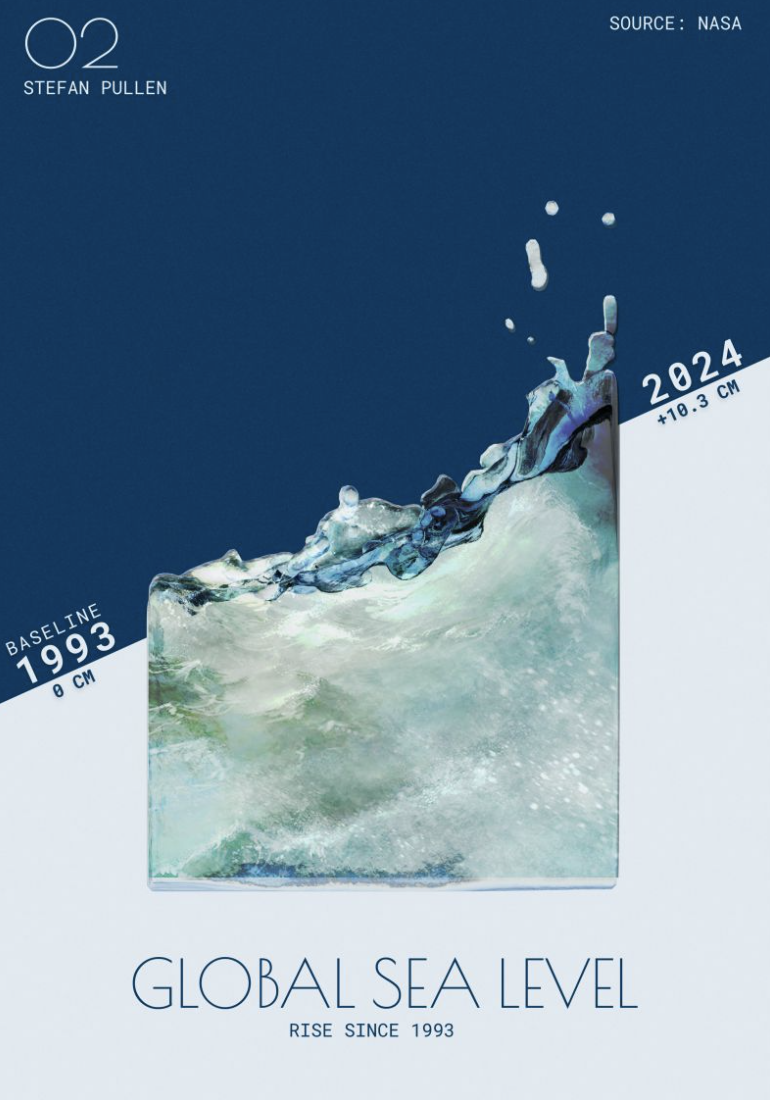
Sea Rise
An artistic take on visualizing sea levels rise.
🤖 AI
“Model collapse” threatens to kill progress on generative AIs
As the byline eloquently puts it: "When AI eats its own product, it gets sick". This refers to the issue of training models on synthetic data or data that was itself generated by AI. There are weird effects, and we have to be really careful about these because, beyond the novelty value of hallucinating pictures, this could have real impacts.
|
DID YOU LIKE THIS ISSUE>? → BUY ME A COFFEE! 
You're receiving this email because you subscribed to Quantum of Sollazzo, a weekly newsletter covering all things data, written by Giuseppe Sollazzo (@puntofisso). If you have a product or service to promote and want to support this newsletter, you can sponsor an issue. |
quantum of sollazzo is also supported by Andy Redwood’s proofreading – if you need high-quality
copy editing or proofreading, check out Proof Red. Oh, and he also makes motion graphics animations about climate change.
