573: quantum of sollazzo
#573: quantum of sollazzo – 6 Aug 2024
The data newsletter by @puntofisso.

Hello, regular readers and welcome new ones :) This is Quantum of Sollazzo, the newsletter about all things data. I am Giuseppe Sollazzo, or @puntofisso. I've been sending this newsletter since 2012 to be a summary of all the articles with or about data that captured my attention over the previous week. The newsletter is and will always (well, for as long as I can keep going!) be free, but you're welcome to become a friend via the links below.
The most clicked link last week was to my incomparable friend and nemesis Soph Warnes' Fair Warning newsletter. If you like my newsletter, you should definitely subscribe to hers too.
The Quantum of Sollazzo grove now has 15 trees. It helps managing this newsletter's carbon footprint. Check it out at Trees for Life.
Following this issue, I'm going to take a short hiatus until the end of August :)
Quantum's next issue will reach you on August 27th.
'till next week,
Giuseppe @puntofisso
✨ Topical
America’s news deserts are growing
"Most counties in the U.S. have only one local newspaper, often one that publishes weekly instead of daily."

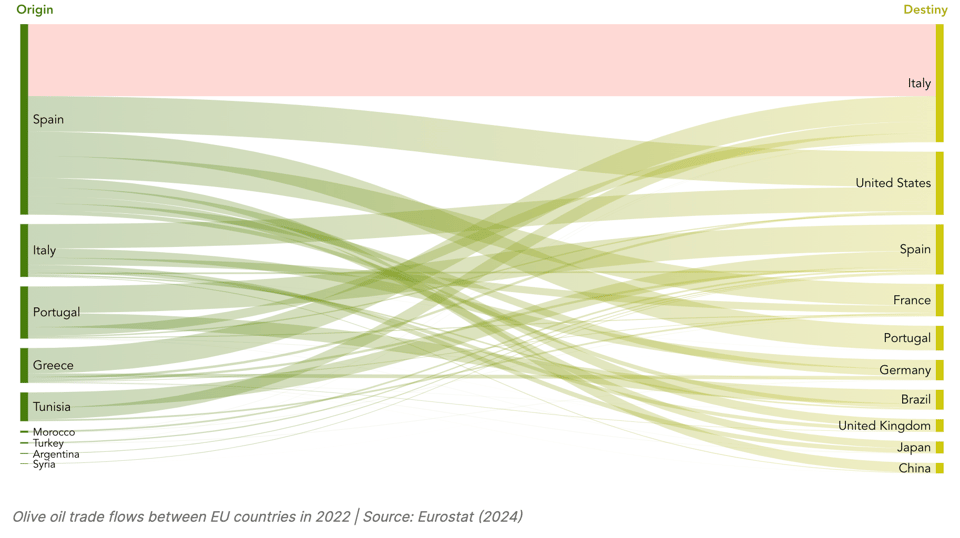
The olive oil wars
"Italy convinced the world that it was the king of liquid gold by selling Spanish oil, but now Spain has appropriated 'Made in Italy'."
I have an interest in this topic, as you can imagine... (don't tell any of my Italian or Spanish friend but, here in North London, I buy Greek).
🛠️📖 Tools & Tutorials
How to make complex Chrome extensions: a zero gravity guide
Chrome extensions seem to be a favourite of data analysts and journalists, so here's a handy guide.
Satellites Spotting Ships
Another handy walkthrough on satellite images by geo-guru Mark Litwintschik, this time looking at images of ships. Among other things, he trains a YOLO model that recognises ships in the pictures.
(via Geomob)

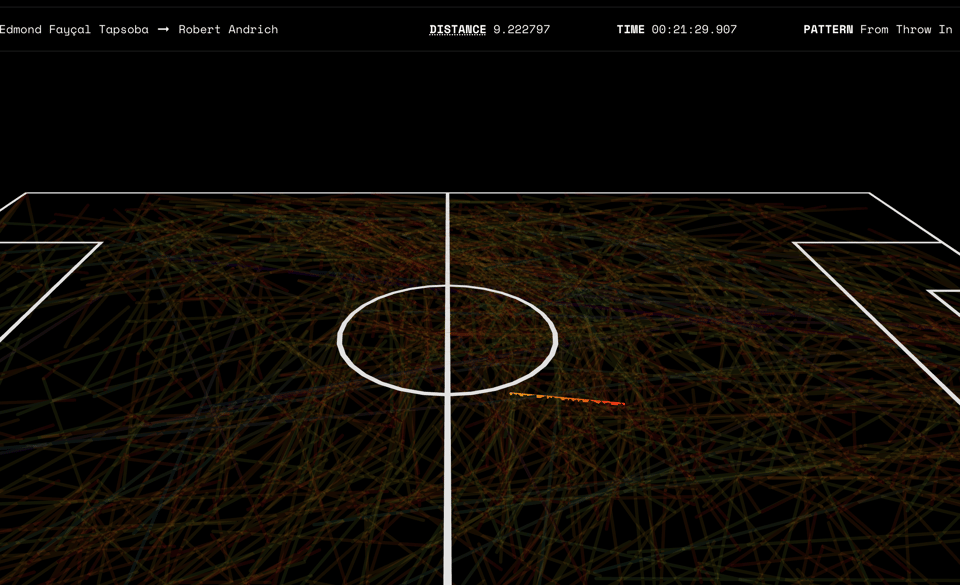
StatsBomb 3D Visualizer
"Paste a raw URL to a StatsBomb event data file from their repository."
This is pretty cool. I suppose you could take inspiration to create your own, based on StatsBomb open data release, or use it to visualize data for sports articles.
Also, it reminds me of some good old times...
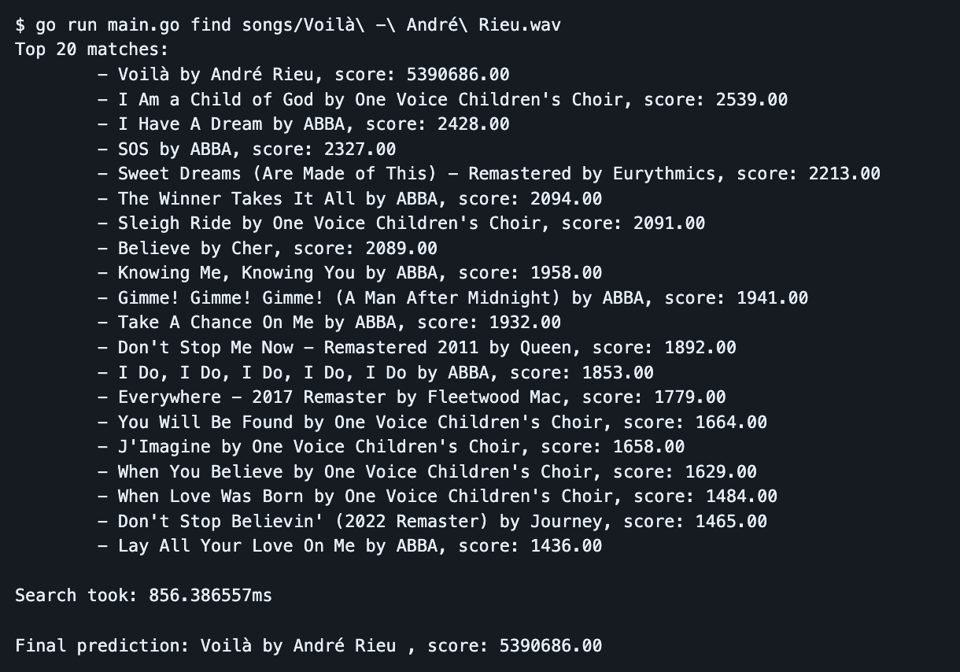
seek-tune
"An implementation of Shazam's song matching algorithm."
In Go, and open source.
35% Faster Than The Filesystem
This is what SQLite now claims to be. I've got to say I increasingly use it in my personal projects, when they don't need frequent, concurrent writes.
"SQLite reads and writes small blobs (for example, thumbnail images) 35% faster¹ than the same blobs can be read from or written to individual files on disk using fread() or fwrite().
Furthermore, a single SQLite database holding 10-kilobyte blobs uses about 20% less disk space than storing the blobs in individual files.
The performance difference arises (we believe) because when working from an SQLite database, the open() and close() system calls are invoked only once, whereas open() and close() are invoked once for each blob when using blobs stored in individual files. It appears that the overhead of calling open() and close() is greater than the overhead of using the database. The size reduction arises from the fact that individual files are padded out to the next multiple of the filesystem block size, whereas the blobs are packed more tightly into an SQLite database.
The measurements in this article were made during the week of 2017-06-05 using a version of SQLite in between 3.19.2 and 3.20.0. You may expect future versions of SQLite to perform even better."
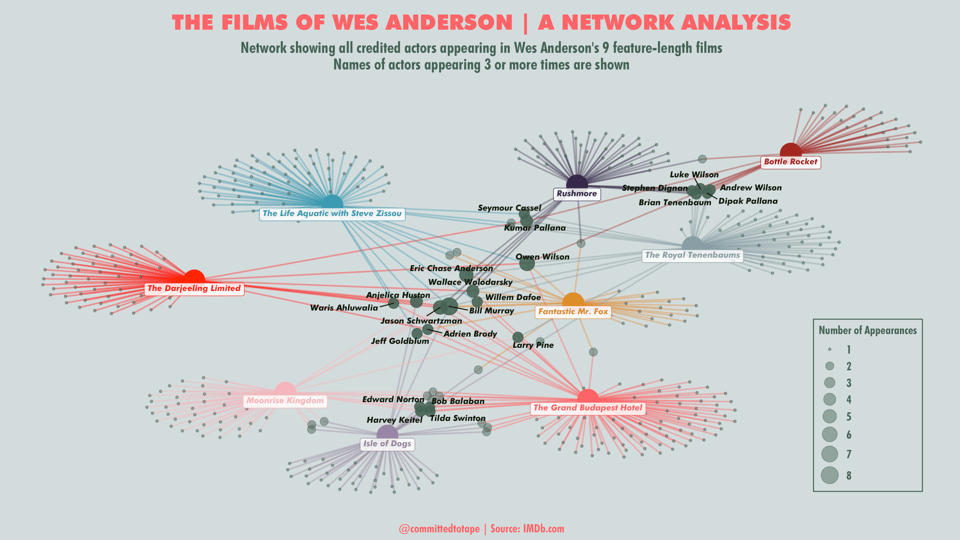
Wes Anderson
"Sure, dplyr can be pretty handy, and ggplot2 has certainly got something going for it, but I think we can all agree that the real gem amongst the plethora of R packages is the wesanderson package."
🤯 Data thinking
The Analytics Development Lifecycle
Tristan Handy: "In 2016, I authored a blog post entitled “Building a Mature Analytics Workflow.” That post helped launch a community and a product, and many of the assertions from that original post have been realized in the industry. However, eight years in, the original post is in need of an update.
In this white paper, I propose a single, end-to-end model that I call the Analytics Development Lifecycle (ADLC). The ADLC is, I propose, the best path to building a mature analytics capability within an organization of any scale."
📈Dataviz, Data Analysis, & Interactive
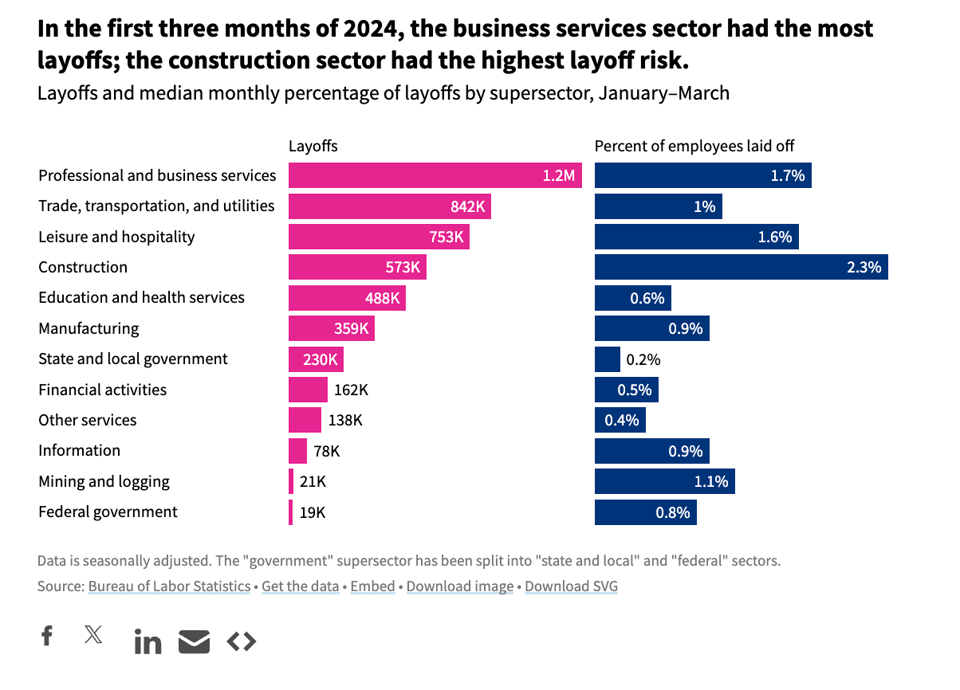
Which industries are most at risk for layoffs?
USAFacts: "Since 2001, there have been an average of 5.8 million layoffs per quarter."
10 Charts That Capture How the World Is Changing
"From Ketamine to WhatsApp Users, Egg Freezing to AI Job Loss".
(via Daniele Bottillo)
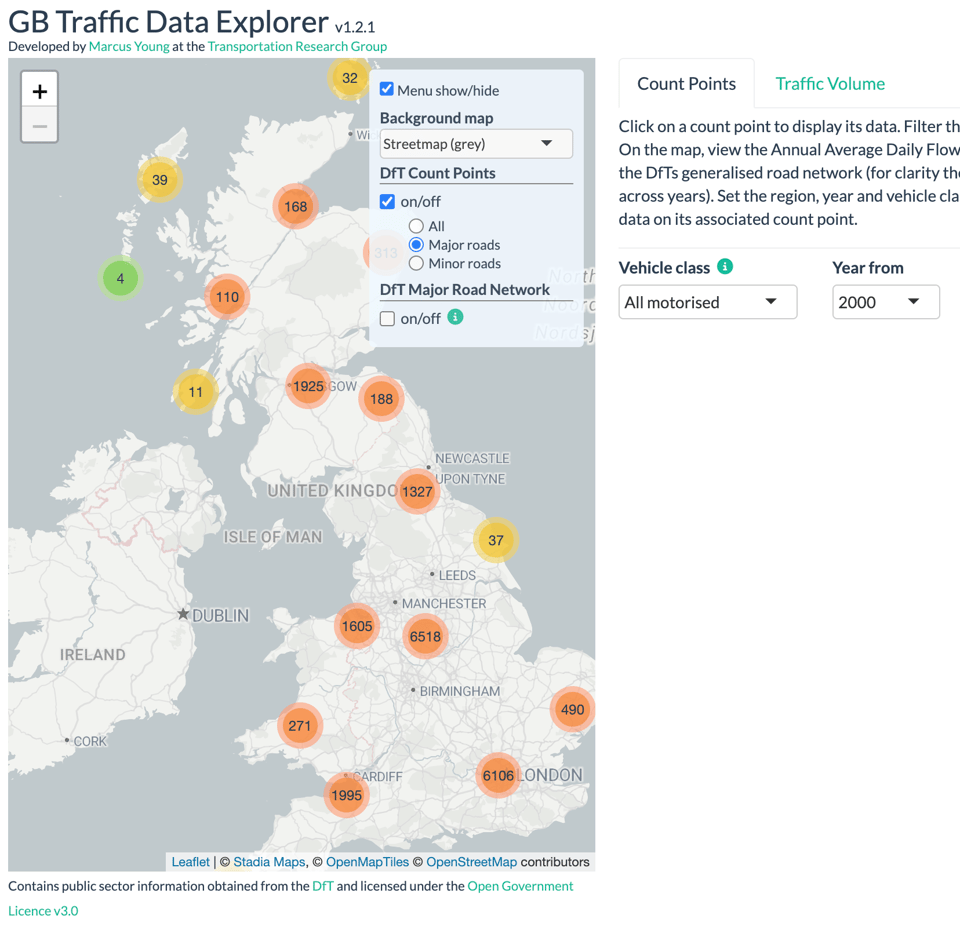
GB Traffic Data Explorer
By Marcus Young at the Transportation Research Group of the University of Southampton, this website visualises stats coming from the Department for Transport.
🤖 AI
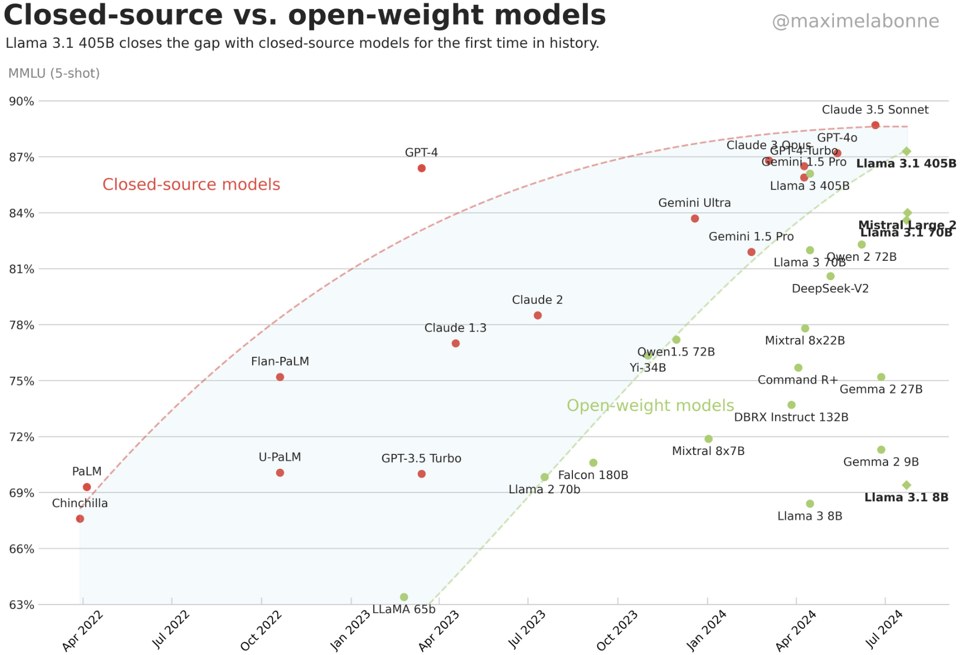
Closed-source vs. open-weight models
There's not much of a gap anymore.
Consent in Crisis: The Rapid Decline of the AI Data Commons
PDF research paper. TL;DR: websites are increasingly placing restrictions on scraping via robot.txt and other means. Interesting to see how ten years ago being indexed by a web crawler was all the rage, and now it's something to be avoided at all costs.
The Data Provenance collective isn't unbiased, of course, but their report is interesting.
|
DID YOU LIKE THIS ISSUE>? → BUY ME A COFFEE! 
You're receiving this email because you subscribed to Quantum of Sollazzo, a weekly newsletter covering all things data, written by Giuseppe Sollazzo (@puntofisso). If you have a product or service to promote and want to support this newsletter, you can sponsor an issue. |
quantum of sollazzo is also supported by Andy Redwood’s proofreading – if you need high-quality
copy editing or proofreading, check out Proof Red. Oh, and he also makes motion graphics animations about climate change.
