572: quantum of sollazzo
#572: quantum of sollazzo – 30 July 2024
The data newsletter by @puntofisso.

Hello, regular readers and welcome new ones :) This is Quantum of Sollazzo, the newsletter about all things data. I am Giuseppe Sollazzo, or @puntofisso. I've been sending this newsletter since 2012 to be a summary of all the articles with or about data that captured my attention over the previous week. The newsletter is and will always (well, for as long as I can keep going!) be free, but you're welcome to become a friend via the links below.
The most clicked link last week has the course based on ML Code Challenges.
The Quantum of Sollazzo grove now has 15 trees. It helps managing this newsletter's carbon footprint. Check it out at Trees for Life.
'till next week,
Giuseppe @puntofisso
✨ Topical
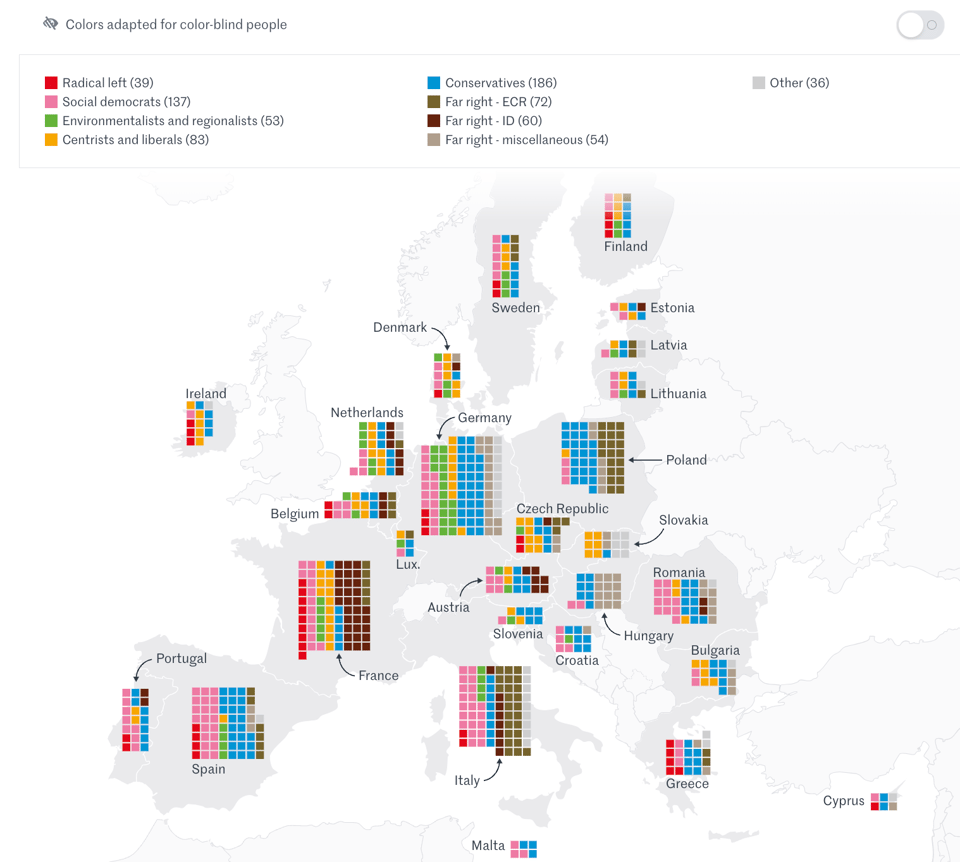
2024 European elections results: Explore our map and view the make-up of the future Parliament
Le Monde takes a look at the recent European Elections, making good use of maps and charts.
Twelve charts that show how Labour won by a landslide
"Conservative collapse ensures Labour is victorious – but the party’s overall vote share has stayed relatively static. These charts explain how the election was won and lost."
By the usual suspects Ashley Kirk and visual team at The Guardian.
(via Soph Warnes' Fair Warning, which has just come back after a 2-year hiatus!)
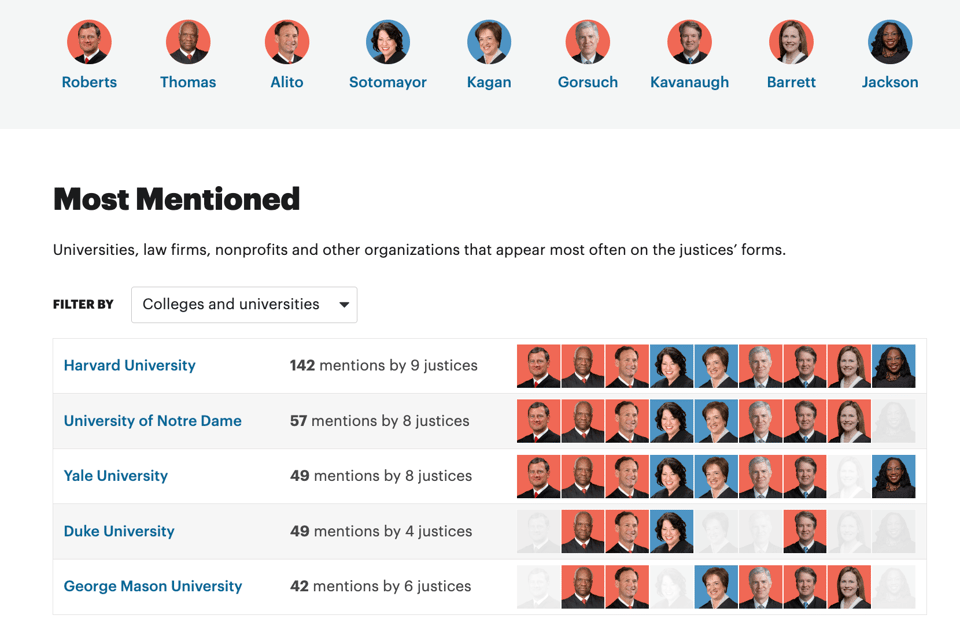
Supreme Connections
ProPublica: "Every year, the Supreme Court’s nine justices fill out a form that discloses their financial connections to companies and people. Using our new database, you can now search for organizations and people that have paid the justices, reimbursed them for travel, given them gifts and more."
Very interesting use of publicly available data.
🛠️📖 Tools & Tutorials
Querying 1TB on a laptop with Python dataframes
"Today with Ibis you can reliably and efficiently process a 1TB dataset on a laptop with <1/10th the RAM."
Ibis is an "open source dataframe library that works with any data system".
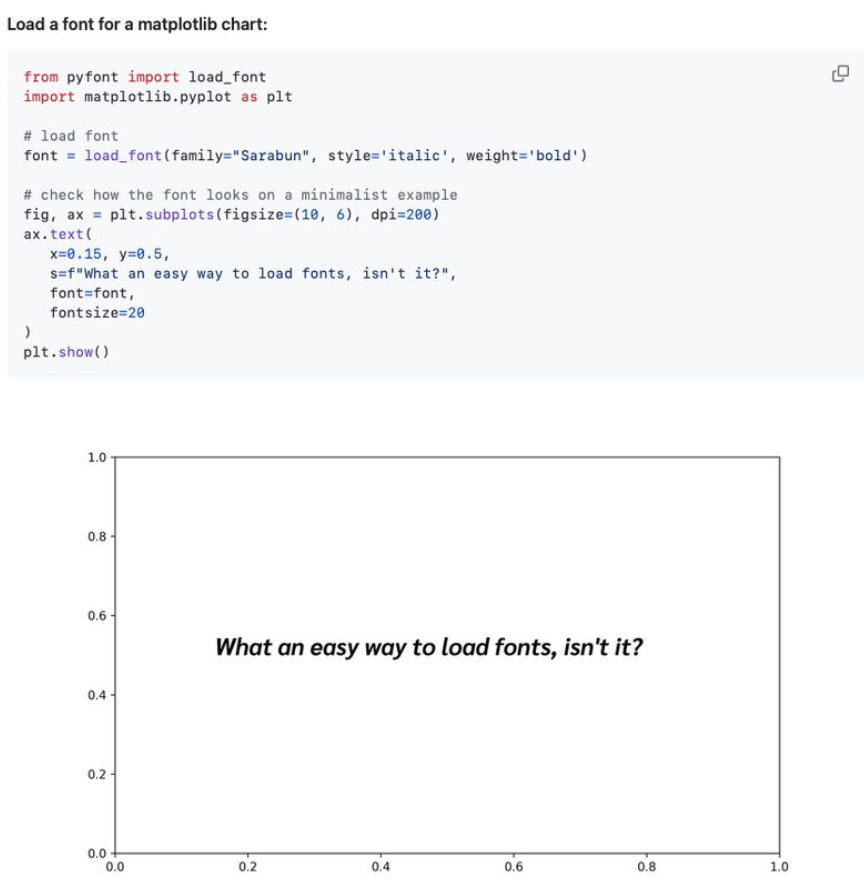
2 lines of code to use any font in your Matplotlib chart
Good tip from Yan Holtz.
qsv: Blazing-fast CSV data-wrangling toolkit
"qsv (pronounced "Quicksilver") is a command line program
for querying, indexing, slicing, analyzing, filtering, enriching,
transforming, sorting, validating & joining CSV files.
Commands are simple, fast & composable."
For those among you who like the CLI interface and want to be fast.
It's got quite a few useful commands, including for importing Excel files, deduplicating data, converting into SQLite and Parquet, validating versus a JSON Schema, and more.
(via Edward Jones)
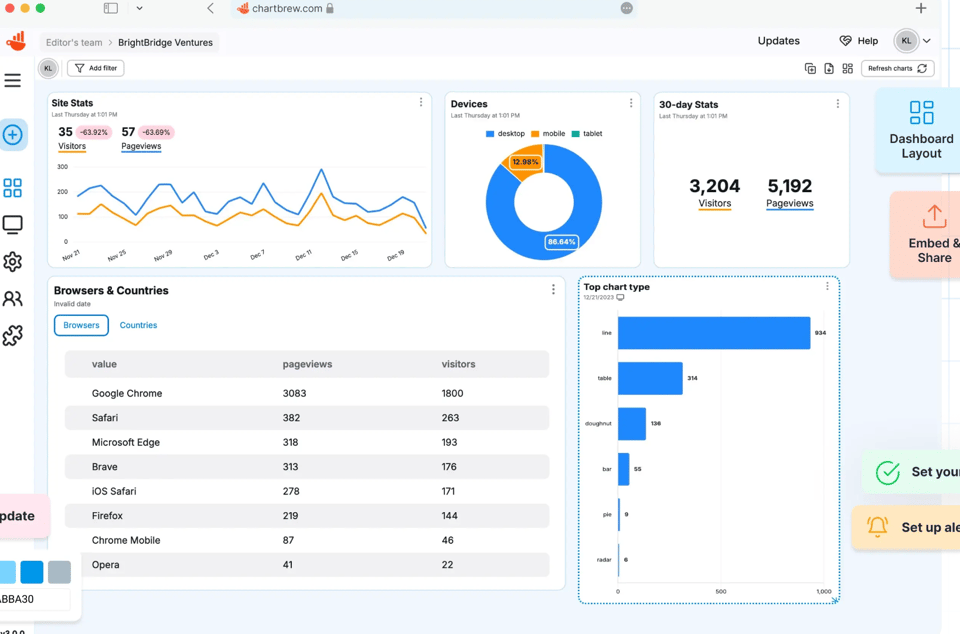
chartbrew
"Chartbrew is an open-source web application that can connect directly to databases and APIs and use the data to create beautiful charts. It features a chart builder, editable dashboards, embeddable charts, query & requests editor, and team capabilities."
Open source if you want to run it locally, but also available as a web service.
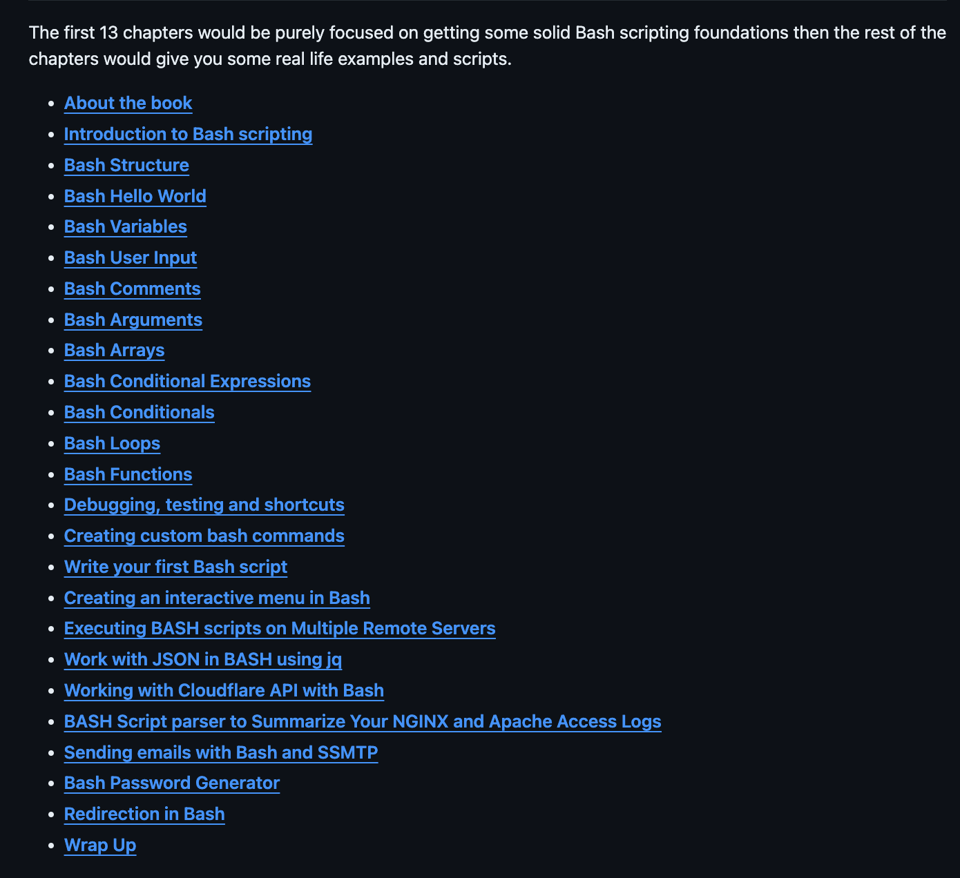
Introduction to Bash Scripting
"This is an open-source introduction to Bash scripting guide/ebook that will help you learn the basics of Bash scripting and start writing awesome Bash scripts that will help you automate your daily SysOps, DevOps, and Dev tasks. No matter if you are a DevOps/SysOps engineer, developer, or just a Linux enthusiast, you can use Bash scripts to combine different Linux commands and automate boring and repetitive daily tasks, so that you can focus on more productive and fun things."
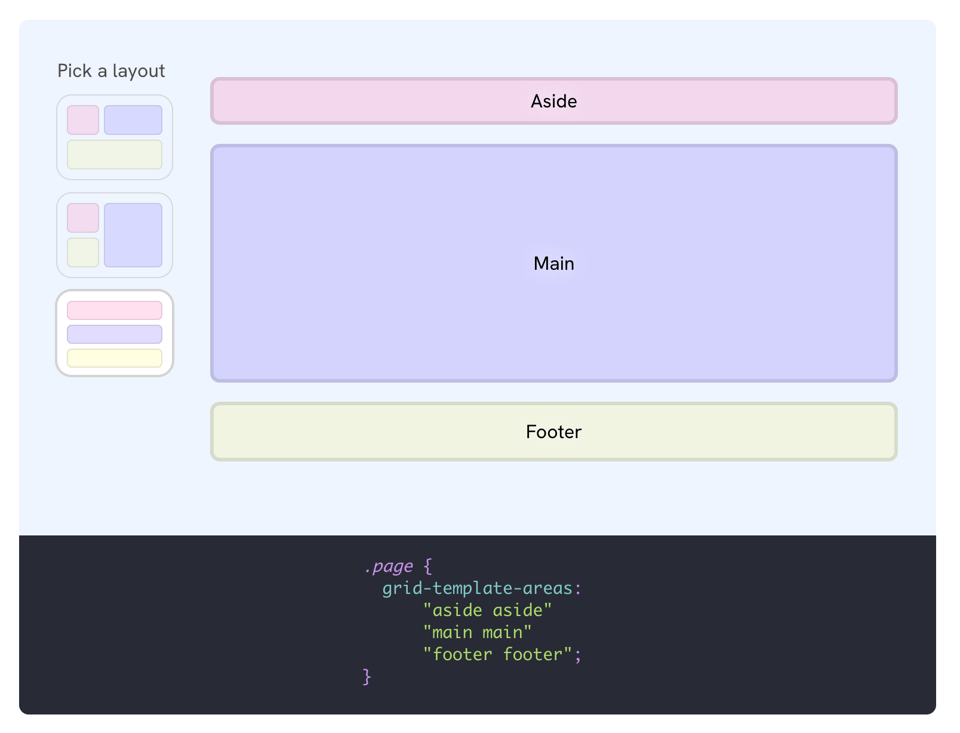
CSS Grid Areas
"A fresh look at the CSS grid template areas and how to take advantage of its full potential today."
An online, interactive tutorial.
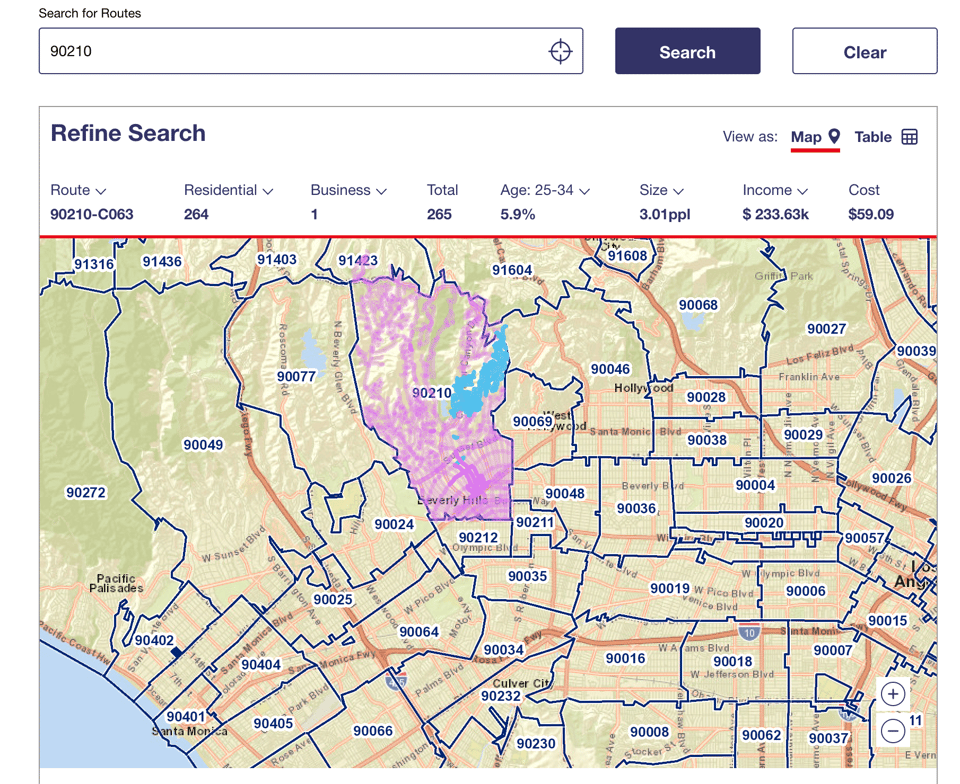
Every Door Direct Mail
The US Postal Service has this incredibly good tool to find routes, which I'm pretty sure covers a data journalist's use case or two.
(And yes, every time I must test a service by using a US Zip Code, the first one that comes to mind is always that one.)
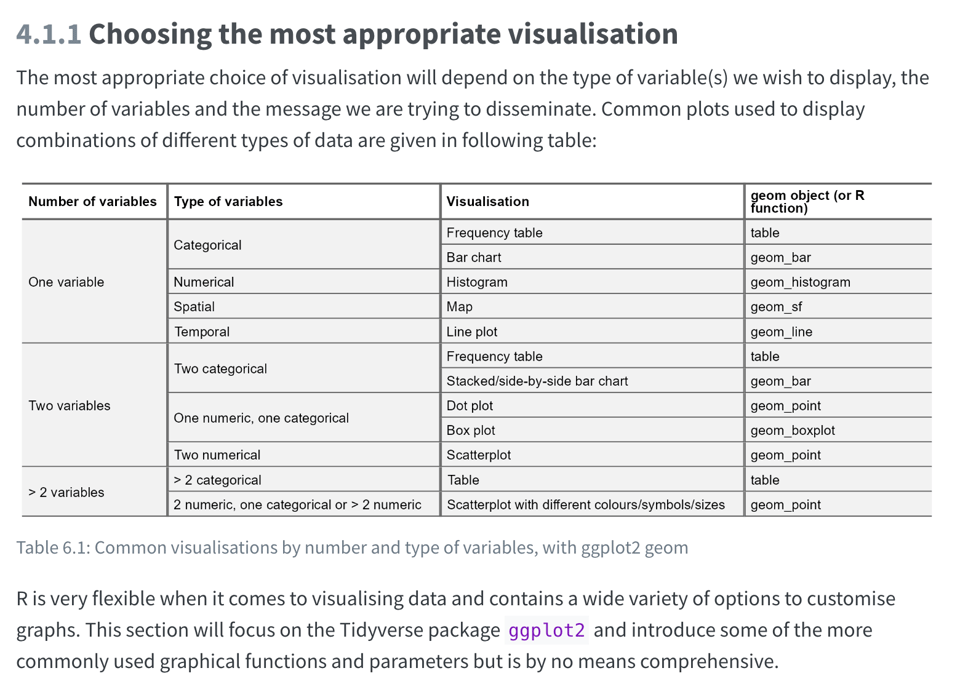
Introduction to R with Tidyverse
"This course is designed to equip you with the essential skills to leverage the power of R and Tidyverse for their work. The course begins with a gentle introduction to the user-friendly RStudio interface and the basics of the R coding language, or syntax. This makes it ideal for anyone with little or no prior coding experience, or those looking for a refresher of the basics.
Through this course, you will learn how to manipulate, transform, and clean data efficiently, and how to create compelling visualisations to communicate your findings effectively. Throughout the course, we will discuss best practices for reproducible coding."
🤯 Data thinking
See Why Everyone Gets the Monty Hall Puzzle Wrong
Allison Parshall for Scientific American: "How to finally wrap your mind around the uniquely counterintuitive Monty Hall dilemma."
📈Dataviz, Data Analysis, & Interactive
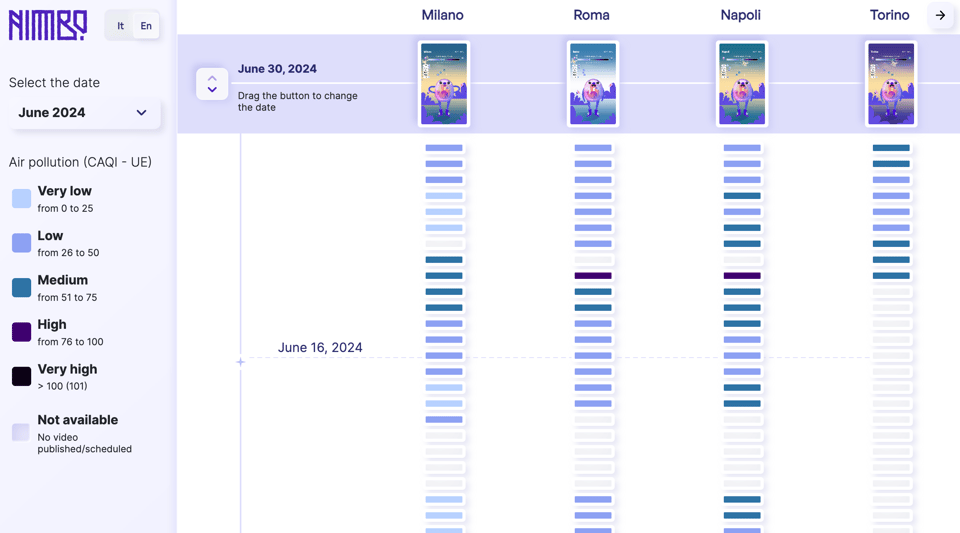
Nimbo
An air quality dataviz for Italian cities. Brilliantly visual.
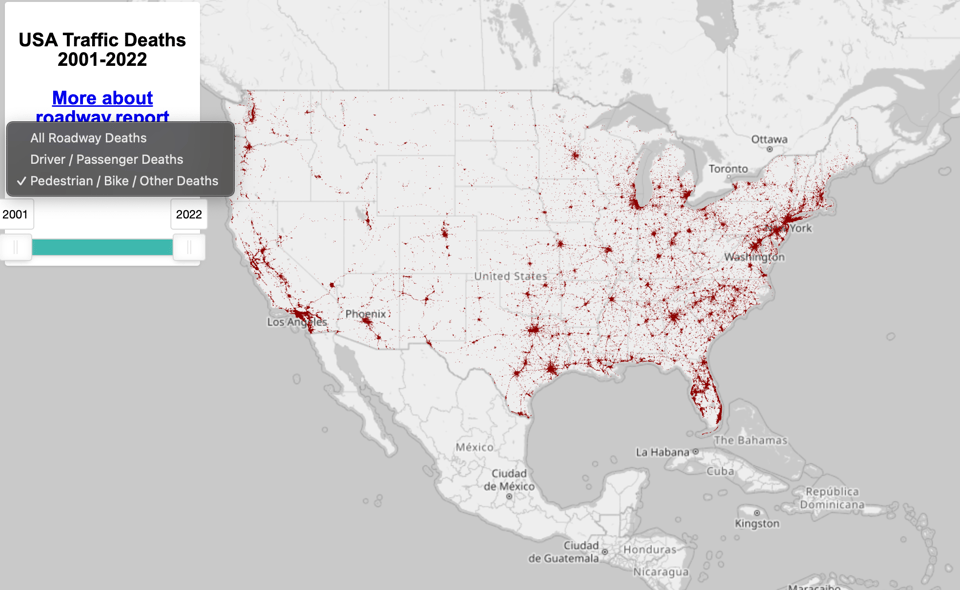
USA Traffic Deaths 2001-2022
This is a campaign website with an interesting use of data and the source code available.
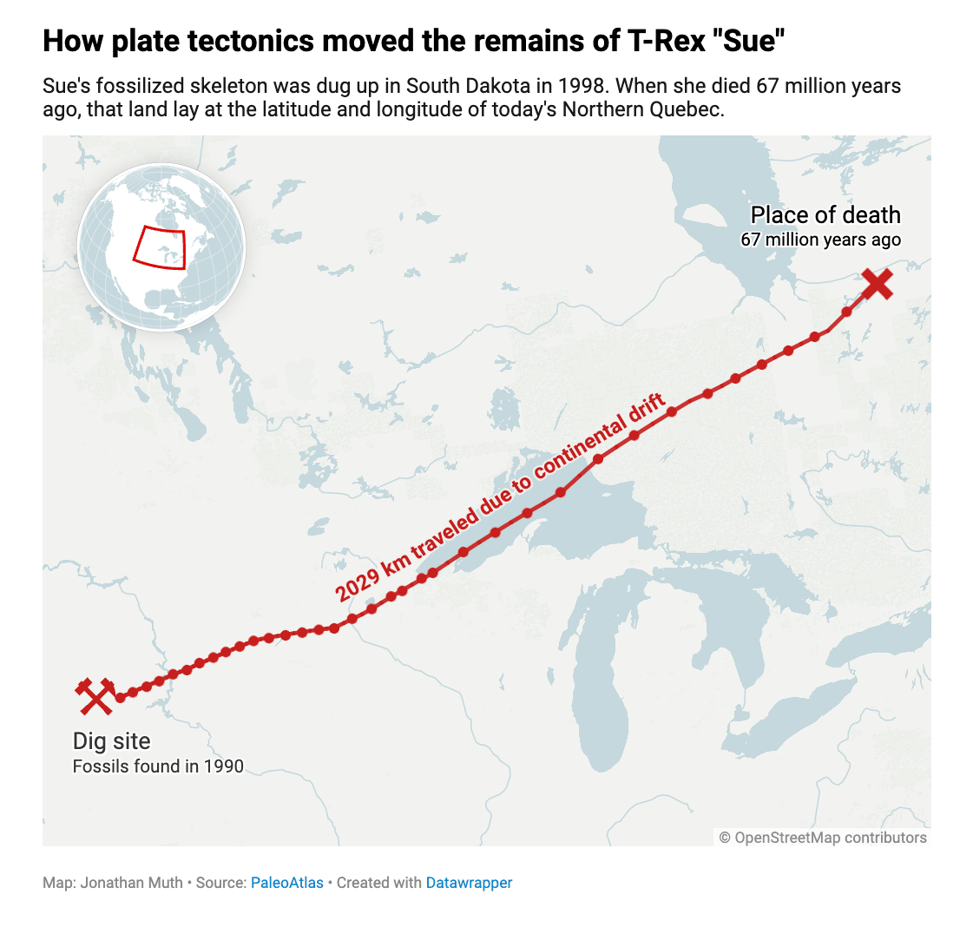
Dinosaurs: Long dead but still on the move
Datawrapper's Jonathan Muth: "My first idea was to create a map showing where the bones of famous dinosaurs were found. I picked everyone’s favorites — Tyrannosaurus, Ceratops, Stegosaurus, Brachiosaurus and Ankylosaurus. But while I was putting the dig sites on a map, another thought crossed my mind: This isn’t where these dinos actually died."
This is a pretty cool idea.
🤖 AI
Building a better future with data and AI: a white paper
The Open Data Institute: "This white paper outlines our vision for artificial intelligence (AI) in the UK, emphasising the need for robust data infrastructure, governance and ethical foundations to support the tech ecosystem."
Questionable practices in machine learning
Pre-print klaxon here – "Evaluating modern ML models is hard. The strong incentive for researchers and companies to report a state-of-the-art result on some metric often leads to questionable research practices (QRPs): bad practices which fall short of outright research fraud. We describe 43 such practices which can undermine reported results, giving examples where possible. Our list emphasises the evaluation of large language models (LLMs) on public benchmarks. We also discuss "irreproducible research practices", i.e. decisions that make it difficult or impossible for other researchers to reproduce, build on or audit previous research."
|
DID YOU LIKE THIS ISSUE>? → BUY ME A COFFEE! 
You're receiving this email because you subscribed to Quantum of Sollazzo, a weekly newsletter covering all things data, written by Giuseppe Sollazzo (@puntofisso). If you have a product or service to promote and want to support this newsletter, you can sponsor an issue. |
quantum of sollazzo is also supported by Andy Redwood’s proofreading – if you need high-quality
copy editing or proofreading, check out Proof Red. Oh, and he also makes motion graphics animations about climate change.
