571: quantum of sollazzo
#571: quantum of sollazzo – 23 July 2024
The data newsletter by @puntofisso.

Hello, regular readers and welcome new ones :) This is Quantum of Sollazzo, the newsletter about all things data. I am Giuseppe Sollazzo, or @puntofisso. I've been sending this newsletter since 2012 to be a summary of all the articles with or about data that captured my attention over the previous week. The newsletter is and will always (well, for as long as I can keep going!) be free, but you're welcome to become a friend via the links below.
The most clicked link last week was MSCHF's tool to download fonts from any website.
The Quantum of Sollazzo grove now has 15 trees. It helps managing this newsletter's carbon footprint. Check it out at Trees for Life.
'till next week,
Giuseppe @puntofisso
✨ Topical
Every map of China is wrong
Well, not quite, but catchy title :-) I didn't know about the "China GPS shift" and it was very interesting to learn about. This seems to be a national security decision, which boils down to the fact that "companies outside of China need to have a Chinese mapping partner in order to provide data about Chinese locations."
Most notably, it seems to cause a misalignment between Google Maps and Google StreetView, and it's a reminder that geospatial data is not easy to understand and interpret without knowledge of geography, history, and politics.
(via Guy Lipman)
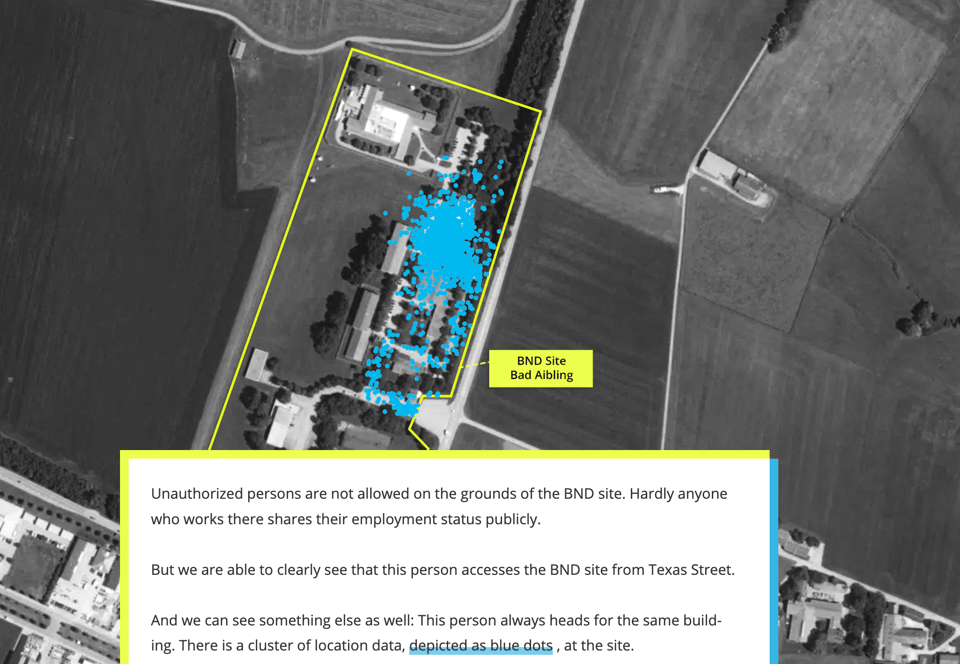
Under Surveillance
Katharina Brunner and colleagues at BR24, the public broadcaster in Bavaria, look at "How Location Data Jeopardizes German Security".
This article and investigation is about data that can be easily found online, for free or for a fee. BR ran this together with an investigation partner, Netzpolitik, who published their own analysis.
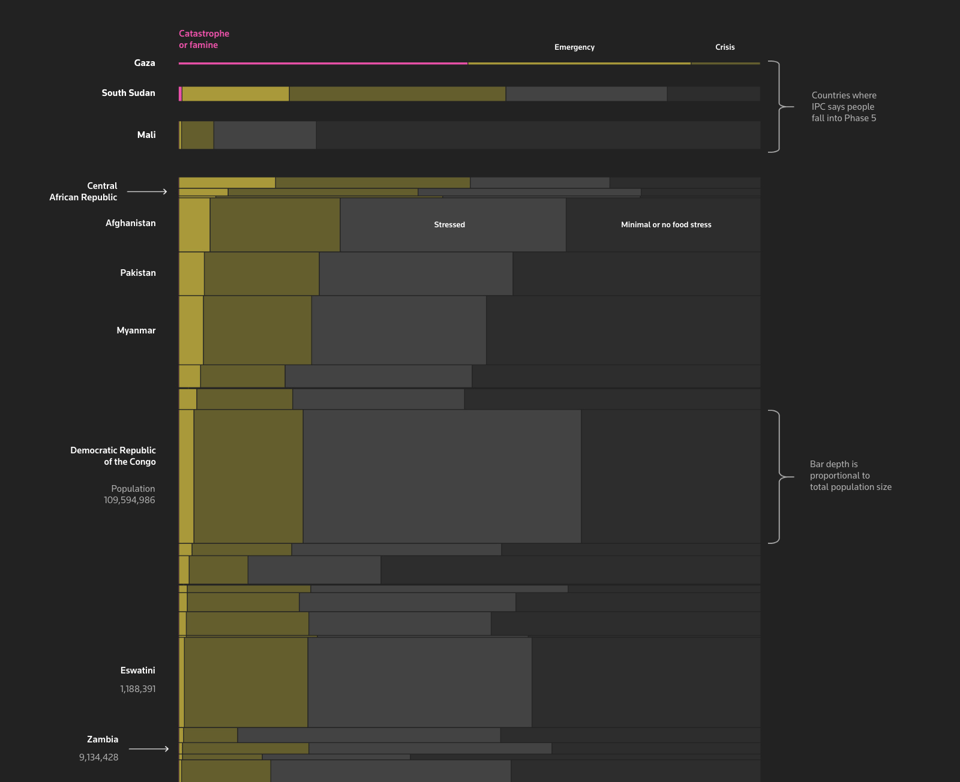
How children starve
Reuters takes a look at the impact of famine. While mostly centred on the crisis in Gaza, what's interesting here is that the approach to the data analysis is based on what is, fundamentally, a data standard – the Integrated Food Security Phase Classification by FAO – which also allows for a comparison with other crises.
🛠️📖 Tools & Tutorials
Building and scaling Notion’s data lake
"Everything you see in Notion—texts, images, headings, lists, database rows, pages, etc—despite differing front-end representations and behaviors, is modeled as a "block" entity in the back end and stored in the Postgres database with a consistent structure, schema, and associated metadata."
The article looks at how this data is then fed into Snowflake for analytics.

ML Code Challenges
A good, practical way, to learn Machine Learning.

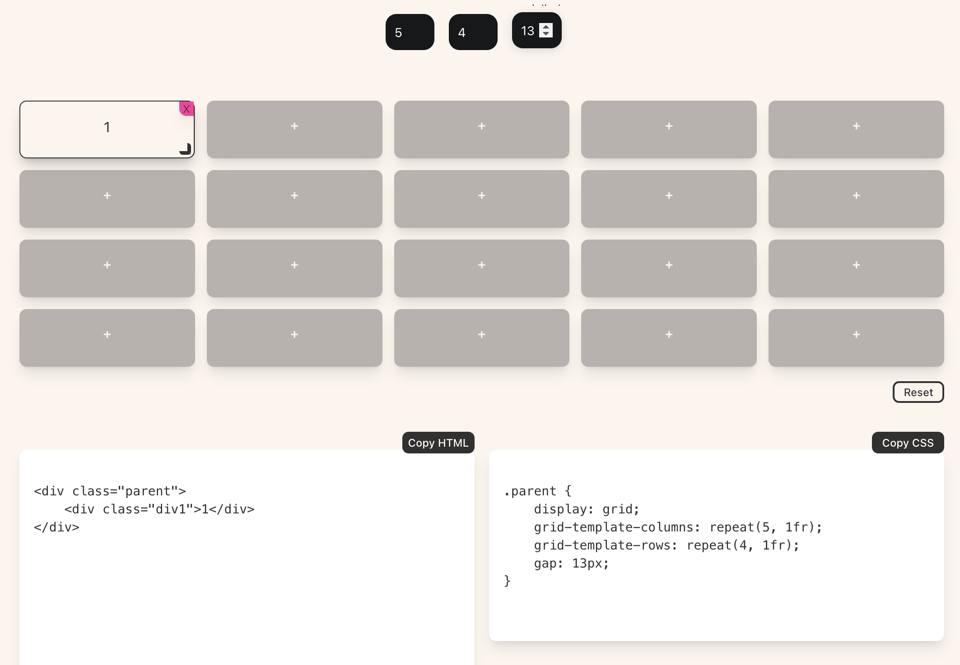
CSS Grid Generator
"CSS grid generator is a tool that helps developers create custom CSS grid layouts more easily. The generator allows users to specify the number of columns, rows, the gutter size."
Responsive bar charts in HTML and CSS
With a full walkthrough and access to the relevant CodePens.
Quartz
Quartz is "a fast, batteries-included static-site generator that transforms Markdown content into fully functional websites"

Stat Significant is a free weekly newsletter featuring data-centric essays about movies, music, TV, and more.
When do we stop finding new music? Which TV shows got their finale right, and which didn't? Which movies popularized (or tarnished) baby names?
Subscribe for free to find out! I have linked a few issues already and it has become one of my regular readings!
Here is the link: https://www.statsignificant.com
🤯 Data thinking
There are 4 interconnected aspects of data
What I learned from attending London Data Week this year.
📈Dataviz, Data Analysis, & Interactive
Practical tactical voting
Datawrapper's Rose Mintzer-Sweeney looks at the impact of tactical voting in the recent UK General Election.

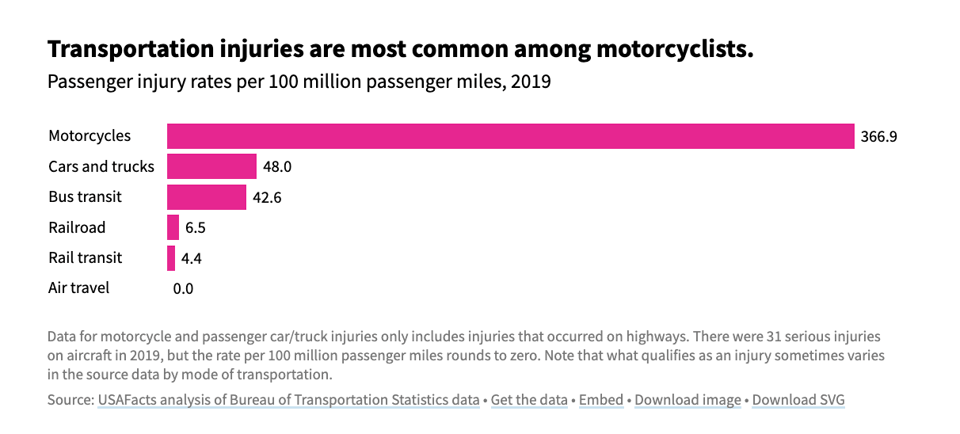
Is flying safer than driving?
"There have been effectively zero deaths per 100 million passenger miles traveled by air in the US each year from 2002 to 2020", says USA Facts.
However, I think that what people fear is that sense of powerlessness in a relatively prolonged certain death scenario, as opposed to the (perceived) suddenness of a car crash. That said, it's not always certain even when it looks like it might be.
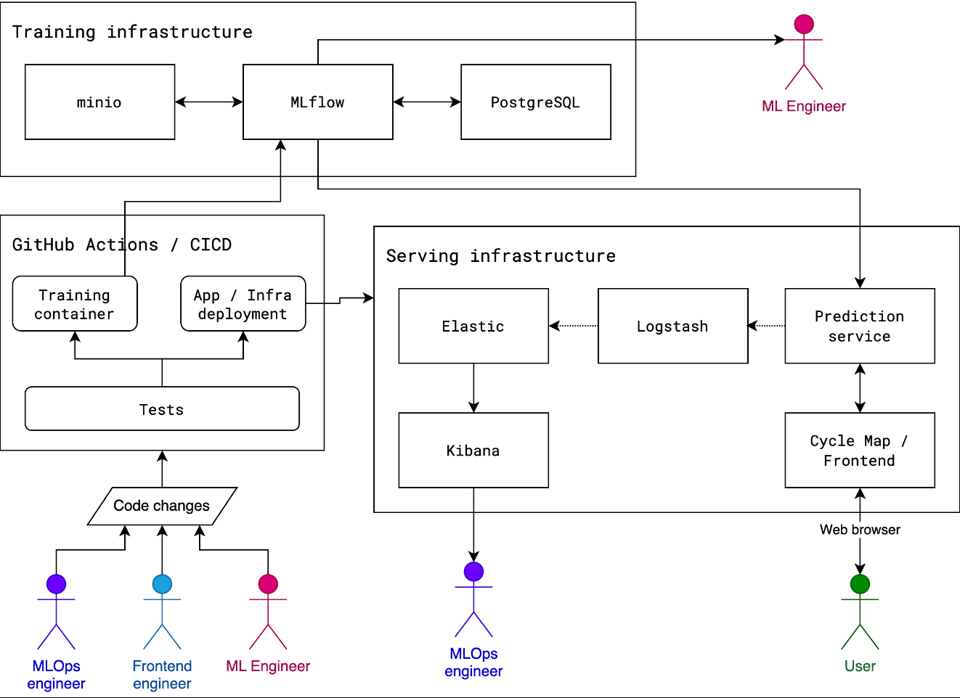
London Cycle Hire Scheme Prediction
"The goal of this project is to predict the occupancy rate of each station in the London Cycle Hire network, it uses historical data from TFL and a forecasting algorithm to calculate how full a given docking station will be in the future."
🤖 AI
My year as an independent AI researcher
Santtu Keskinen: "This is my story of failing to make a break into AI research as an independent researcher."
|
DID YOU LIKE THIS ISSUE>? → BUY ME A COFFEE! 
You're receiving this email because you subscribed to Quantum of Sollazzo, a weekly newsletter covering all things data, written by Giuseppe Sollazzo (@puntofisso). If you have a product or service to promote and want to support this newsletter, you can sponsor an issue. |
quantum of sollazzo is also supported by Andy Redwood’s proofreading – if you need high-quality
copy editing or proofreading, check out Proof Red. Oh, and he also makes motion graphics animations about climate change.
