568: quantum of sollazzo
#568: quantum of sollazzo – 25 June 2024
The data newsletter by @puntofisso.

Hello, regular readers and welcome new ones :) This is Quantum of Sollazzo, the newsletter about all things data. I am Giuseppe Sollazzo, or @puntofisso. I've been sending this newsletter since 2012 to be a summary of all the articles with or about data that captured my attention over the previous week. The newsletter is and will always (well, for as long as I can keep going!) be free, but you're welcome to become a friend via the links below.
The most clicked link last week was this very good visualization of numbers sorted alphabetically in different languages. I blame/thank Neil Richards, who tweeted it, and caused my mentions on X to explode... :)
The Quantum of Sollazzo grove now has 12 trees. Check it out at Trees for Life.
'till next week,
Giuseppe @puntofisso
✨ Topical
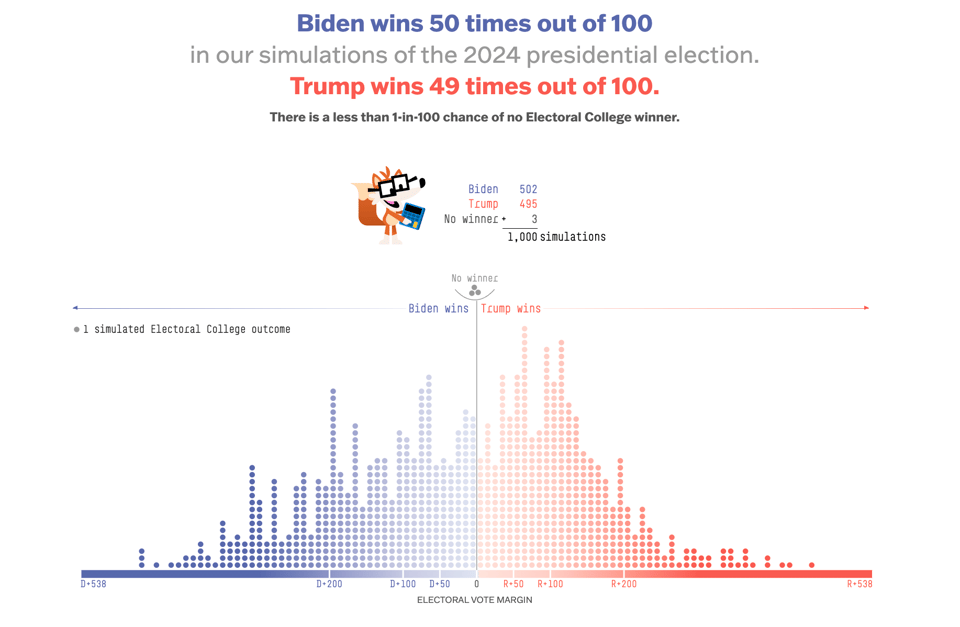
Who Is Favored To Win The 2024 Presidential Election?
"538 uses polling, economic and demographic data to explore likely election outcomes."
As usual, great use of data by FiveThirtyEight.
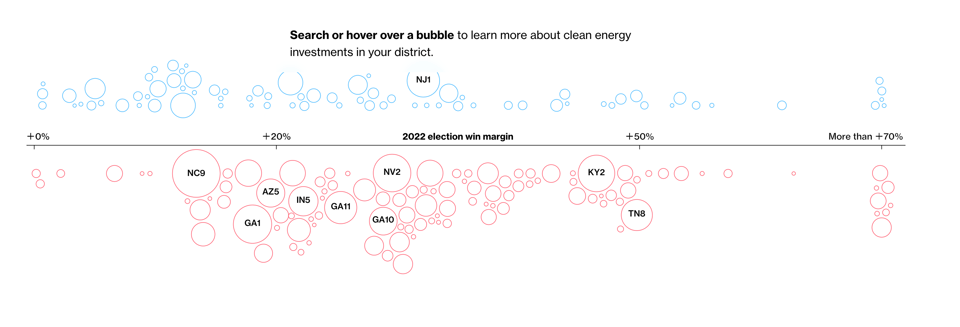
Biden Is Giving Red Districts an Inconvenient Gift: Green Jobs
Bloomberg: The White House’s policies have fueled plans for more than $200 billion in cleantech manufacturing investments — mostly in districts with Republican lawmakers opposed to the agenda."
I love the bubbles in the chart.
(via Peter Wood)
🛠️📖 Tools & Tutorials
Data Wrangling Recipes in R
Hilary Watt, a Senior Teaching Fellow in Statistics at the School of Public Health of Imperial College London, has released this handy manual.
"This book is designed to demonstrate what is required when preparing data for analysis, with modifiable code so that you can readily achieve each step. For any project, work through from Chapters 1 to 9, with the index and headings intended to make it easy to find what is relevant for your project. If you are lucky, only a few subsections of each chapter may be relevant. Chapters demonstrate how to overcome many different ways in which data can be messy."
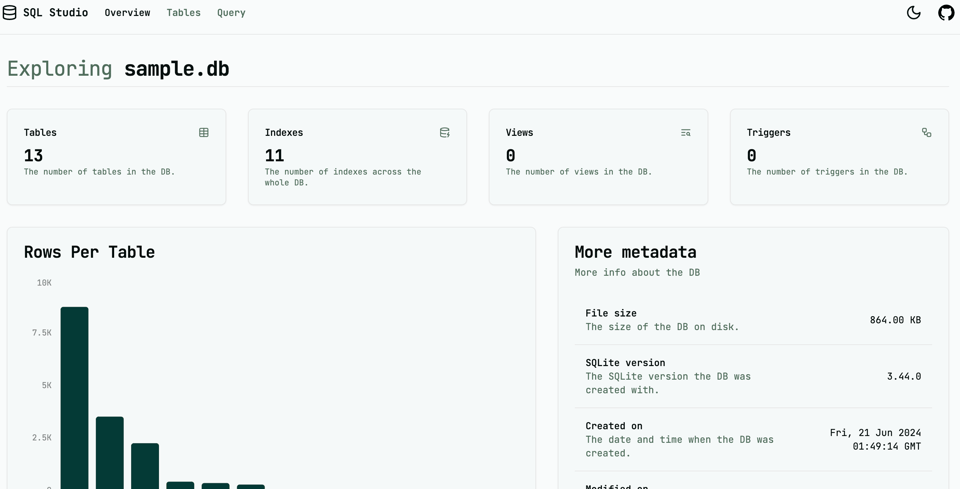
sql-studio
"A SQL Database Explorer for SQLite, libSQL, PostgreSQL, and MySQL/MariaDB".
Try it here, while the source code is on GitHub.
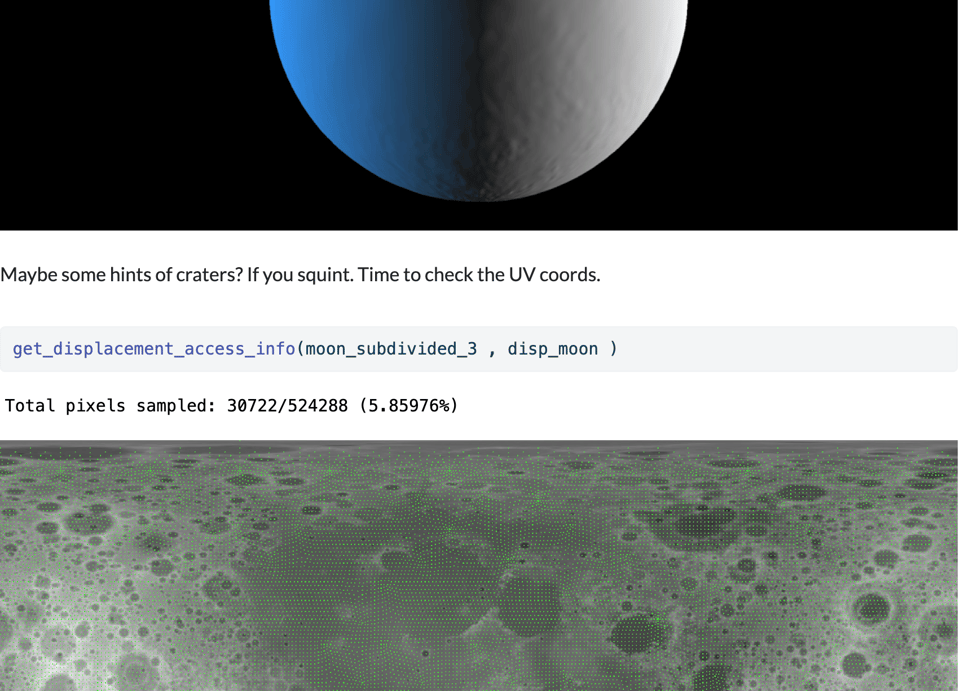
Sculpting the Moon in R: Subdivision Surfaces and Displacement Mapping
Tyler Morgan-Wall: "In this post, we explore subdivision surfaces and displacement mapping within the rayverse, using the rayvertex, rayimage, and rayrender packages. We demonstrate how to create detailed and smooth 3D models by subdividing meshes and applying displacement textures. These techniques enhance both artistic and data visualization projects by providing realistic and intricate surface details."
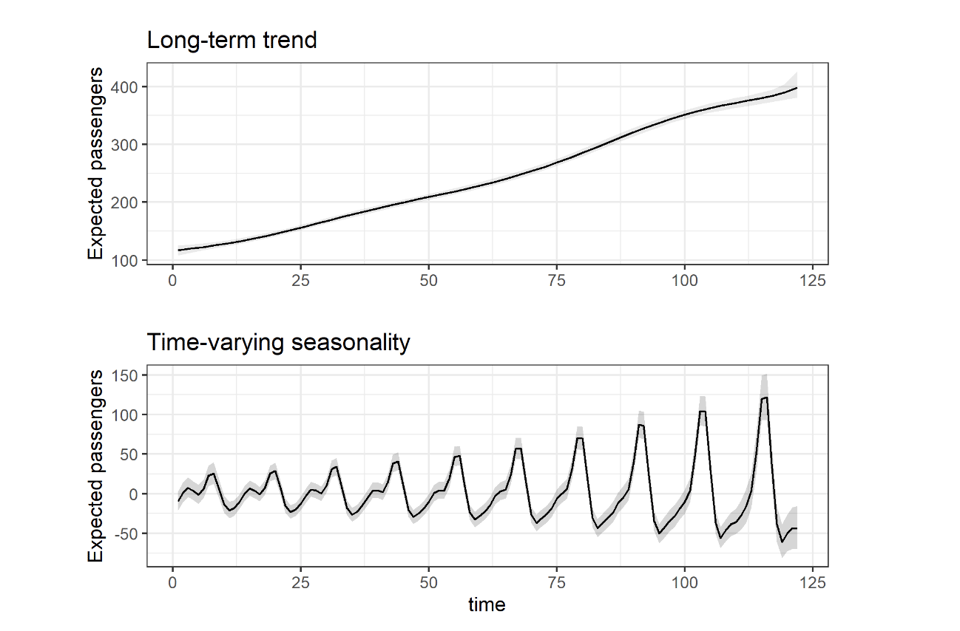
Incorporating time-varying seasonality in forecast models
A look at how to address seasonality that varies across a longer trend, in R.
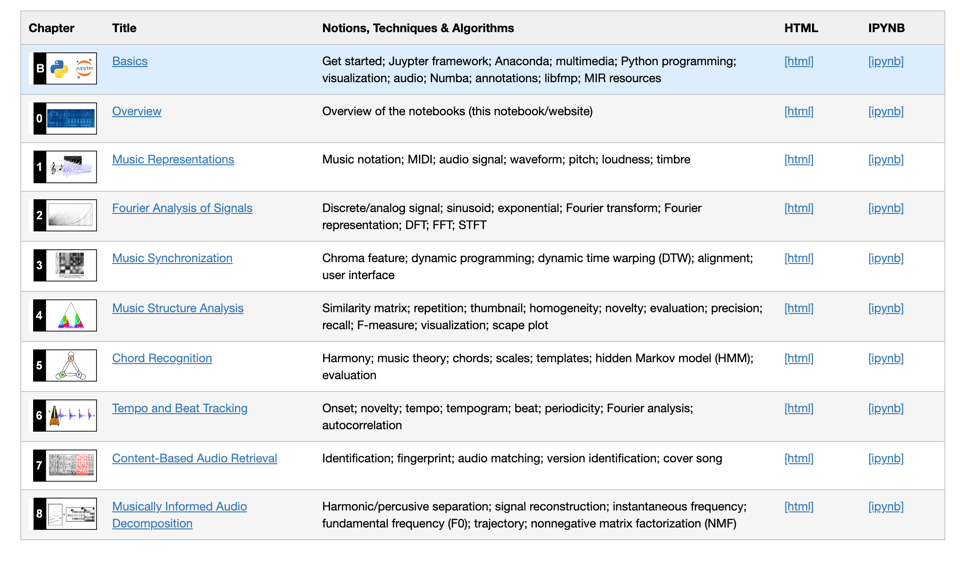
FMP Notebooks
A useful list of Python notebooks for of Music Processing. This website is a compendium to a textbook on the subject, but it can be used on its own. I'm looking at the ones about chord recognition.
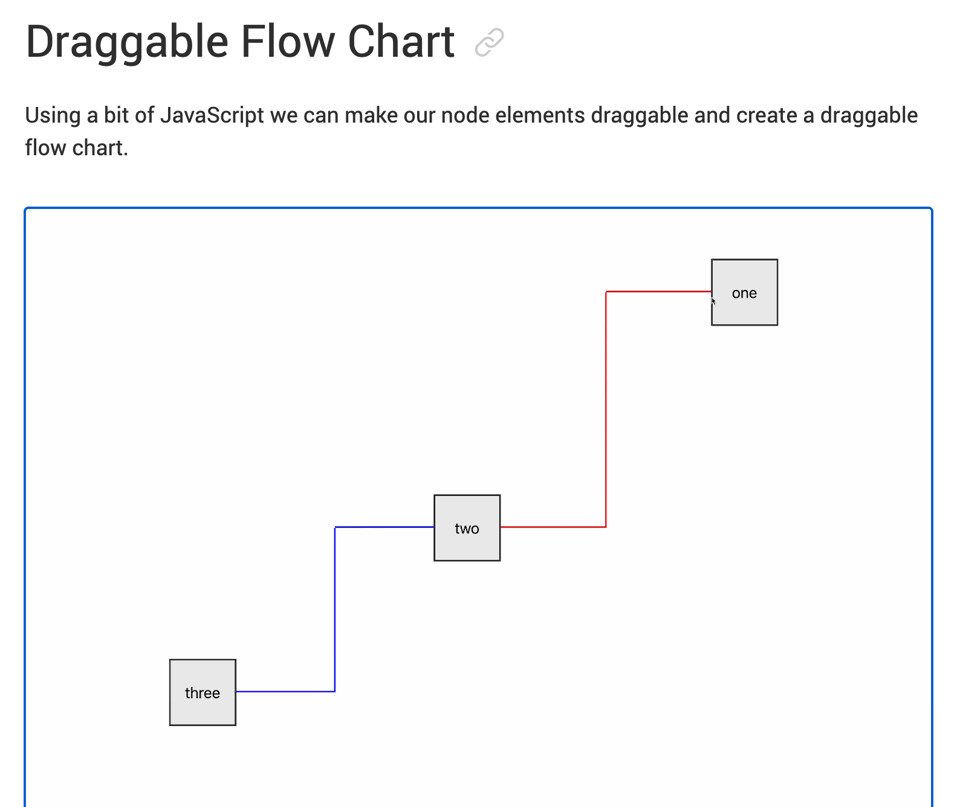
Flow Charts with CSS Anchor Positioning
Cory Rylan: "With the introduction of the CSS Anchor Position API in Chrome 125, it's never been easier to position an element relative to another element. This is a great way to manage complex positioning use cases like popovers and tooltips.
However, CSS Anchor Positioning can be used for more than just popovers and tooltips, it can be used to create basic flow chart diagrams. In this post we will learn how to use CSS Anchor Positioning to create flow charts and diagram with just CSS."
📈Dataviz, Data Analysis, & Interactive
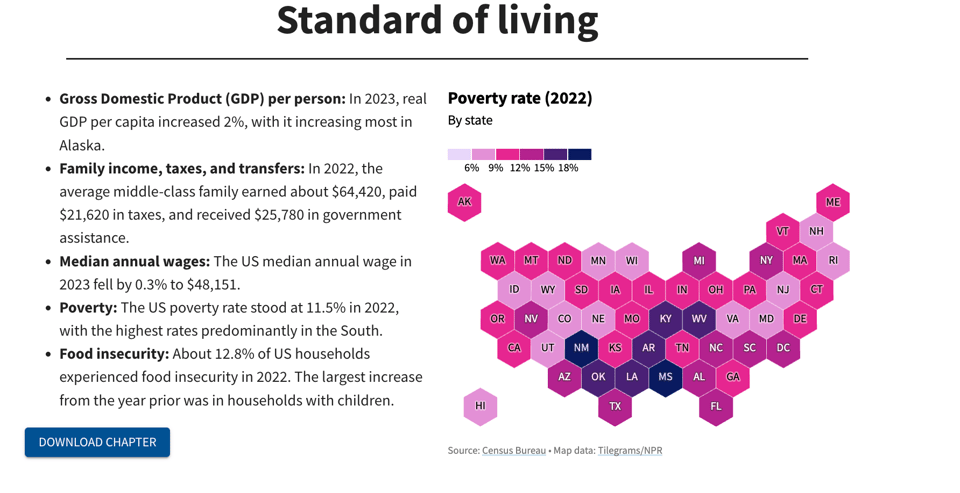
America in Facts 2024: A Data-Driven Report for Congress
USA Facts has published its annual report and it's full of good dataviz.
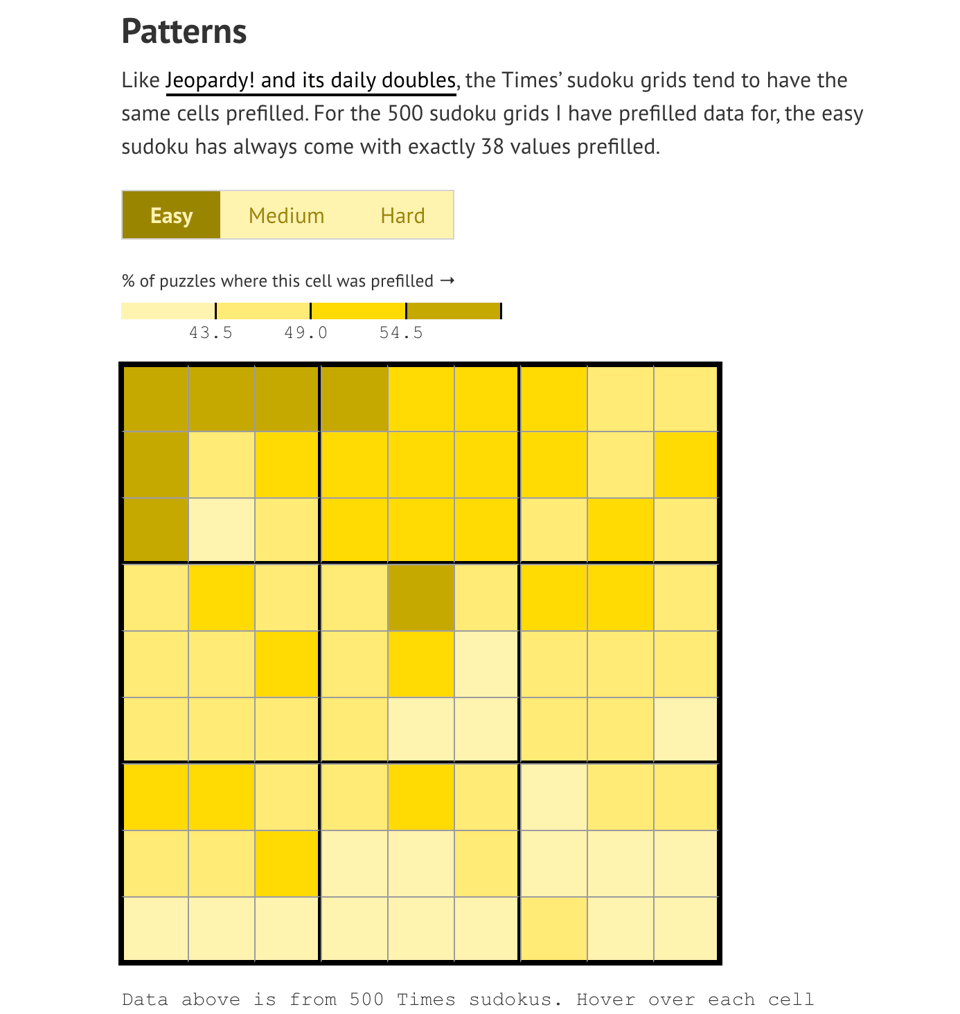
Here's to the next 100 sudokus
Vivek Rao: "Between Feb. 2021 and Feb. 2024, I solved 381 sudokus, with a median time of 3:07". He's now analysed and visualised the data.
🤖 AI
The call of LLMs is strong, we get to pick up the pieces later
Counting Stuff: "More fields are getting on the whole LLM synthetic data generation bandwagon. Honestly at this point the best career move seems to be in learning how to pick apart and vet LLM systems instead of fighting them all the time..."
|
DID YOU LIKE THIS ISSUE>? → BUY ME A COFFEE! 
You're receiving this email because you subscribed to Quantum of Sollazzo, a weekly newsletter covering all things data, written by Giuseppe Sollazzo (@puntofisso). If you have a product or service to promote and want to support this newsletter, you can sponsor an issue. |
quantum of sollazzo is also supported by Andy Redwood’s proofreading – if you need high-quality copy editing or proofreading, check out Proof Red. Oh, and he also makes motion graphics animations about climate change.
