560: quantum of sollazzo
#560: quantum of sollazzo – 30 April 2024
The data newsletter by @puntofisso.

Hello, regular readers and welcome new ones :) This is Quantum of Sollazzo, the newsletter about all things data. I am Giuseppe Sollazzo, or @puntofisso. I've been sending this newsletter since 2012 to be a summary of all the articles with or about data that captured my attention over the previous week. The newsletter is and will always (well, for as long as I can keep going!) be free, but you're welcome to become a friend via the links below.
The most clicked link last week was Copernicus' real-time climate change data service.
My playful Eurostat data app EU Twinnings was included in this open data Use Case Observatory report by data.europa.eu, the Open Data portal of the EU Commission.
Open Data Camp 9 is go!
We will be gathering in Manchester on 6-7 July, and YOU are invited – whatever your interest in open data is, you will likely find someone who wants to discuss it with you.
Tickets to attend are free, but we are also offering a low-cost option that includes accommodation in single rooms at the University of Manchester halls of residence.
All details are here.

The Quantum of Sollazzo's grove has now 10 trees. Many thanks to the latest donors Johan and Duncan.
'till next week,
Giuseppe @puntofisso
✨ Topical
The Anglosphere has an advantage on immigration
"English-speaking countries generally do better at both attracting and integrating talent", says the FT's data analysis and visualization legend John Burn-Murdoch. The chart below is particularly captivating.
(via Peter Wood, who made me notice the clever use of arrow charts here)

Which states rely the most on federal aid?
"A fifth of state and local government revenues come from federal funding."

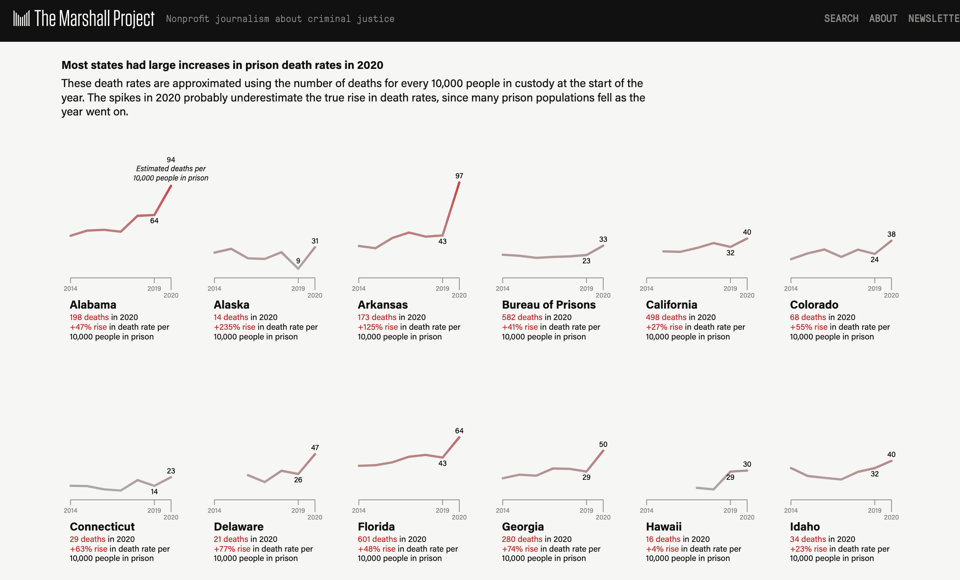
Officials Failed to Act When COVID Hit Prisons. A New Study Shows the Deadly Cost
From the U.S.: "People in [prison])(https://www.themarshallproject.org/2024/04/18/covid-prison-deaths-data) died at 3.4 times the rate of the free population, with the oldest hit hardest. New data holds lessons for preventing future deaths."
A Timeline of Civic Tech Tells a Data-Driven Story of the Field
From the Civic Tech Field Guide: "This is our timeline of civic tech, spanning 25 years from 1994-2018. It tracks discrete product and project launches, not just organizations. The data consists of categorized project launch dates, not end dates, so we’re not exploring project longevity here.We’ve broadly divided the collection up between the tech (products, apps, websites) and the social (everything that people do: the conferences, funders, meetups of civic tech). We also track adjacent and foundational projects that aren’t explicitly civic tech, but are necessary for civic tech to have meaning: issues like broadly available internet connectivity and racial, gender, and linguistic diversity online."
🛠️📖 Tools & Tutorials
Correlation vs. Regression: A Key Difference That Many Analysts Miss
"Correlation and regression have many similarities and can often both be applied to the same data. The key quantities (r and b, respectively) are interpreted differently, but what many analysts miss is that the two actually tell us substantively different pieces of information about our data."

Representing Matrices as JSON Objects: Part 1 - General Considerations
"Representing a matrix as a JSON object is a task that appears in many modern data science contexts, in particular when one wants to exchange matrix data online. While there is no universally agreed way to achieve this task in all circumstances, in this series of posts we discuss a number of options and the associated tradeoffs."
HTML attributes vs DOM properties
"Attributes and properties are fundamentally different things. You can have an attribute and property of the same name set to different values."
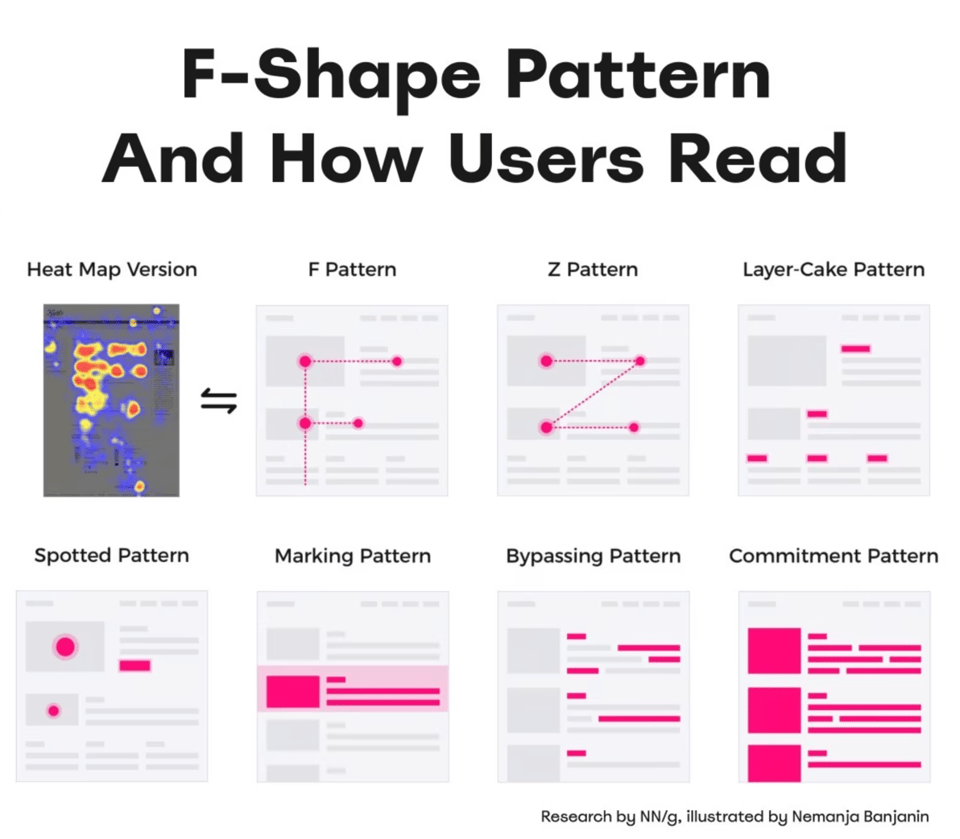
F-Shape Pattern And How Users Read
"Scrolling, scanning, skipping: How do users consume content online? Here’s what you need to know about reading behavior and design strategies to prevent harmful scanning patterns."
Django from first principles
Literally how to start a Django project with a single file, then iterating.
jnv
An "interactive JSON filter using jq".

monolith
A "CLI tool for saving complete web pages as a single HTML file".
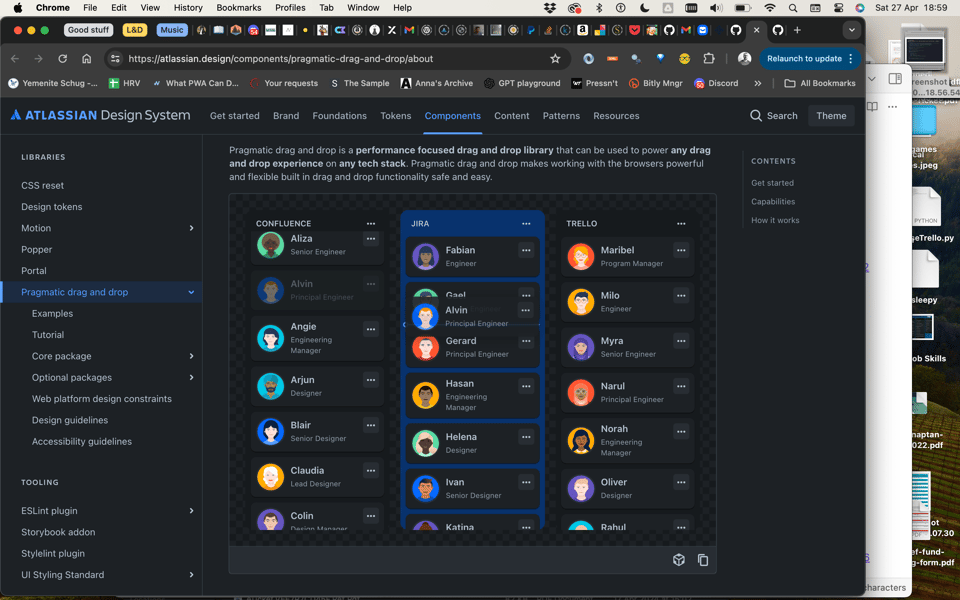
pragmatic-drag-and-drop
"Fast drag and drop for any experience on any tech stack". By Atlassian, which explains it here.
tiny-world-map
"tinyworldmap is a tiny world map for offline-first and low-bandwidth web apps". Basically, an Open Street Map single file view without a lot of detail, but good enough for general purpose applications.

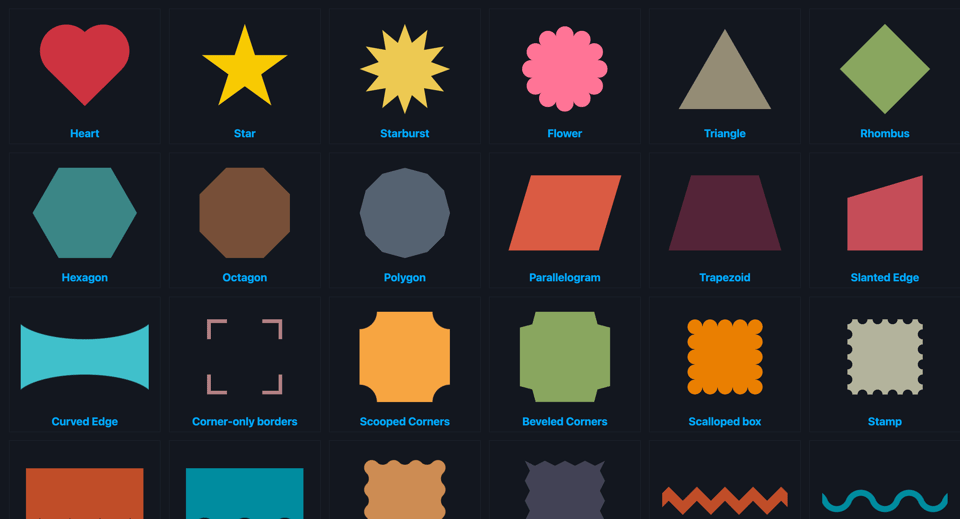
The Ultimate Collection of CSS-only Shapes
"Pure CSS shapes made with a single-element, modern CSS and an optimized code."
📈Dataviz, Data Analysis, & Interactive
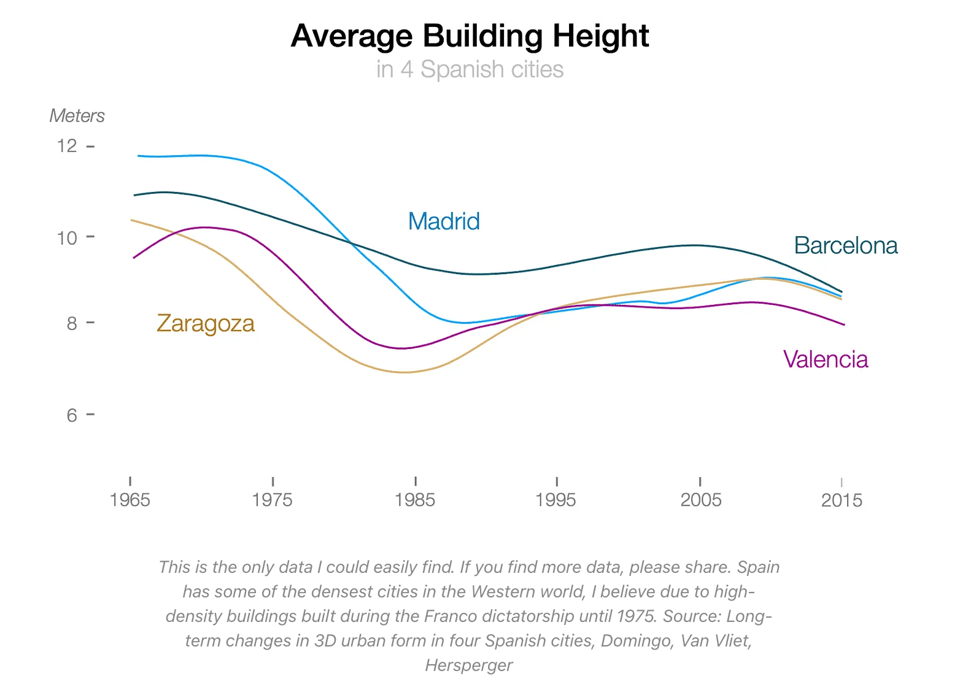
Why I Don’t Invest in Real Estate
"Real estate has been a great investment for so long that people think it always will be."
As the author notes, this is limited to developed economies. It comes with some good data about housing, birth rates, and so on.
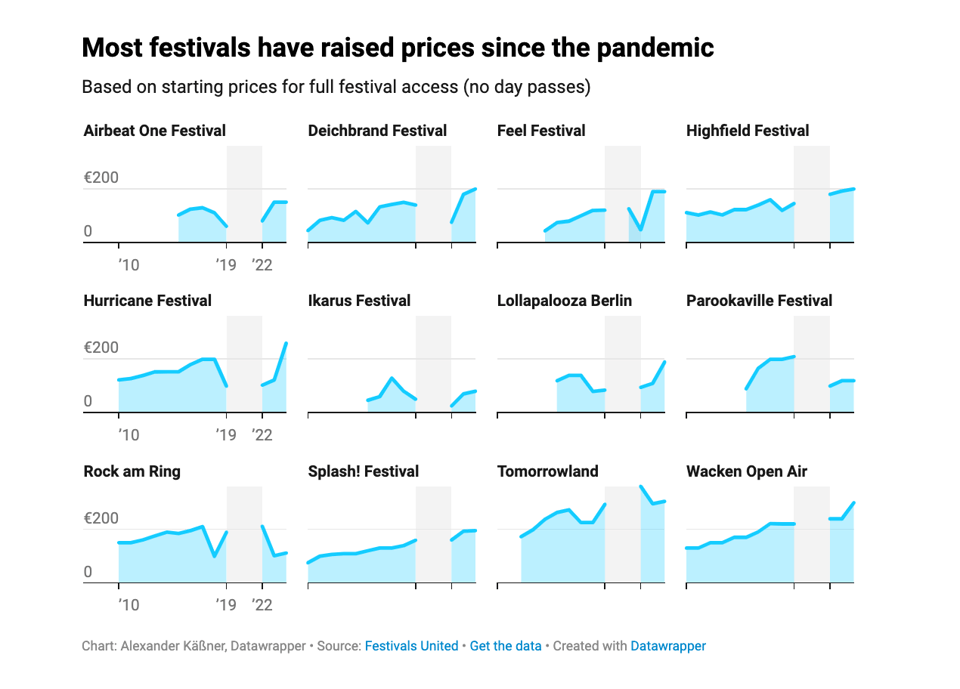
Music festivals in Europe
Datawrapper's Alexander Käßner: "There are around 1900 music festivals planned in Europe this year."
Who is Sleeping, by Age and Time
Flowing Data's Nathan Yau: "When we’re young, we tend to have fewer responsibilities, which means we can sleep and wake up later. Then work and parenting come along, and our schedules grow more structured. We can see the shift in the percentage of people who are sleeping, given their age."

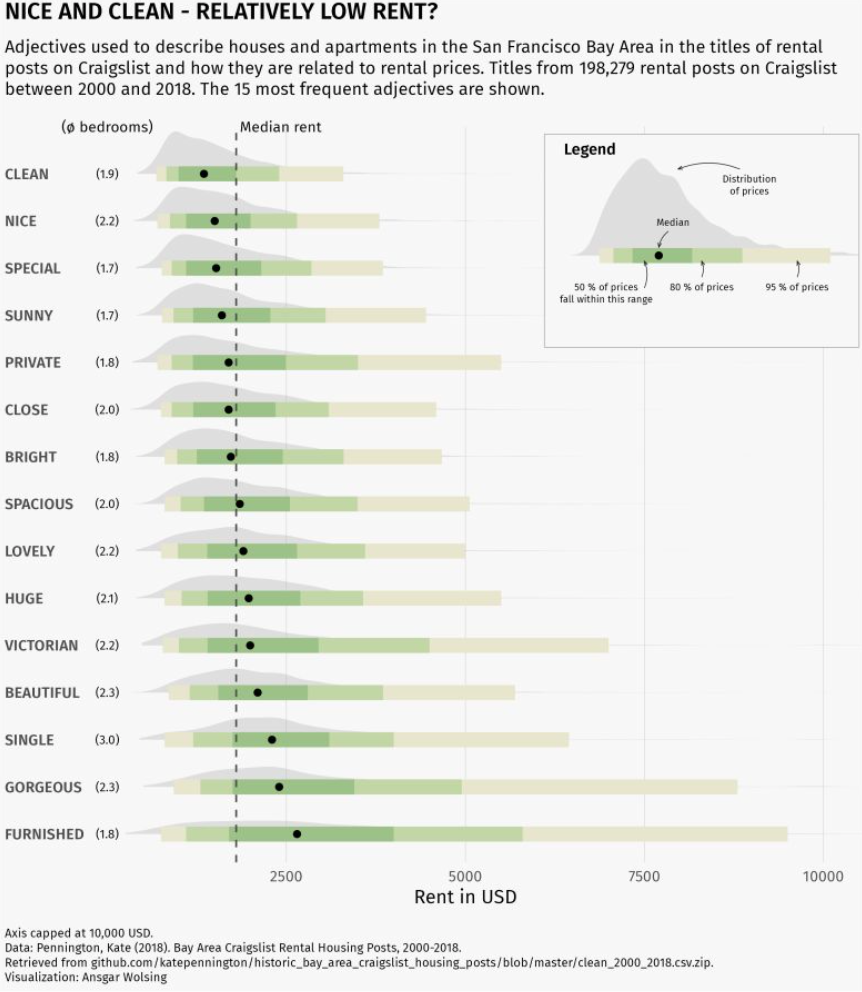
What adjectives are used to describe
"...houses and apartments in Craigslist rental listings, and how do they relate to rental prices?".
Ansgar Wolsing shares his chart and code.
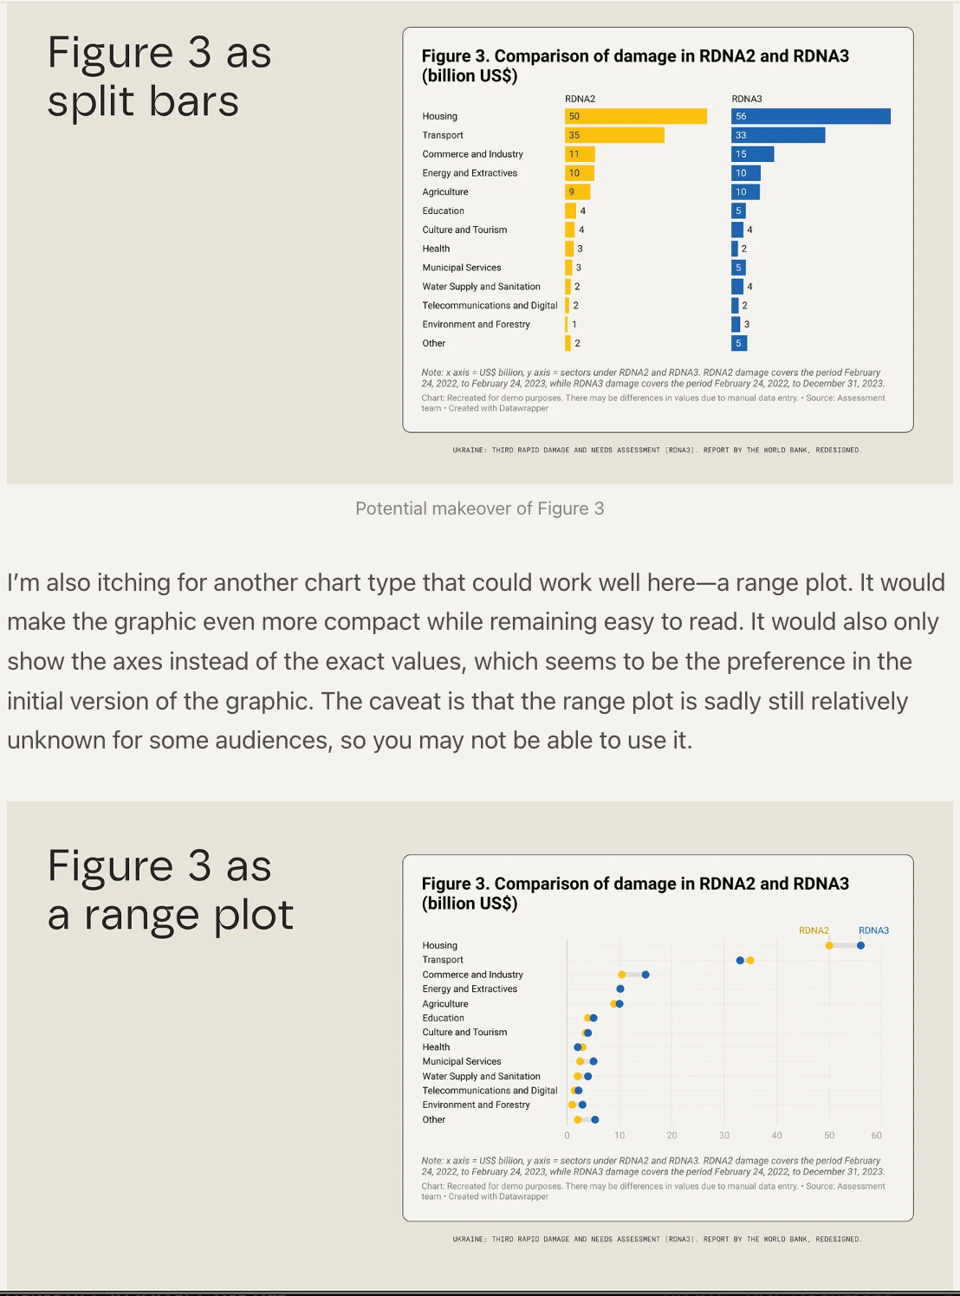
Modest makeover
Evelina Judeikyte (The Plot) presents her "alternative chart design options for a report by the World Bank". She's absolutely right.
|
DID YOU LIKE THIS ISSUE>? → BUY ME A COFFEE! 
You're receiving this email because you subscribed to Quantum of Sollazzo, a weekly newsletter covering all things data, written by Giuseppe Sollazzo (@puntofisso). If you have a product or service to promote and want to support this newsletter, you can sponsor an issue. |
quantum of sollazzo is also supported by Andy Redwood’s proofreading – if you need high-quality copy editing or proofreading, check out Proof Red. Oh, and he also makes motion graphics animations about climate change.
