558: quantum of sollazzo
#558: quantum of sollazzo – 16 April 2024
The data newsletter by @puntofisso.

Hello, regular readers and welcome new ones :) This is Quantum of Sollazzo, the newsletter about all things data. I am Giuseppe Sollazzo, or @puntofisso. I've been sending this newsletter since 2012 to be a summary of all the articles with or about data that captured my attention over the previous week. The newsletter is and will always (well, for as long as I can keep going!) be free, but you're welcome to become a friend via the links below.
I hope you missed QoS :) I took a good break and I'm now all ready to roll. It's almost 12 years since I started Quantum, and can't wait to celebrate when I reach the next power of 2.
Some of you might be interested in this amazing Data Ethics Lead job vacancy going at Surrey County Council – it's part-time, but they are open to how flexible that can be.
The role is based in Reigate and here's a short description: "Surrey County Council is piloting a new approach to data ethics. We are seeking someone to support the organisation to identify, address and mitigate data ethics dilemmas, ensuring the council does the right thing, above and beyond solely complying with its legal obligations around data. Across a pilot year this role will implement, refine, and review, a framework which has been developed as part of the council's wider data strategy.".
All details can be found on their website.
Last issue's most clicked link was The Pudding's look at the greatest music albums of all times.
'til next week.
Giuseppe @puntofisso
|
Before you go... DO YOU LIKE QUANTUM OF SOLLAZZO? → BECOME A SUPPORTER! :) If you enjoy this newsletter, you can support it by becoming a GitHub Sponsor. Or you can Buy Me a Coffee. I'll send you an Open Data Rottweiler sticker. You're receiving this email because you subscribed to Quantum of Sollazzo, a weekly newsletter covering all things data, written by Giuseppe Sollazzo (@puntofisso). If you have a product or service to promote and want to support this newsletter, you can sponsor an issue. |
✨ Topical
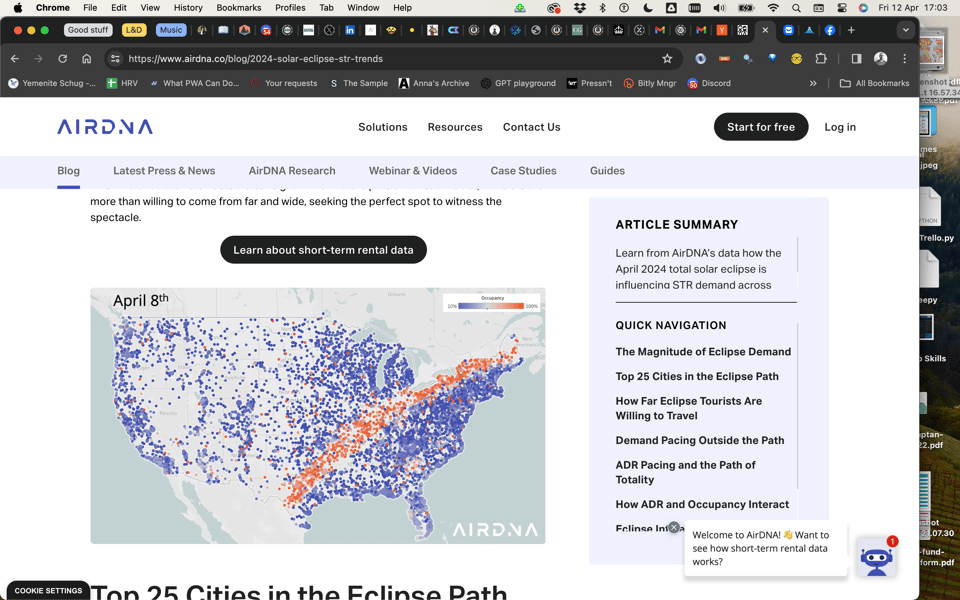
Viewing the 2024 Solar Eclipse Through a STR Lens: Trends and Takeaways
You've probably seen this map (or variations of it) already – this is where it comes from, together with the analysis.
England’s sewage crisis: how polluted is your local river and which regions are worst hit?
"Rivers in north of England among most polluted, shows new data. Search your postcode to see how sewage spills into your local river."
Brilliant dataviz, and extra points for having a methodology paragraph.
(via Chris Weston)

Where would Germany be without Fukushima?
Datawrapper's Lisa Charlotte Muth: "On March 11, 2011, at 2:46pm, 72km east off the Japanese coast, the ocean floor shook. The strongest earthquake ever recorded in Japan lasted six minutes. Fifty minutes later, waves 13 meters high hit the Fukushima Daiichi nuclear power plant. [...] The world was in shock. On the other side of the planet, in Germany, this happened."

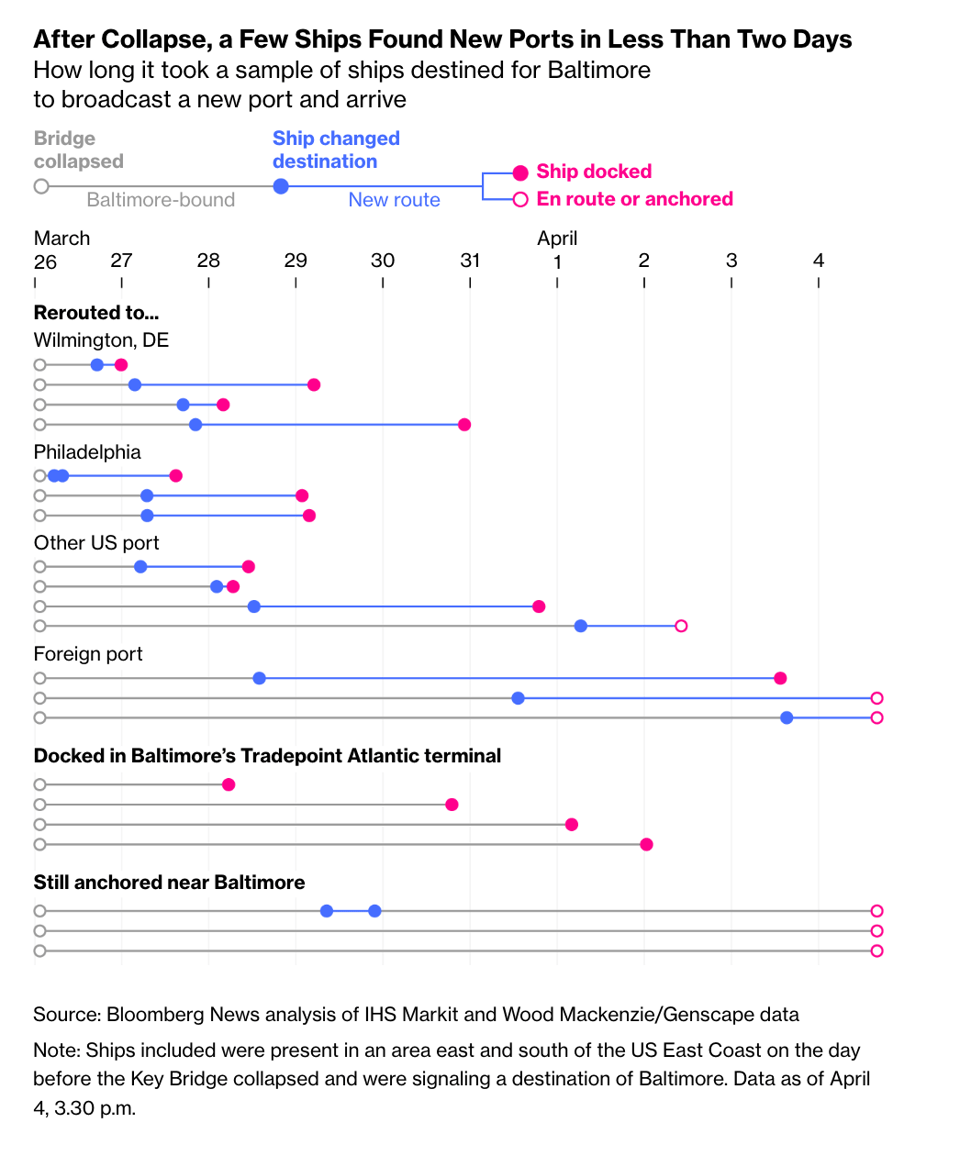
What Happened to Ships Bound for Baltimore When the Bridge Fell
Bloomberg: "Dozens of ships had to reroute after the Baltimore bridge collapse sealed off a key US port. Here’s where they went."
🛠️📖 Tools & Tutorials
A Guide to Structured Generation Using Constrained Decoding
Aidan Cooper presents "the how, why, power, and pitfalls of constraining generative language model outputs".
"There are techniques that ensure language models only return outputs that conform to your requirements. This article serves as a practitioner's guide for perhaps the most powerful of these techniques: constrained decoding. We'll cover what structured generation and constrained decoding are, how they work, best practices, useful patterns, and pitfalls to avoid."
drawDB
"Draw, Copy, and Paste – Free, simple, and intuitive database design tool and SQL generator."
It's open source.

Spatial Analysis of Big Data with pgvector: Finding the Nearest Point among 100 Million Points in Istanbul
"In this blog post, we will explore how to utilize powerful tools like PostGIS and pgvector to find the nearest points in a dataset of 100 million points."

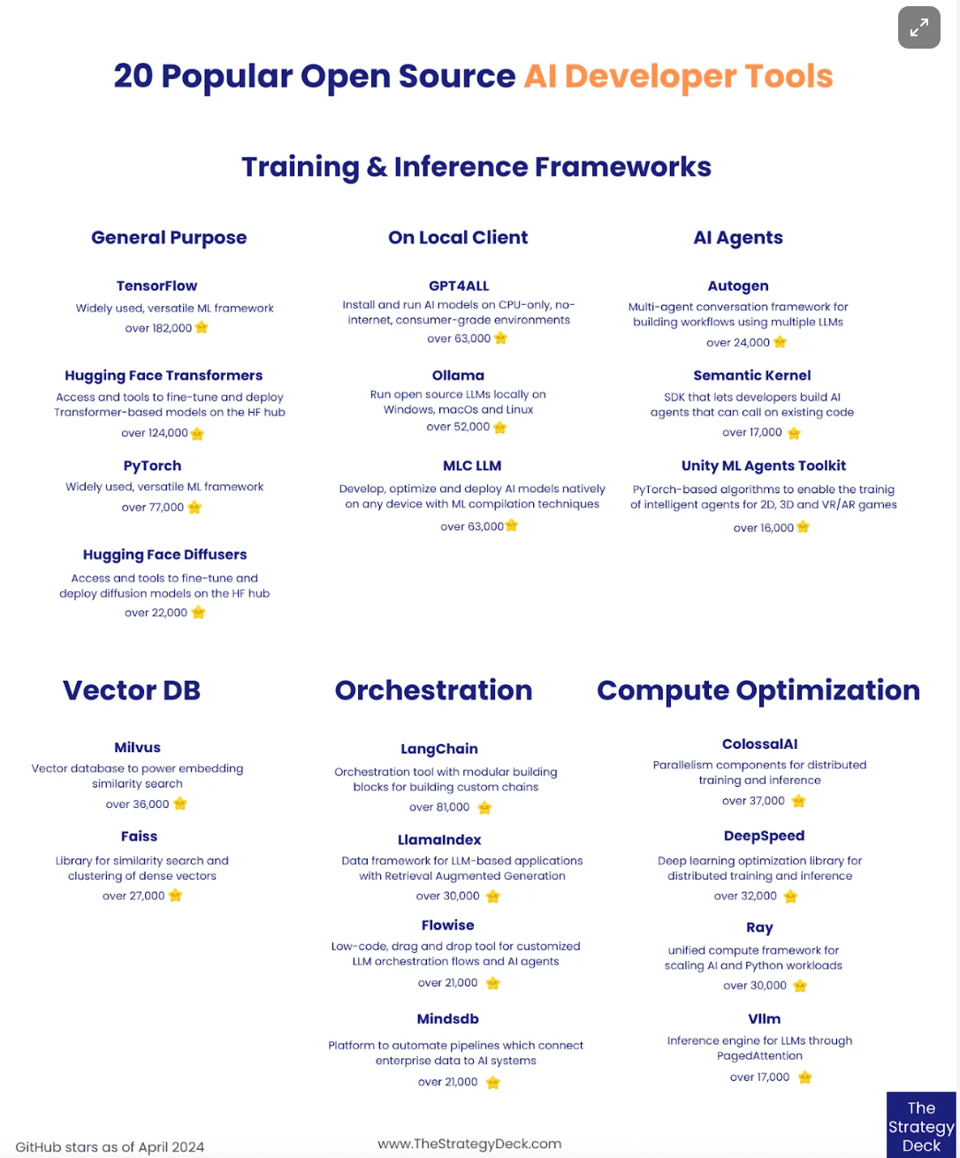
20 Popular Open Source AI Developer Tools
"This is a collection of some of the most popular open source AI and ML developer tools, ranked by the number of stars they have on GitHub, for projects active in 2023 and 2024. It focuses on developer applications used to train and deploy ML models and AI agents and its purpose is to highlight the breadth and diversity of tools and frameworks that are being built by the open source AI community and the vast potential in the space. "
Make Your Own NOAA Sea Temperature Graph
"Sea-surface temperatures in the North Atlantic have been in the news recently as they continue to break records. While there are already a number of excellent summaries and graphs of the data, I thought I’d have a go at making some myself. The starting point is the detailed data made available by the National Centers for Environmental Information, part of NOAA."
Good tutorial that also explains how to manipulate the dreaded netCDF format.

🤯 Data thinking
What Great Data Analysts Do — and Why Every Organization Needs Them
A big cheer for data analysts.
"“Full-stack” data scientist means mastery of machine learning, statistics, and analytics. Today’s fashion in data science favors flashy sophistication with a dash of sci-fi, making AI and machine learning the darlings of the job market. Alternative challengers for the alpha spot come from statistics, thanks to a century-long reputation for rigor and mathematical superiority. What about analysts?Whereas excellence in statistics is about rigor and excellence in machine learning is about performance, excellence in analytics is all about speed. Analysts are your best bet for coming up with those hypotheses in the first place. As analysts mature, they’ll begin to get the hang of judging what’s important in addition to what’s interesting, allowing decision-makers to step away from the middleman role. Of the three breeds, analysts are the most likely heirs to the decision throne."
Interestingly, I think that "data analyst" as a job title has gone out of fashion for many (wrong) reasons, or it has become associated with clerical or financial roles that are often unappealing to the data crowd. And yet, it's a label that I often find pretty descriptive about what many data workers actually do in their job.
(via Lisa Riemers)
📈Dataviz, Data Analysis, & Interactive
Challenge: Predicting [Lunar] Eclipses
"Those questions always lurked in the back of my mind until over the holiday season when I was idly surfing YouTube (specifically, I bumped on this and this). There I learned about the Saros cycles — “a period of 6585.3211 days (14 common years + 4 leap years + 11.321 days, or 13 common years + 5 leap years + 10.321 days), is useful for predicting the times at which nearly identical eclipses will occur.“ (from Wikipedia)."
Pretty fun, geeky article that will teach you a thing or two.
From the same author, there is also some travel planning advice, using some of the aforementioned techniques.
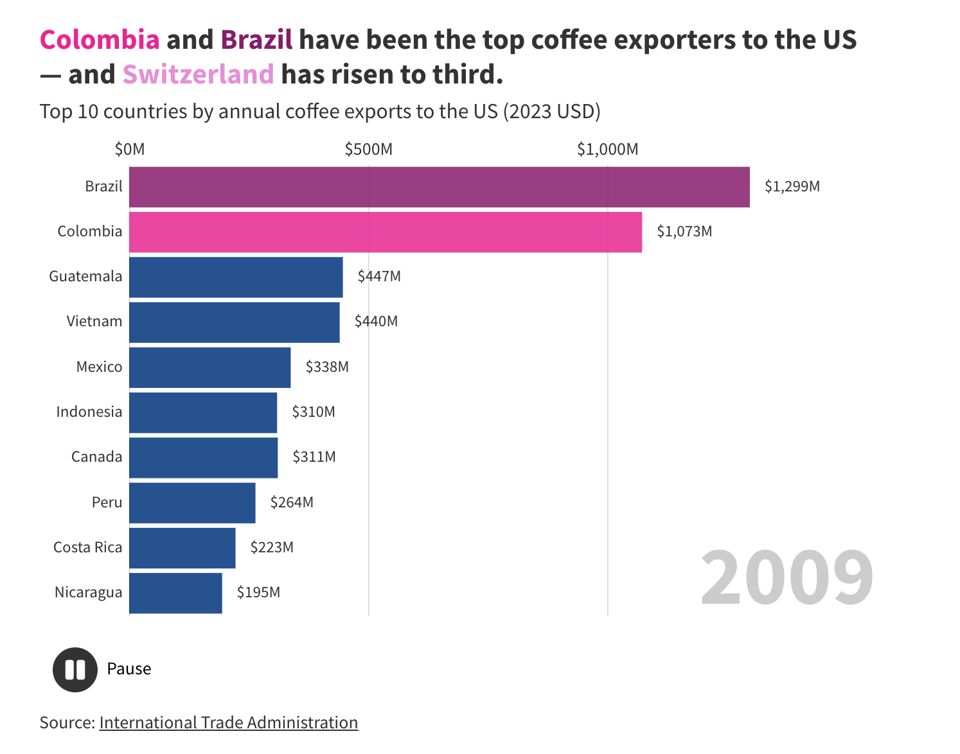
Where does America’s coffee come from?
"Aside from a small fraction grown in Hawaii, all of America’s coffee comes imported from countries like Colombia, Brazil, and Switzerland."
Obviously, Switzerland doesn't grow coffee on the Alps...
Close
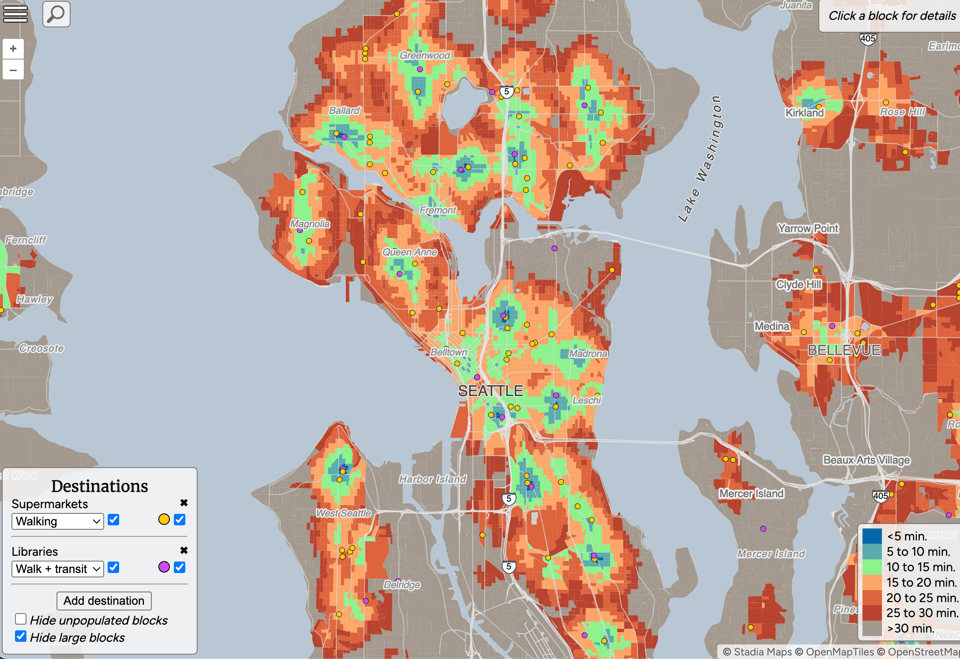
"Proximity governs how we live, work, and socialize. Close is an interactive travel time map for people who want to be near the amenities that matter most to them."
🤖 AI
AI Could Actually Help Rebuild The Middle Class
"AI doesn’t have to be a job destroyer. It offers us the opportunity to extend expertise to a larger set of workers."
It doesn't have to... but the devil is in the details.
quantum of sollazzo is also supported by Andy Redwood’s proofreading – if you need high-quality copy editing or proofreading, check out Proof Red. Oh, and he also makes motion graphics animations about climate change.

Supporters*
Alex Trouteaud
casperdcl
[*] this is for all $5+/months Github sponsors. If you are one of those and don't appear here, please e-mail me