556: quantum of sollazzo
#556: quantum of sollazzo – 12 March 2024
The data newsletter by @puntofisso.

Hello, regular readers and welcome new ones :) This is Quantum of Sollazzo, the newsletter about all things data. I am Giuseppe Sollazzo, or @puntofisso. I've been sending this newsletter since 2012 to be a summary of all the articles with or about data that captured my attention over the previous week. The newsletter is and will always (well, for as long as I can keep going!) be free, but you're welcome to become a friend via the links below.
The most clicked link last week was, somewhat unsurprisingly (I know you lot by now), the incredible Cities Moving transport dataviz by the University of Vienna.
I was a guest on Zülkhe's Data Today podcast with Dan Klein. I'm told it's temporarily unavailable as we go to press, but it should be online soon – subscribe to it and you'll hear me speak about data in the public sector, something about carving an unconventional career in data, the ethics of data-driven processes, and why transparency and communication are still at the core of my work with data.

'till next week,
Giuseppe @puntofisso
|
Before you go... DO YOU LIKE QUANTUM OF SOLLAZZO? → BECOME A SUPPORTER! :) If you enjoy this newsletter, you can support it by becoming a GitHub Sponsor. Or you can Buy Me a Coffee. I'll send you an Open Data Rottweiler sticker. You're receiving this email because you subscribed to Quantum of Sollazzo, a weekly newsletter covering all things data, written by Giuseppe Sollazzo (@puntofisso). If you have a product or service to promote and want to support this newsletter, you can sponsor an issue. |
✨ Topical
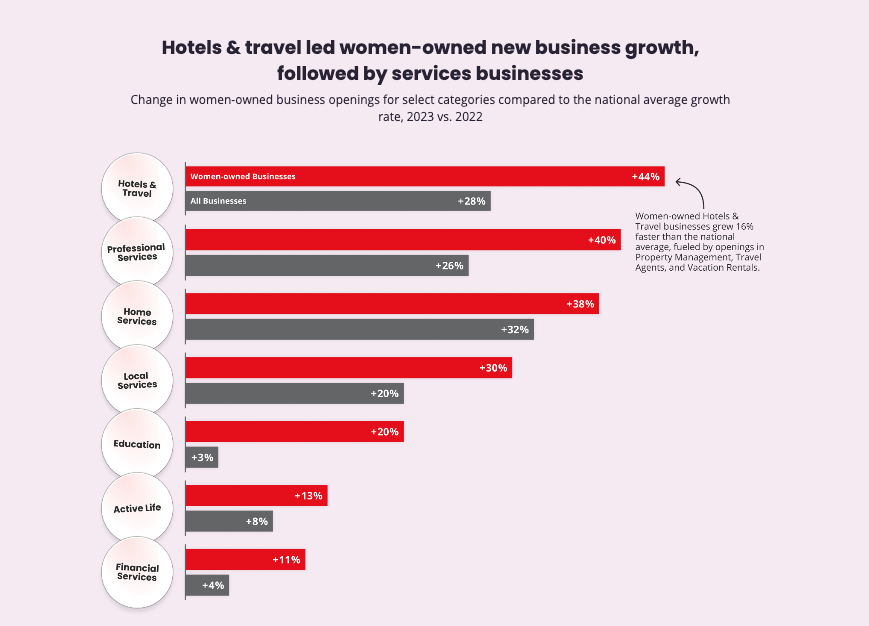
Yelp – Sheconomy Trend Report
"The Year of the Girl continues with women at the center of economic growth and consumer trends".
The full methodology is also available.
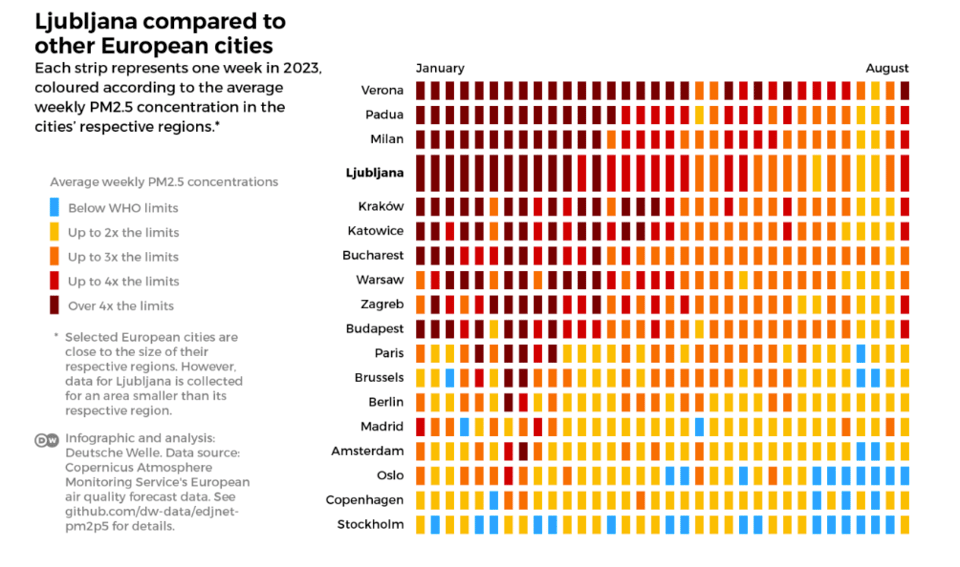
Fine particles in the air: Ljubljana among the most polluted European cities
From the European Data Journalism network: "Fine particle pollution causes premature births, illness, and, in Slovenia, more than 800 preventable deaths every year."
I remember looking into this quite a bit when I moved from Bologna to London. I'm not sure if this is still the case, but in the mid-2000s Bologna used to have a level of fine particles that was way over that of London, probably caused by the almost total lack of wind and the topography of the hills surrounding the town. The feeling of choking was common.
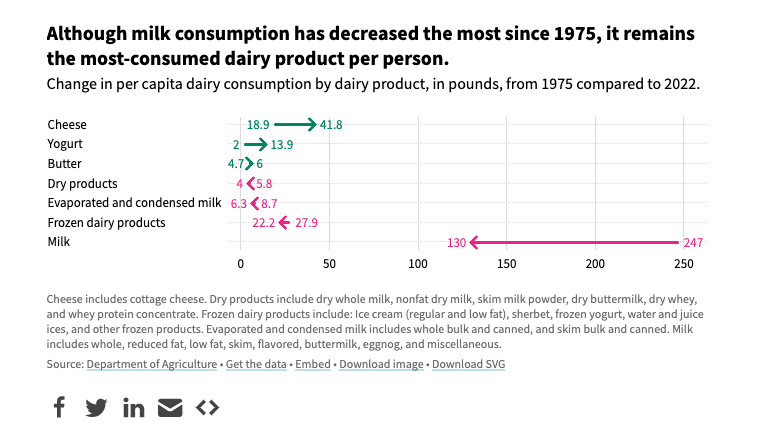
Are Americans moving on from dairy?
USA Facts: "Milk production in the US has almost doubled since 1975, but people drink nearly half as much milk as back then."
I suppose some of this is because cheese has had a resurgence in how fashionable it is, and yogurt has become a staple – rightly or not – of healthier diets.
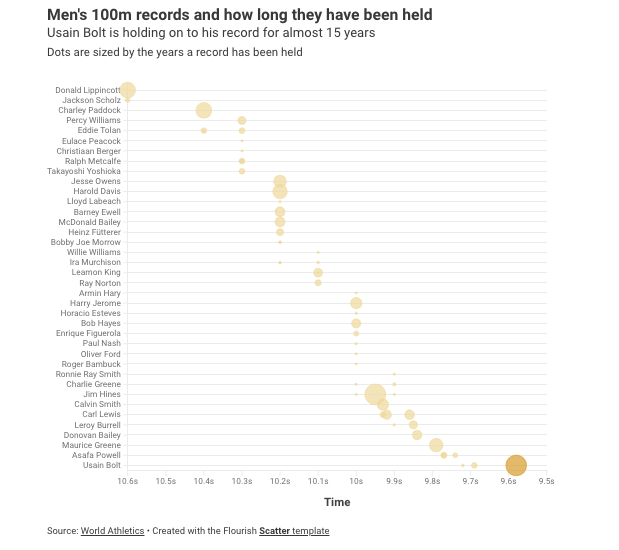
How to visualize the Olympics
Flourish: "Exploring the evolution, achievements, and highlights of the Winter and Summer Olympics through data visualization."
It's a good gallery of Flourish's own abilities, but also an interesting set of analysis of trends. I had forgotten that every Olympics has some athletes that are well into their 70s, for example.
🛠️📖 Tools & Tutorials
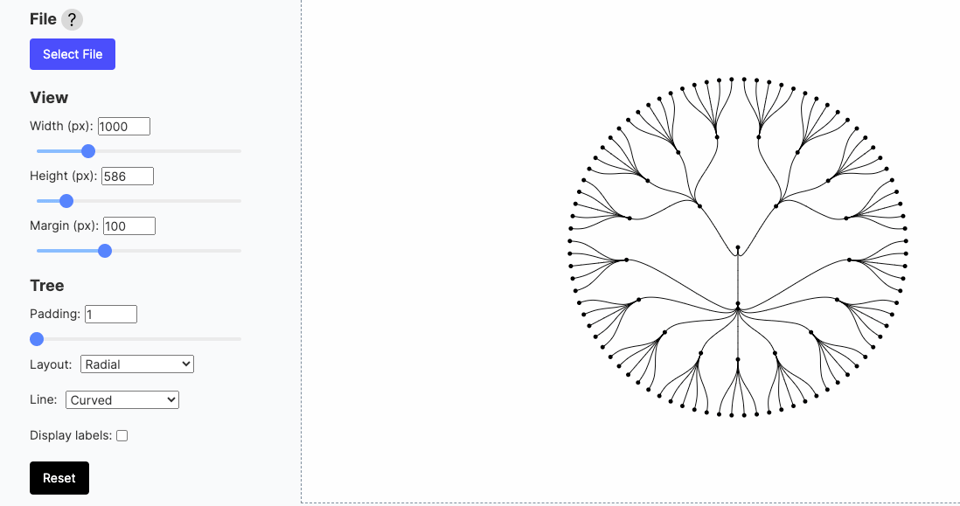
Tree chart generator
Another useful tool, mostly for Tableau users, by LADataViz.
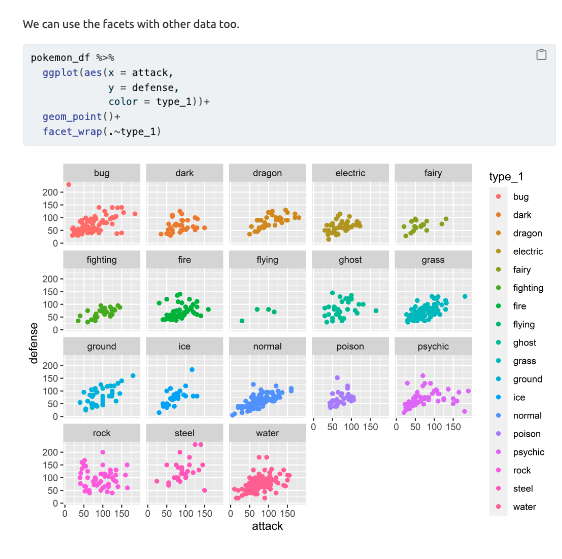
ggplot 101
A simple tutorial for the R dataviz library.
Autogenerating a Book Series From Three Years of iMessages
I'm not sure why you would want to do this but... the technique used to extract the message database might be useful, and the source code is also shared.
Tools for the analysis of movement data
GIS guru Anita Graser: "A collection of open source projects in the upcoming field of movement data science (ordered by main language and first GitHub commit date)."
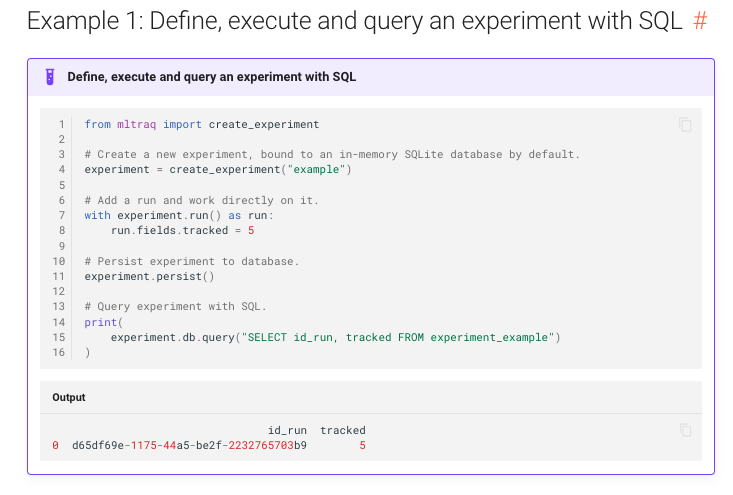
MLTraq
A tool to track and collaborate on AI experiments.
What about getting your advert here? :-)
🤯 Data thinking
Maybe metadata isn't as boring as it sounds
"A metadata skeptic meets a believer" – by Count/More Than Number's Taylor Brownlow.
📈Dataviz, Data Analysis, & Interactive
Full Of Themselves
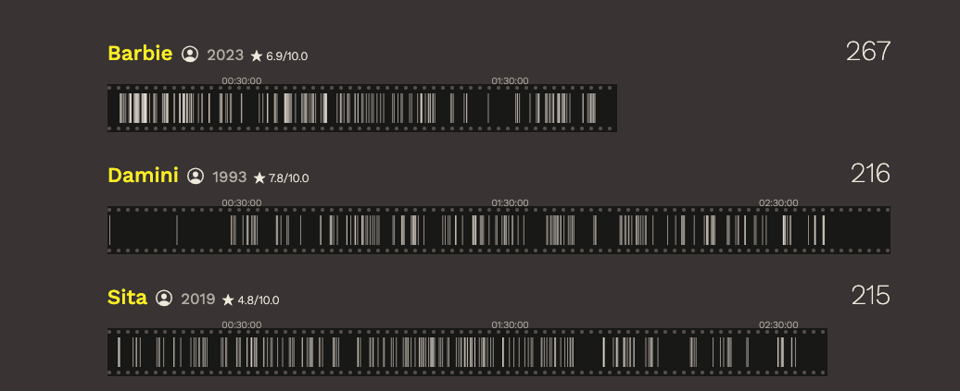
"An analysis of title drops in movies" – basically, a visualization of films in which one of the characters says the film title. The first one that springs to mind is obviously "Back to the future" (although I have to admit the only occurrence I could remember is the one at the end of the 3rd film).
Obviously, films that are called like one of the characters are at a slight advantage...
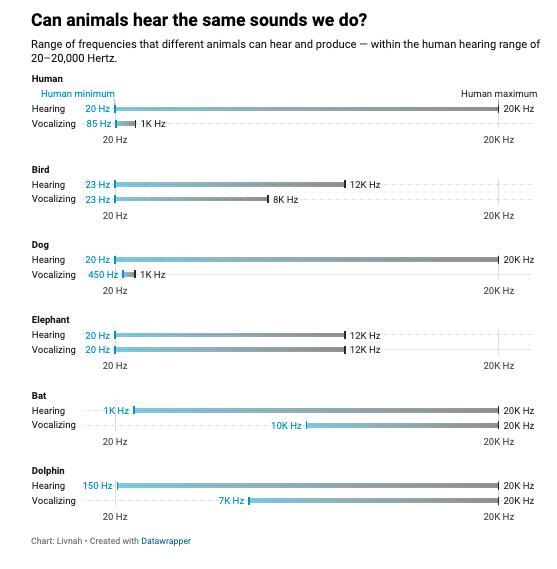
Shh! Animals are sleeping
In the jungle, the mighty jungle... Datawrapper's Livnah looks at animal sounds frequency and how they could affect sleep.
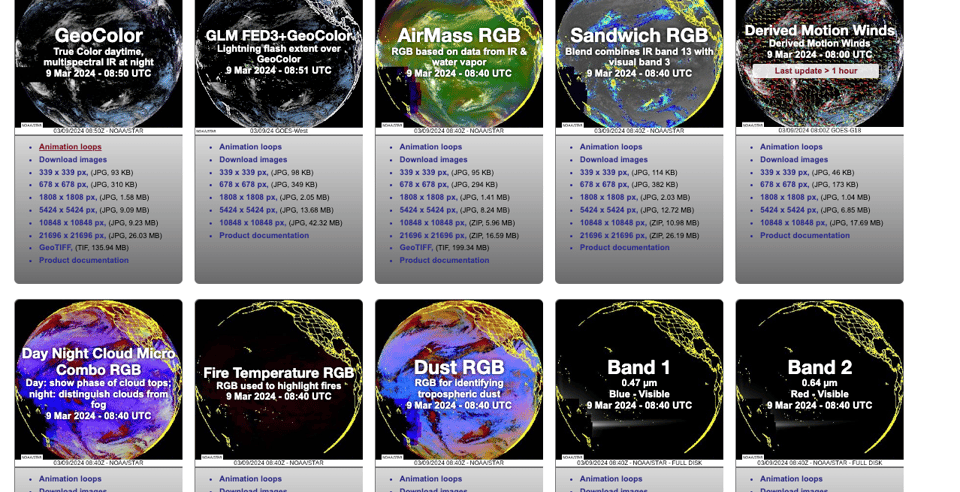
GOES Image Viewer
Quasi real-time satellite images of the blue marble from NOAA
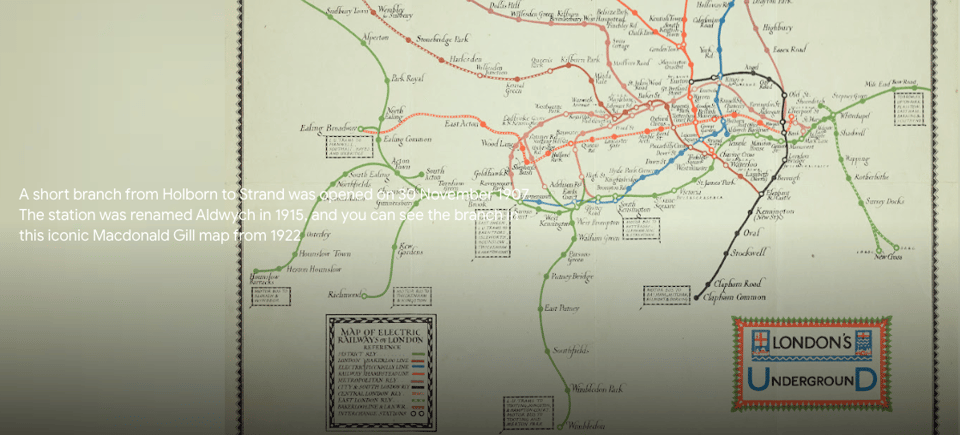
A journey through time
"Embark on a quirky commute through TfL's history" – good curated stories using Transport for London's map archive.
(via Alex Wrottesley)
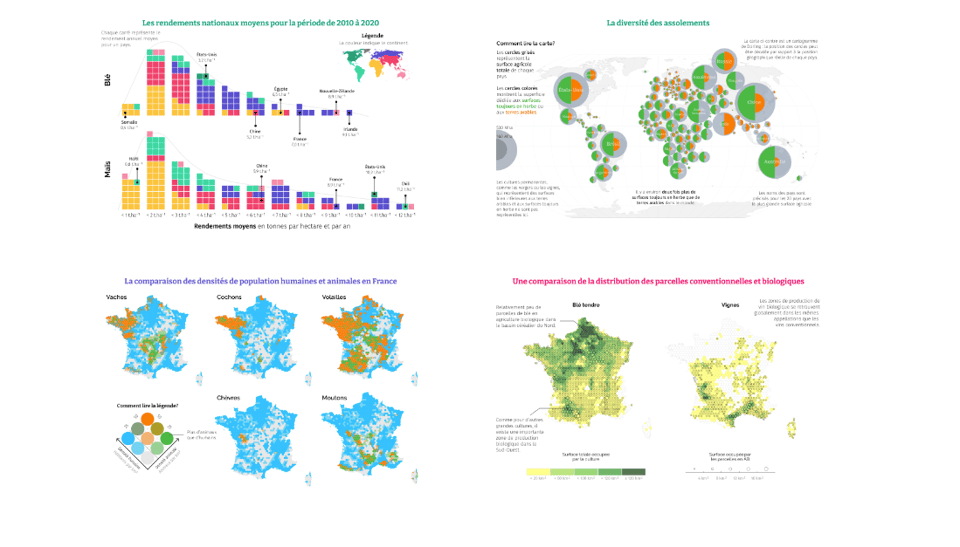
Mémo visuel d'agronomie
Lecturer Benjamin Nowak: "In the book Mémo visuel d’agronomie I present various agronomy concepts, illustrated by 100 data visualizations."
On this website, he presents a few of those, explaining how they were created in R.
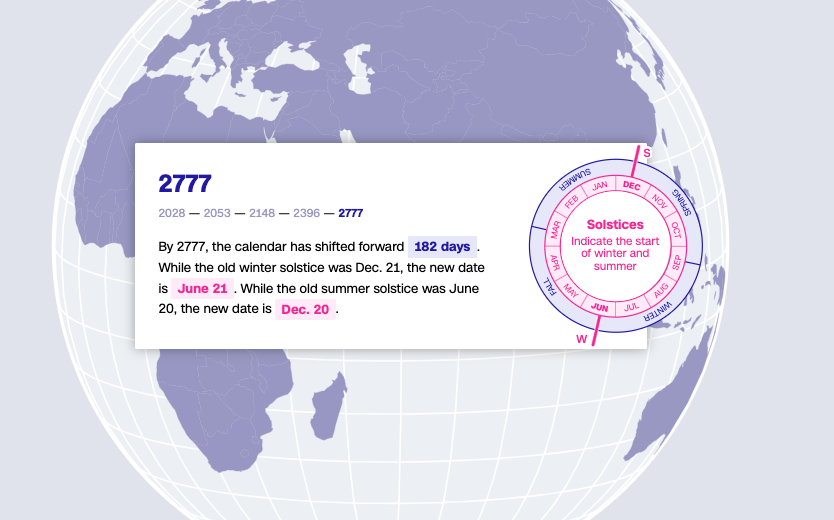
What would happen if we didn’t have leap years?
"CNN answers the question on many people’s minds this February 29: Why do we add an extra day?"
🤖 AI
AI Could Actually Help Rebuild The Middle Class
David Autor for Noema: "AI doesn’t have to be a job destroyer. It offers us the opportunity to extend expertise to a larger set of workers."
quantum of sollazzo is also supported by Andy Redwood’s proofreading – if you need high-quality copy editing or proofreading, check out Proof Red. Oh, and he also makes motion graphics animations about climate change.

Supporters*
Alex Trouteaud
casperdcl
[*] this is for all $5+/months Github sponsors. If you are one of those and don't appear here, please e-mail me